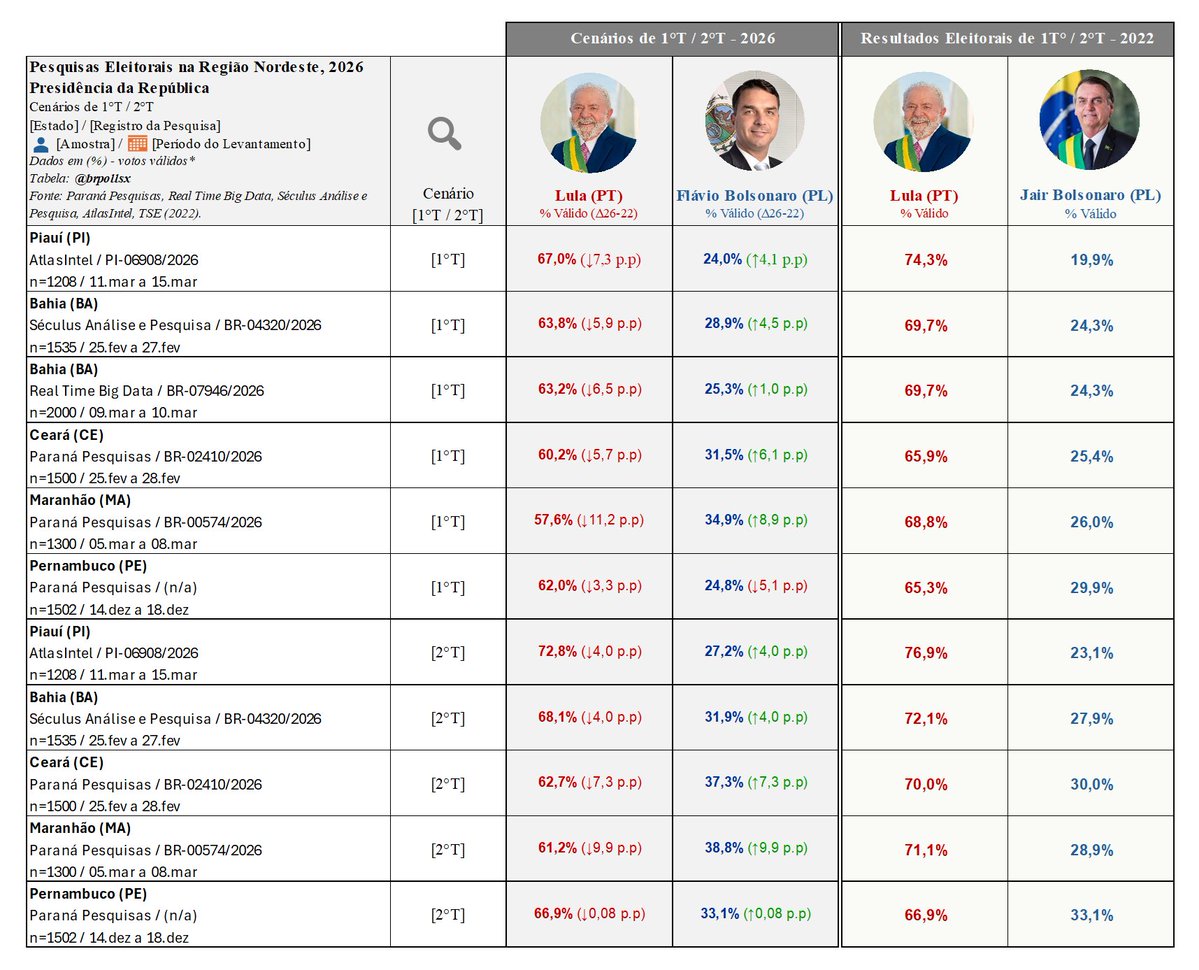
Andrei Spacov
4.9K posts

Andrei Spacov
@AndreiSpacov
PhD em Economia pela University of California, Berkeley. Economia, mercados e vai Corinthians !!! Leia Eclesiastes
Beigetreten Şubat 2015
397 Folgt8.1K Follower
Angehefteter Tweet

@_robertomotta Boa, acho que a pergunta é: diante de um choque de oferta deste tamanho, os Bancos Centrais do mundo todo tendem a ficar mais ou menos complacentes com a inflação?
Português
Andrei Spacov retweetet

Markets are reacting to a risk of a global LNG crisis, which is much worse than an oil shock.
An oil shock is quickly solved by non-OPEC supply, alternatives, and flexible systems. LNG is only 15% of the total gas market but very tight in supply and much more challenging to solve, adding to the problems of regasification and storage.
via Bloomberg

English
Andrei Spacov retweetet

One of Brazil’s biggest brokerage firms is launching a fund to buy distressed assets as the nation’s corporate defaults reach record levels bloomberg.com/news/articles/…
English
Andrei Spacov retweetet

Gold and silver are not acting well in a period of rapidly rising geopolitical risks. We have an Iran War, Strait of Hormuz blockade, rising volatility. In the old framework, that setup should be close to ideal for gold. But once you understand what is now driving gold, this move makes perfect sense.
Something fundamental changed after the US and Europe froze Russian reserves in 2022. For decades, surplus countries parked their excess savings in US dollar assets, mostly Treasuries. The freezing of Russian reserves combined with the current administration's explicit push to discourage foreign countries from parking excess savings in US financial assets, forced surplus countries to rethink where they store reserves.
And those countries haven't changed their domestic policies that generate the excess savings, so those savings have to be placed somewhere. The result is that gold and silver have increasingly become the obvious “neutral” reserve assets.
That’s why gold decoupled from the three factors that used to explain it…real interest rates, volatility, and liquidity. Now reserve accumulation flows have become the primary driver.
That shift has a consequence I don’t think most investors have thought through. If gold is now primarily driven by reserve flows from surplus countries, then gold has become pro-cyclical.
Reserve growth is driven by export revenues, trade surpluses, economic growth in surplus economies. When the global economy is strong and surplus countries are generating large export revenues, their excess savings grow, their reserve accumulation accelerates, and gold catches a bid. When that surplus generation is disrupted, the bid weakens or reverses.
This is exactly what is happening with the blockade of the Strait of Hormuz.
The GCC countries are major reserve/gold buyers and now their export revenues are collapsing. They likely need to liquidate some reserves to cover fiscal obligations, and gold is one of their most liquid assets. Even if the reserve sales aren’t excessive yet, the market can see their reserve accumulation has stalled and probably reversed. That flow, which was a meaningful source of gold demand, has gone to zero at best.
There are also secondary effects on other surplus economies. China is the world's largest oil importer. An energy shock of this magnitude slows Chinese growth, and compresses Chinese surpluses, which slows Chinese reserve accumulation. That same growth shock ripples through Korea, Taiwan, Japan, and the rest of Asia.
The whole chain that has been driving gold higher, surplus countries generating excess savings that need a home outside the dollar system, is being disrupted by an event that in the old model would have been unambiguously bullish for gold.
This doesn't mean the structural case for gold is broken. The dollar standard is still ending. Surplus countries still need an alternative to Treasuries and gold is still the most obvious destination. But it does mean gold is going to be more volatile along that structural trend than most people expect, and the volatility will correlate with global growth and surplus generation rather than with the old drivers. Gold rallies when surpluses expand. Gold sells off when surpluses contract. Even if the reason for the contraction is rising geopolitical risk that, under the old model, should have sent gold to the moon.
English
Andrei Spacov retweetet

“… Shipments from Yanbu have averaged about 4.19 million b/d over the past five days, according to tracking data compiled by Bloomberg — already a significant share of the roughly 7 million b/d the kingdom was exporting in total before the war…”
bloomberg.com/news/articles/…
English

👏👏👏
Smith and Jefferson at 250 open.substack.com/pub/johnhcochr…
English
Andrei Spacov retweetet

I think it's funny to read some of the oil commentary saying that oil prices aren't that "high" today because it's not going to be that "bad".
No man.
That's because there was a cushion at the beginning of the conflict. We are now eating through that.
Here's what I wrote on March 4 in our report titled, "Why Aren't Oil Prices At $100?"
How much storage do we have before the market starts to panic?
Well, here’s the math:
The Middle East exports ~19 million b/d of crude + condensate + products through the Strait of Hormuz. Saudi’s East-West pipeline has a capacity of ~5 million b/d, but a chunk of that was already in-use. UAE also has the ability to bypass with the Abu Dhabi pipeline (Habshan-Fujairah) with a capacity of ~1.8 million b/d.
Excluding Iranian flows (~2 million b/d), that leaves us with ~10 to ~12 million b/d at risk.
We’ve already had 6 days of disruptions. This amounts to ~60 to ~72 million bbls of crude + condensate + product. Production shut-in so far has been restricted to producers with no real storage capacity (Iraq).
Goldman estimates that there are ~312 million bbls of capacity available. So we are still 2 weeks away from needing to shut in more production.
After storage capacity hits max capacity and if tanker flows remain restricted, that’s when we will see panic. Meanwhile, the global oil market is working through the excess crude on water and the surplus in storage that we have in 2025.
By our estimate, excess crude on water and excess onshore storage will be gone in 2-3 weeks. This is roughly the same timeline as the production shut-in scenario.
In other words, if we don’t see tanker activity pick up after 2 weeks, prepare for the worst-case scenario. For now, the oil market is absorbing the shock via the excess in storage. It won’t have much left after.
This is primarily the reason why we haven’t seen oil shoot past triple digits just yet.
English
Andrei Spacov retweetet

The most important chart right now.
Note that this only tracks ships with their AIS (Automated Identification System) turned on, think the GPS on your phone or in your car.
More ships are going through, but they turn off their AIS.
But once they are confidence enough to start going through with AIS on will signal a true reopening has begun.

English

Andrei Spacov retweetet

♦️Here’s a striking example of how a closure of the Strait of Hormuz can reshape global oil flows—and how Saudi Arabia can rapidly adapt by diverting supplies from its eastern fields to western Red Sea terminals.
♦️A VLCC oil tanker was heading northwest to load crude at Ras Tanura in the Persian Gulf. When the strait closed, the vessel turned around and headed instead to the Al Muajjiz terminal on the Red Sea, where Saudi Arabia had already pumped the oil westward through its East-West pipeline system. Now this VLCC is loaded with 2 mb of Arab light and heading to East Asia
♦️The largest and fastest effort to mitigate the impact of the Hormuz crisis is coming from Saudi Arabia.
Map form @Kpler I added the pipelines and the light green arrows.

English
Andrei Spacov retweetet

A huge number of tankers are now waiting to collect oil from Saudi Arabia’s key port in the Red Sea, as Riyadh ramps up its efforts to bypass the Strait of Hormuz bloomberg.com/news/articles/…
English

Ótimo resumo das pesquisas atuais ao nível estadual em comparação com o 2T de 2022.
Ponderando pelo peso dos estados, Lula está pior do que em 2022 principalmente por conta da queda significativa no Nordeste e da pequena queda em SP (devido ao alto peso do estado).
BRPolls_X@brpollsx
📊Levantamentos estaduais mais recentes do Instituto Paraná Pesquisas para o cenário de 2°T [Lula (PT) x Flávio Bolsonaro (PL)] - Presidência da República 2026.
Português
Andrei Spacov retweetet


