NilsTrades

119 posts

NilsTrades banner
NilsTrades

NilsTrades

@nilstrades

Testing 100 trading indicators for statistical edge. Data, not feelings. 📊 New 10-year backtest result daily at 9am ET. Building StratLab.

Beigetreten Mayıs 2024
22 Folgt333 Follower
Angehefteter Tweet
NilsTrades
NilsTrades@nilstrades·
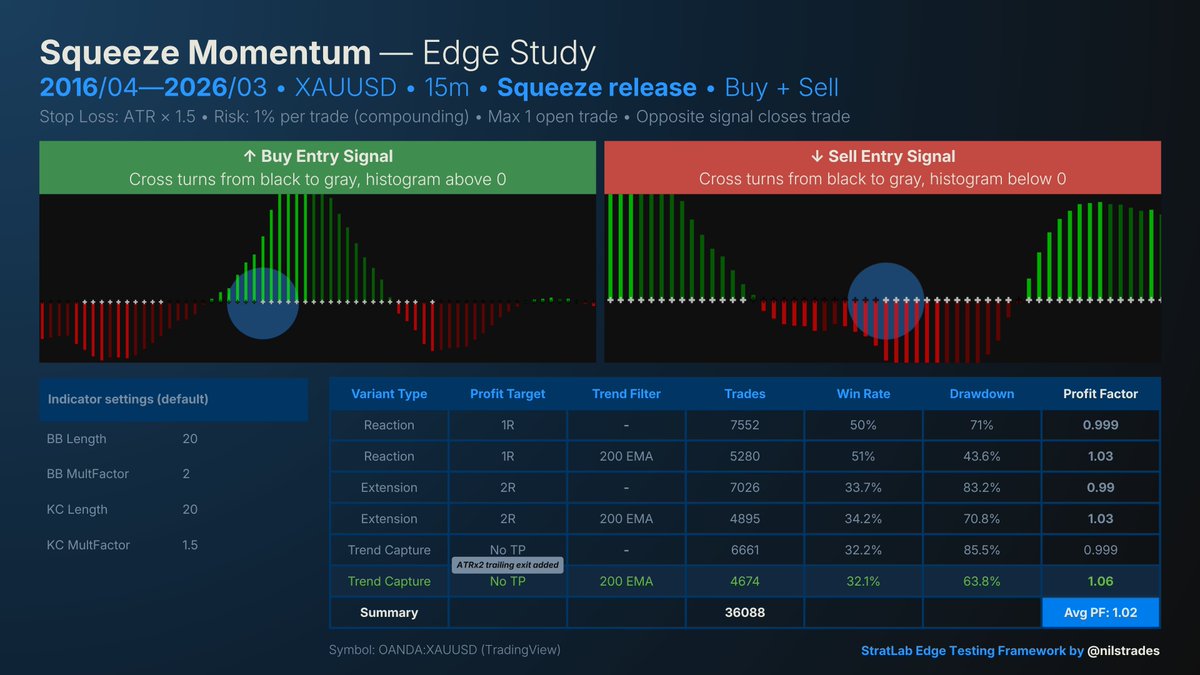
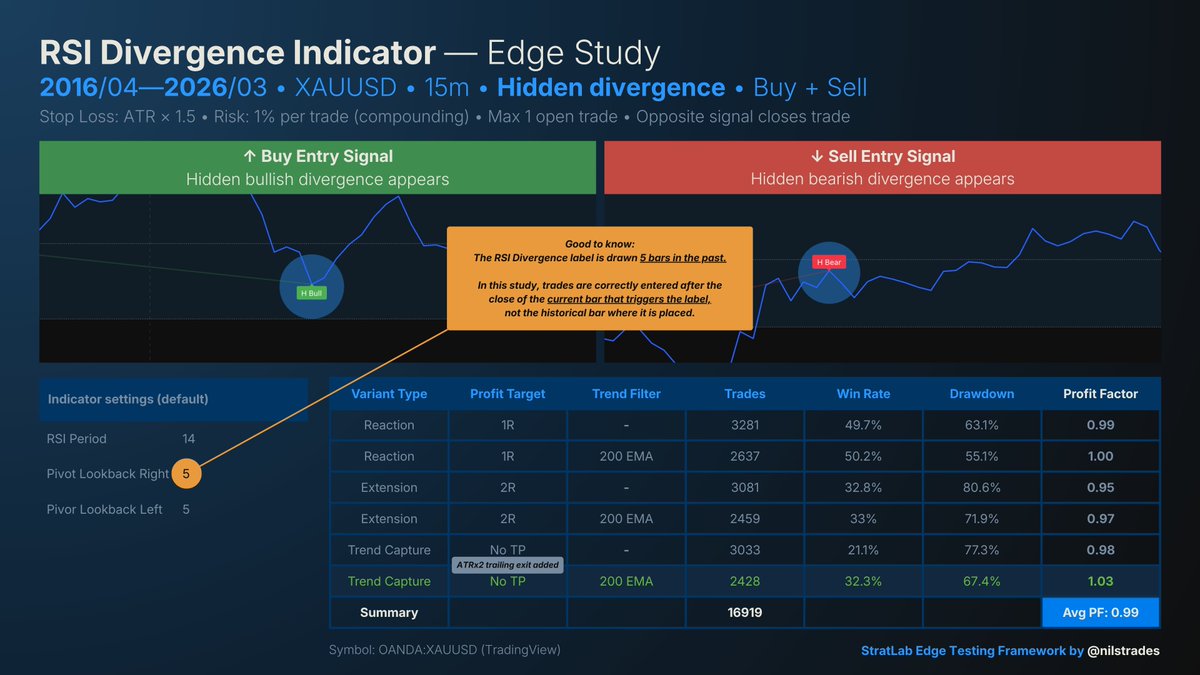
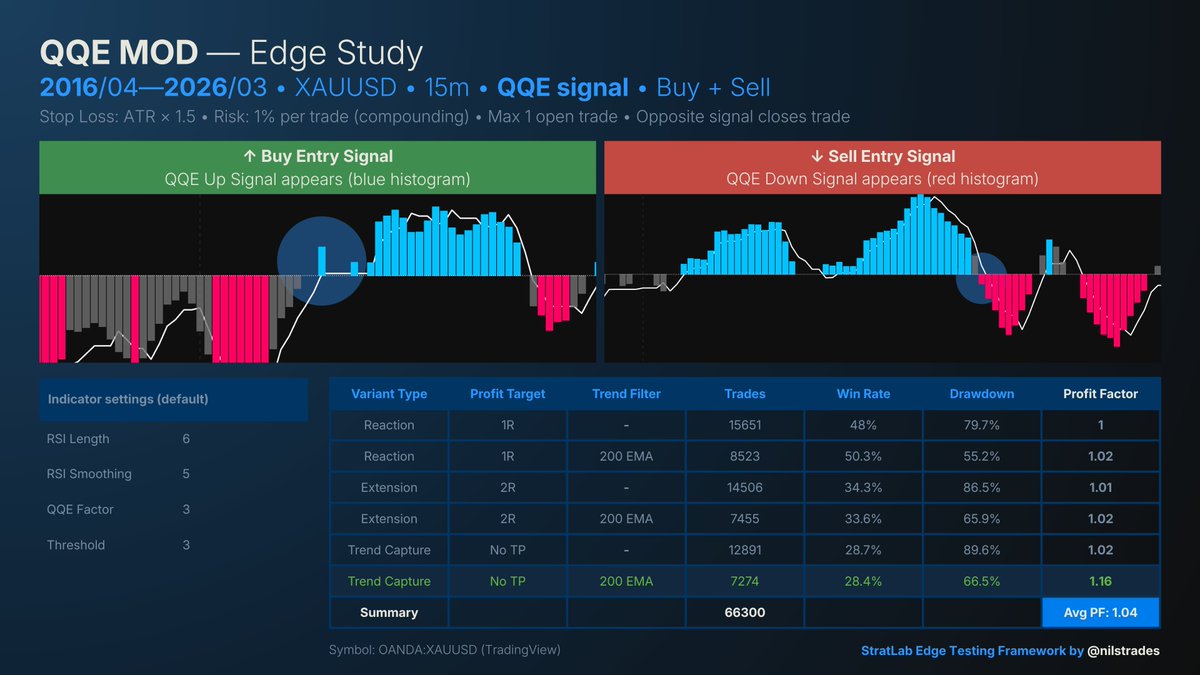
Testing 100 TradingView indicators for statistical edge. Each one converted into a trading signal. No cherry-picking. No tweaking results. Identical conditions — same market, same timeframe, same rules. XAUUSD 15m • Last 10 years Posting 1 result every day for 100 days. 100 indicators. One leaderboard. The rankings start now. Spoiler: Some of the most popular indicators won't hold up.
English
2
0
3
280
NilsTrades
NilsTrades@nilstrades·
@DenizTheTrader The part most traders skip: Test the entry signal alone before adding trade management. When you backtest the full strategy together, you can't tell if results come from the signal or the exits. Separate the two and you know exactly where the edge is — and where it isn't.
English
0
0
0
3
Deniz The Trader
Deniz The Trader@DenizTheTrader·
3️⃣ Backtest your STRATEGY ➤ Do not risk real money on a strategy you have never tested. ➤ Backtesting shows how your setup performed in past market conditions. ➤ It helps you understand win rate, drawdown, and risk/reward. ➤ It also exposes weak rules and fake confidence. If the strategy has never been tested, it is just an idea.
English
2
3
13
1.5K
Deniz The Trader
Deniz The Trader@DenizTheTrader·
If you’re new to trading, Read this before you lose time, money, and confidence: 10 steps every beginner trader should follow: 👇
English
3
22
156
14.8K
NilsTrades
NilsTrades@nilstrades·
@Mindsetfx Win rate doesn't determine profitability on its own — R:R does too. A 30% win rate with 1:3 R:R outperforms a 60% win rate with 1:0.5. What matters is expectancy: (win rate × avg win) − (loss rate × avg loss). That's the number worth tracking, not win rate alone.
English
1
0
1
13
Mindset 🧠
Mindset 🧠@Mindsetfx·
Dear TRADERS If your win rate is : 80% - you are profitable trader 70% - profitable trader 60% - profitable trader 50-40%- profitable trader 30-20% - profitable trader but u need to work on ur risk management.. 10-0% - Work on your psychology or ur edge..
English
12
10
107
3K
NilsTrades
NilsTrades@nilstrades·
@Soft_pips Neither is really a choice you make upfront. Win rate and R:R are outputs of the entry signal you're trading — not inputs you select. The question worth asking is: what does your signal actually produce across a large sample? That's where the answer comes from.
English
0
0
0
9
SOFT PIPS
SOFT PIPS@Soft_pips·
A risk to reward of 1:1 with a 70% win rate or a risk to reward of 1:5 with a win rate of 30%. Which are you going for? 🤔
English
27
3
41
1.7K
NilsTrades
NilsTrades@nilstrades·
SuperTrend's big brother? SuperTrend is currently leading my ranking of public TradingView indicators after 9/100 tests — standardized conditions, several thousand trades per entry signal, same market and rules across all of them. If you want SuperTrendy in the ranking, say the word, and I'll run it through the same framework. 💪
English
0
0
1
42
Drip2Rip 🫵
Drip2Rip 🫵@TheRealDrip2Rip·
Introducing SuperTrendy Indicator! ✅ Confirms flips before firing - no more whipsaws ✅ Adapts to volatility automatically ✅ Grades every signal A, B, or C ✅ Tells you when a trend is overextended ✅ Fully open source Drop it on any chart, any timeframe. tradingview.com/script/jsZD85P…
English
7
12
212
12.5K
NilsTrades
NilsTrades@nilstrades·
The 2nd most used indicator on TradingView. Raw Entry Signal Test #8 Indicator: Squeeze Momentum Entry Signal: Squeeze release 10-year backtest — XAUUSD 15m 36088 trades Best Profit Factor: 1.06 (No TP | 200 EMA) Current rank: #6 (8 of 100 tested) This is the originally intended entry method. Testing a different approach tomorrow. Takeaway: Built-in direction. Built-in momentum. Still breakeven without the 200 EMA. Popularity ≠ edge.
NilsTrades tweet media
English
0
0
2
64
NilsTrades
NilsTrades@nilstrades·
60 trades doesn't really create an overfitting problem — it creates a sample size problem. At that count, the margin of error on your win rate alone is around ±13%. You can't tell if results are from the signal or randomness, let alone optimize anything. Getting to ~400+ trades first is more useful than any overfitting fix.
English
0
0
0
9
やんばるくいな
やんばるくいな@Yanbaruuunn·
@MatiasScalbi What's the best way to prevent overfitting when optimizing a trading strategy? I'm using TradingView Pine Script with a 15-minute GOLD chart and only have 60 trades in my backtest.
English
2
0
0
593
Matias Scalbi
Matias Scalbi@MatiasScalbi·
GUARDEN ESTO Ahora con Claude Code se pueden crear estrategias de inversión en TradingView 🔥 Vas a poder crear lo que quieras con 0 conocimiento en programación Se conecta y hace toda la edición en PineScript solo Aca lo tienen directo para implementar github.com/tradesdontlie/…
Matias Scalbi tweet media
Español
21
67
769
42.4K
NilsTrades
NilsTrades@nilstrades·
@Fairy_Trades Agreed — and the hard part is most traders can't tell what edge they have until they've tested it properly. Most never do — so they're trading an assumed edge thinking it's a real one.
English
0
0
1
15
K_Omotayo
K_Omotayo@Fairy_Trades·
A lot your trading problems will disappear when you have an edge that you consistently see play out. Not an edge you assume you have Not an edge you’re assuming it works Not an edge that you rarely see Not an edge that is popularly said to work An edge you consistently find, and see it play out.
English
25
11
105
1.8K
NilsTrades
NilsTrades@nilstrades·
@Team2Trading Fair — but most traders haven't tracked enough trades to know what their A setup actually looks like in data. The classification exists in their head, not in their results.
English
0
0
1
37
Casey
Casey@Team2Trading·
@nilstrades Everyone knows when they are taking a B or C grade setup.
English
1
0
1
96
Casey
Casey@Team2Trading·
Your A+ setups make you profitable. Your B setups bring you back even. Your C setups turn you red. So technically you are already a profitable trader but you are just doing too much. Cut out all those shitty little B & C setups this month!
English
17
16
369
9.4K
NilsTrades
NilsTrades@nilstrades·
@SJosephBurns Discipline is only as good as what you're following. Most traders call it a system. Few have the data to prove it has edge.
English
0
0
0
28
Steve Burns
Steve Burns@SJosephBurns·
A trader without the discipline to follow a system with an edge is just a gambler.
English
38
36
325
11.3K
NilsTrades
NilsTrades@nilstrades·
@jtrader Most traders who say they don't backtest are already doing it — just badly.
English
1
0
1
92
J trader
J trader@jtrader·
Do you backtest?
English
31
2
34
3.8K
NilsTrades
NilsTrades@nilstrades·
@zaruww "Study losses, copy wins" only works if you've defined what a win actually looks like before the trade. Without that, you're not copying a pattern — you're copying what felt right in hindsight.
English
0
0
1
156
𝐙𝐀𝐑𝐔
𝐙𝐀𝐑𝐔@zaruww·
1 system. 100 trades. Study losses. Copy wins. Repeat. You will Thank yourself in 5 years.
𝐙𝐀𝐑𝐔 tweet media
English
25
63
861
18.5K
NilsTrades
NilsTrades@nilstrades·
Leaderboard update — 7 of 100 tested. XAUUSD 15m — 10-year backtest — identical conditions. Raw indicator signal. No trade management. 1. SuperTrend — 1.22 (No TP | 200 EMA) — avg 1.05 2. EMA 20/50 — 1.19 (No TP | 200 EMA) — avg 1.03 3. QQE MOD — 1.16 (No TP | 200 EMA) — avg 1.04 4. SSL Hybrid — 1.12 (No TP | 200 EMA) — avg 1.05 5. MACD — 1.07 (No TP | 200 EMA) — avg 1.02 6. RSI Divergence (Regular) — 1.04 (No TP | 200 EMA) — avg 1.00 7. RSI Divergence (Hidden) — 1.03 (No TP | 200 EMA) — avg 0.99 Ranked by Profit Factor of strongest variant. Drop your indicator below. Public TradingView indicators only.
NilsTrades tweet media
English
0
0
3
80
NilsTrades
NilsTrades@nilstrades·
Raw Indicator Signal Test #7 Indicator: RSI Divergence Indicator Entry Signal: Hidden Divergence XAUUSD 15m Test period: Last 10 years (ending previous month) 16919 trades tested Best Profit Factor: 1.03 Takeaway: After the surprisingly bad result of Regular Divergence, I wanted to test Hidden Divergence. Only to find that it performs even worse. This might be due to the indicator identifying divergence 5(!) bars later than where it gets drawn. Current rank: #7 (7 of 100 tested)
NilsTrades tweet media
English
0
0
2
38
NilsTrades
NilsTrades@nilstrades·
@dangadofx Partial profits are a solid way to manage downside — especially in volatile markets. The break-even move is where it gets nuanced though. Whether it helps or hurts expectancy depends on the signal. Some entries need room to breathe past 1R.
English
0
0
0
10
Dangado
Dangado@dangadofx·
My model is simple. I’ve used it consistently for years, targeting 3-4RR. No greed. I always secure partial profits because the market can reverse at any time. Once price hits 1R, I move to break-even to protect my capital. You don’t need a Lambo before December. That mindset will only make you watch profits turn red. Discipline over hype. Fix that💪
English
24
5
88
3.9K
NilsTrades
NilsTrades@nilstrades·
@tradertheory The stop loss moved because the exit rule wasn't defined before the trade. When exits are pre-defined and backtested, "tactical" stops being an option.
English
0
0
0
19
Trader Theory
Trader Theory@tradertheory·
You moved the stop loss. You told yourself it was a tactical decision. You used the word *tactical* out loud, to no one. The trade is still open. The stop loss is still moving. Where did it all go wrong?
English
26
3
70
4.4K
NilsTrades
NilsTrades@nilstrades·
@bl_qee Nice. If the approach is working consistently, worth running it through a longer backtest to make sure it holds across different market conditions — not just the current phase. Short timeframes can look very consistent until they don't.
English
0
0
0
13
ZeroX
ZeroX@bl_qee·
I did this TradingView premium not for backtest but so I could see charts in 30s, I’ve been so consistent with 1m and 3m decided to try the 30s.😂
ZeroX tweet media
English
1
0
0
59
NilsTrades
NilsTrades@nilstrades·
@PatternProfits Win rate matters, but only relative to RR. A 70% win rate with a 0.3R average winner and 1R average loser still loses money. Profit Factor captures both in one number — cleaner primary metric for this reason.
English
0
0
1
27
Ben
Ben@PatternProfits·
With all due respect... if there's an inability to turn a 70% or better probability in the markets into a profitable trading strategy, one doesn't need to look deeper into the data; one needs to look deeper into the mirror. In the markets, it doesn't get much better. ✌️
English
5
1
82
5.5K
NilsTrades
NilsTrades@nilstrades·
Solid principle. The only thing I'd add: 50 trades is usually too small to draw conclusions. At that sample size you can't separate real edge from a lucky streak. I run 10-year backtests on XAUUSD 15m — that's typically 1000+ trades per signal. Results look very different if you compare chart history (a few hundred trades) with deep backtest (~10x more data and multiple market regimes).
English
0
0
0
13
Wesley | The Forex Complex
Wesley | The Forex Complex@wesleyfxc·
Backtest any strategy 50 times on TradingView before you risk real money. If it doesn't work on historical charts it won't work live.
English
1
0
0
120
NilsTrades
NilsTrades@nilstrades·
Raw Indicator Signal Test #6 Indicator: QQE MOD Entry Signal: Histogram turns blue/red XAUUSD 15m Test period: Last 10 years (ending previous month) 66300 trades tested. Best Profit Factor: 1.16 (No TP | 200 EMA) Takeaway: Decent performance with tons of entry signals. That means -> a lot of room for adding filters to improve the entry signal, and reduce drawdown. Current rank: #3 (6 of 100 tested)
NilsTrades tweet media
English
0
0
4
86