Almost nobody looks at this chart… but it’s one of my favorite ways to spot when a move may be running on fumes.
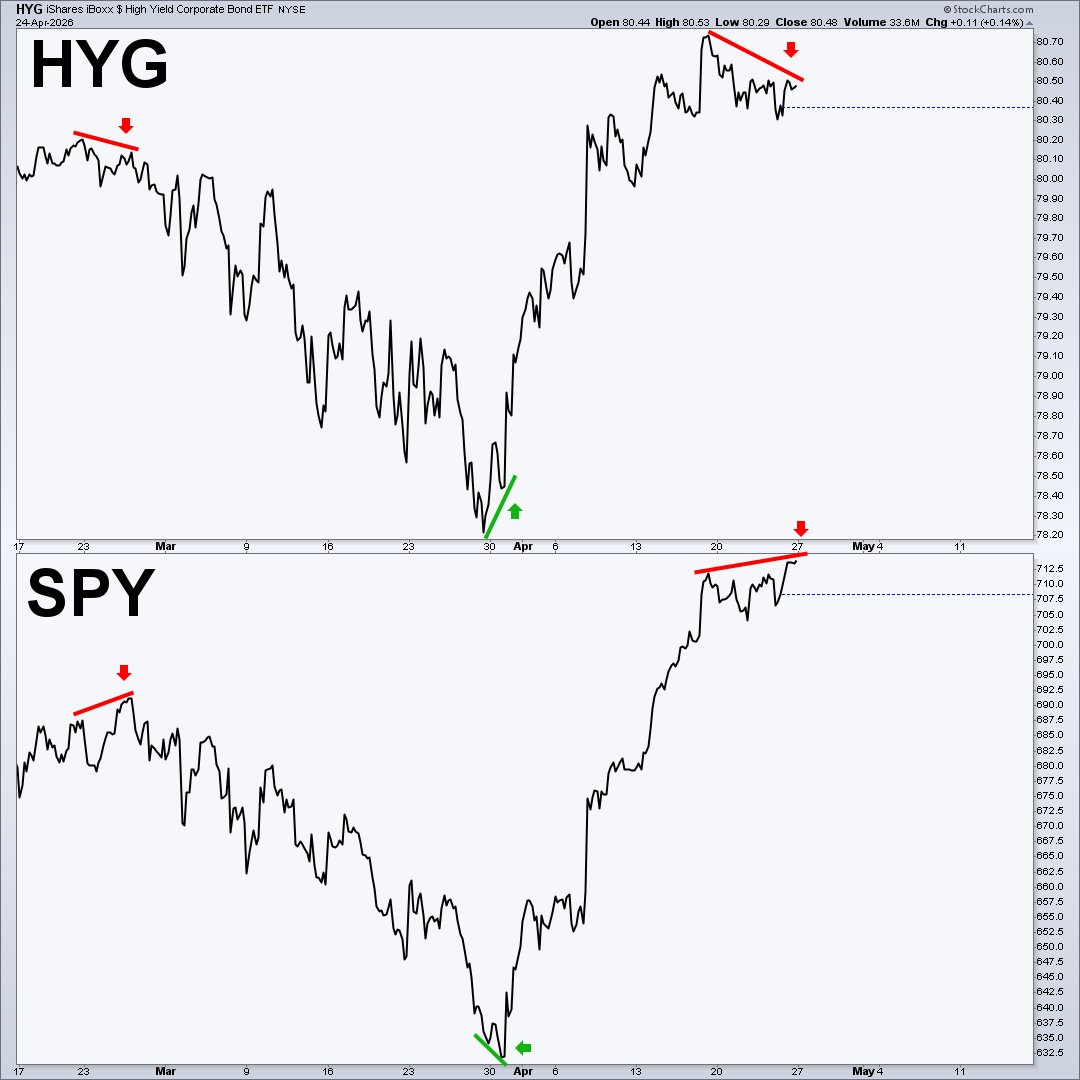
This is a simple 60‑minute line chart of high yield vs SPY. I use it to track divergences between “smart money” (bonds) and “dumb money” (equities).
The last major signal was at the bottom, high yield quietly started putting in a higher low while stocks were still puking. That helped flag the turn.
Fast‑forward to now: $JNK and $HYG are not confirming this latest push in SPY. Stocks are pressing higher, high yield is stalling out.
That doesn’t guarantee a top, but when "Smart Money" refuses to play along, I take note.
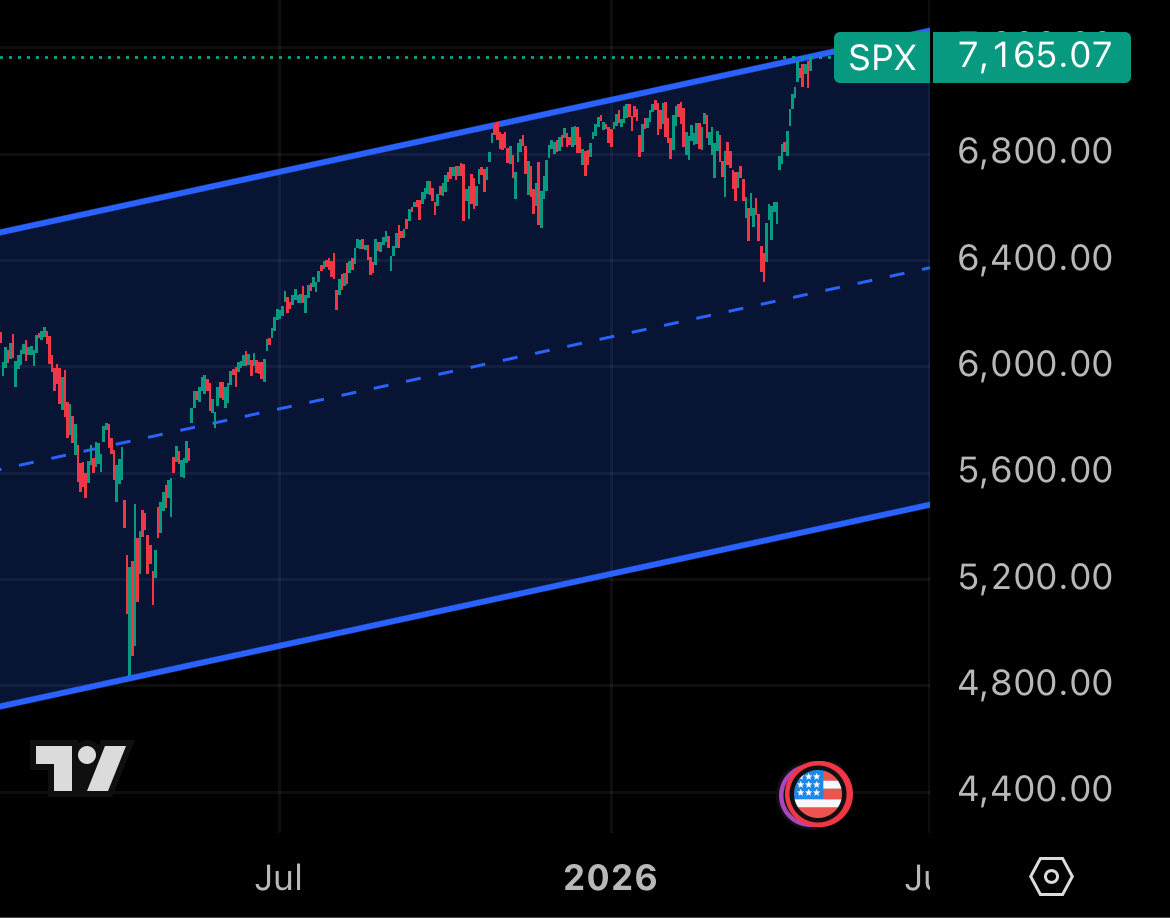
The market is absolutely brutal. Most people think there is only one way to get screwed i.e. stocks in your portfolio tank.
But imagine not buying a single stock when they were down and witnessing this historic rally that makes no sense. You buy you're gonna get burned - if you don't buy, you feel left out.
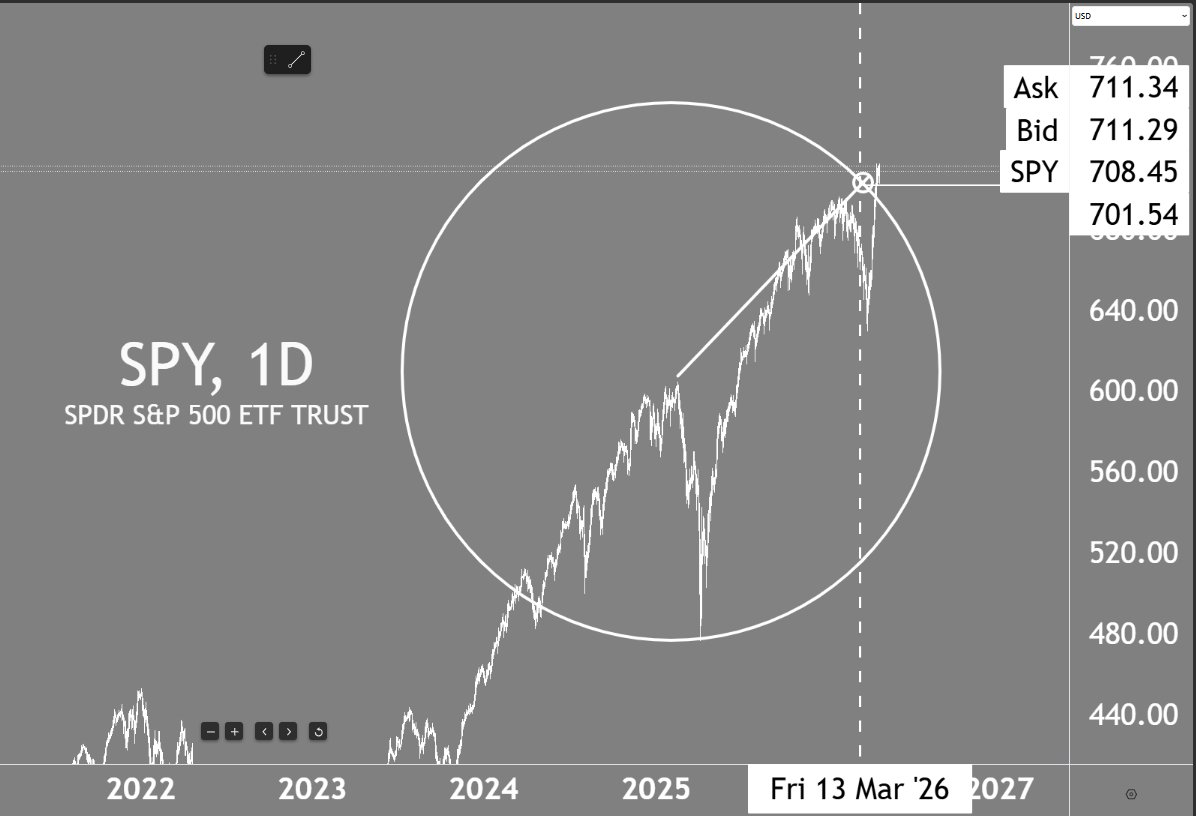
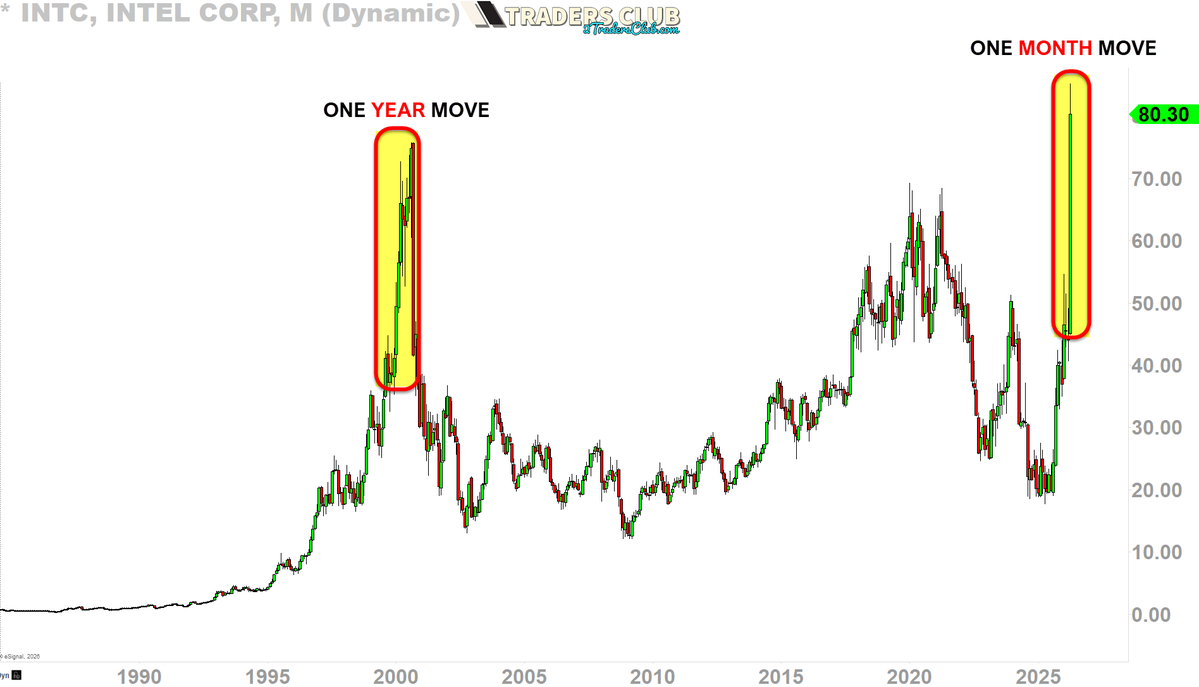
We've seen capitulation rallies like this before. They can last for many months.
- '99 - '00
- '06 - '07
- '20 - '21
Don't get burned trying to participate casually. Everything from here should be absolutely deliberate and tightly risk managed.
Shorting at the wrong time can f*ck you, longing something with leverage that pulls back can f*ck you, buying a stock heavily that you missed the entire way up can f*ck you.
Lost decades (if they happen) are overblown - unless you do the wrong thing at the wrong time with the wrong size.
@MikeBurgersburg@dampedspring Puts went absolutely vertical today
Would’ve been an epic trade if I he’s on ten more mins or so
I’m surprised they saved it for mid day instead of rinsing out the gate