Bitcoin Vector

338 posts

Bitcoin Vector banner
Bitcoin Vector

Bitcoin Vector

@bitcoinvector

Institutional grade reports and real time signals for funds, family offices and market professionals by @swissblock__ and @woonomic.

Zug, Switzerland 参加日 Mayıs 2025
10 フォロー中14.4K フォロワー
Bitcoin Vector
Bitcoin Vector@bitcoinvector·
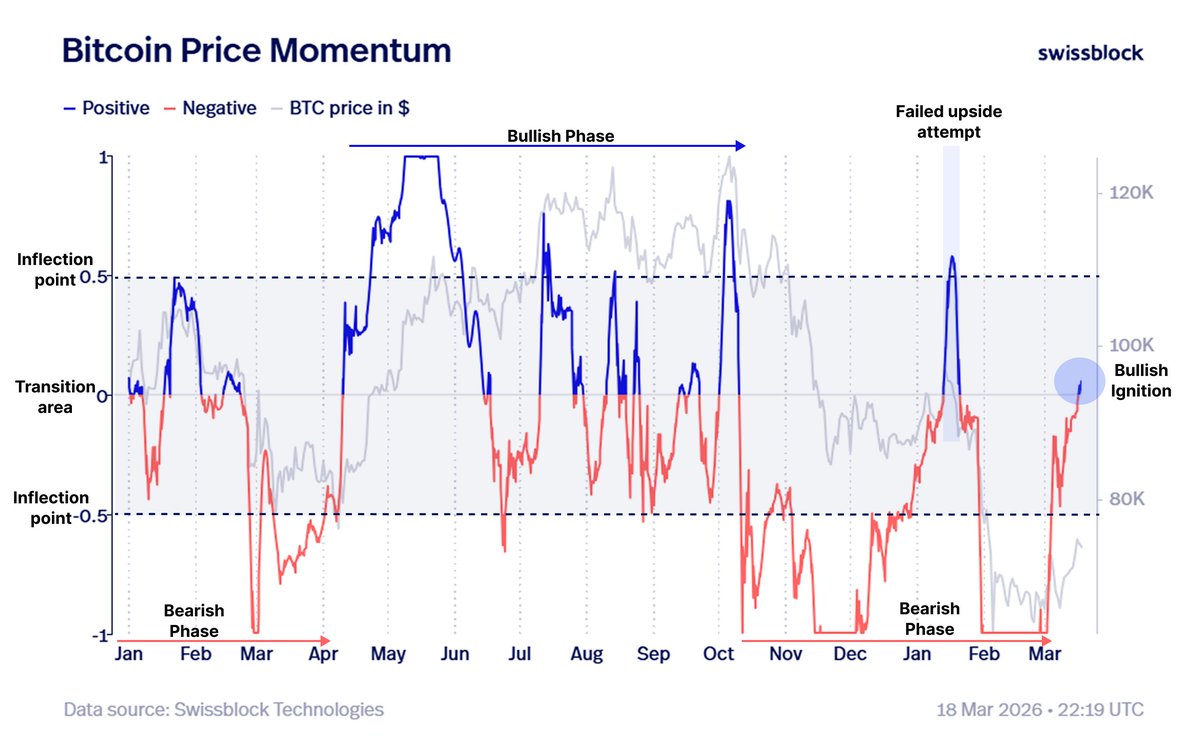
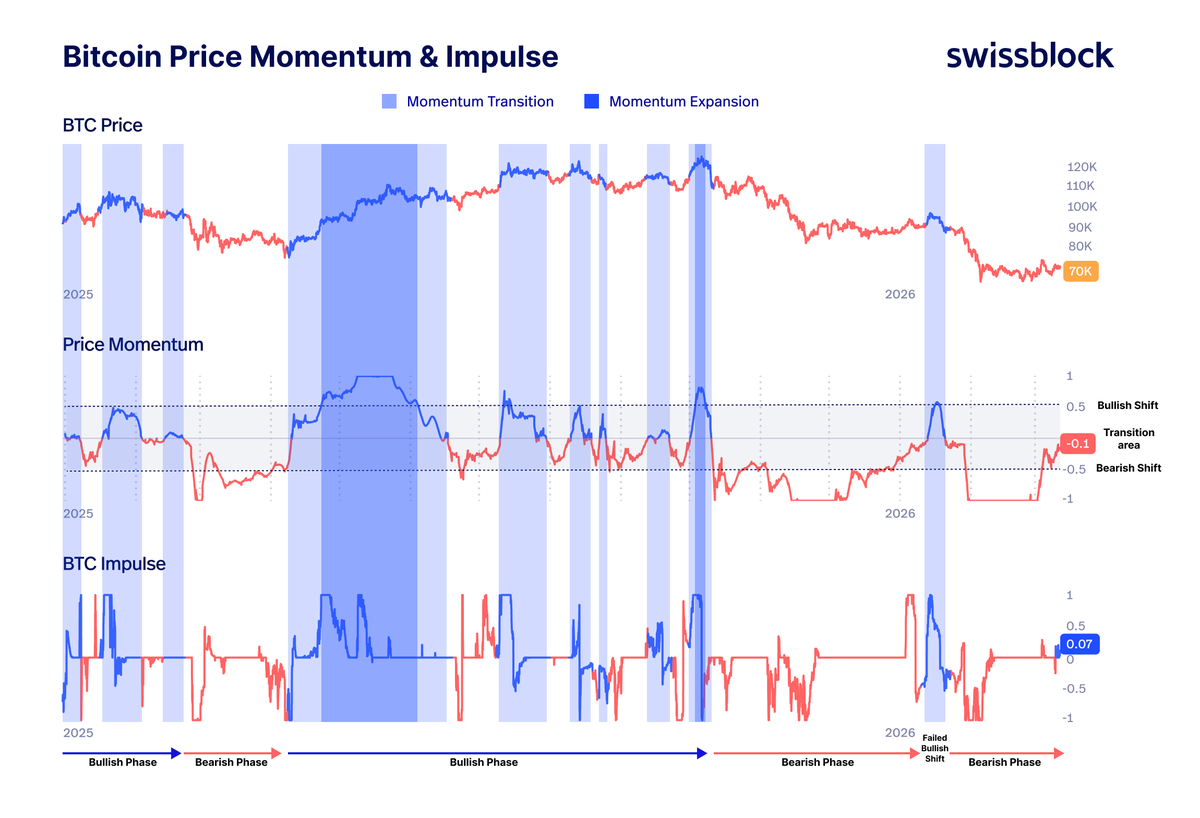
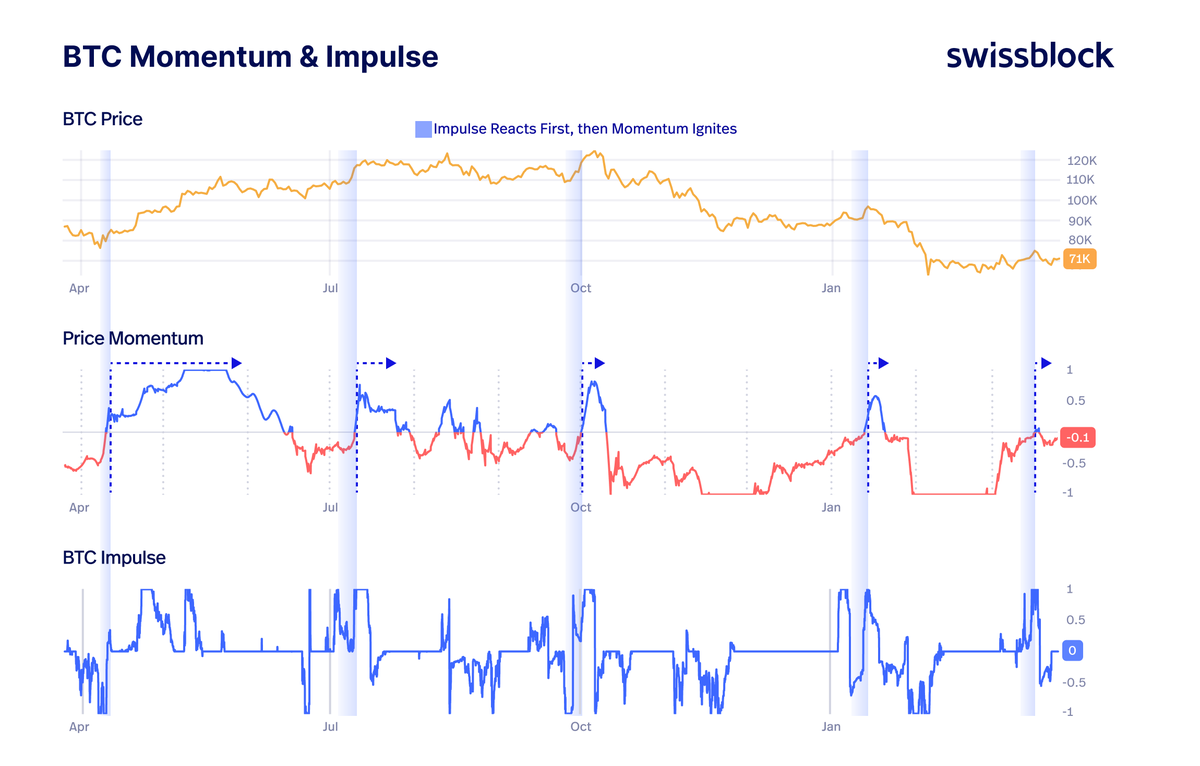
$BTC impulse reacts first, then Momentum ignites. Impulse is the trigger. Momentum is the confirmation. Expansion comes after. 
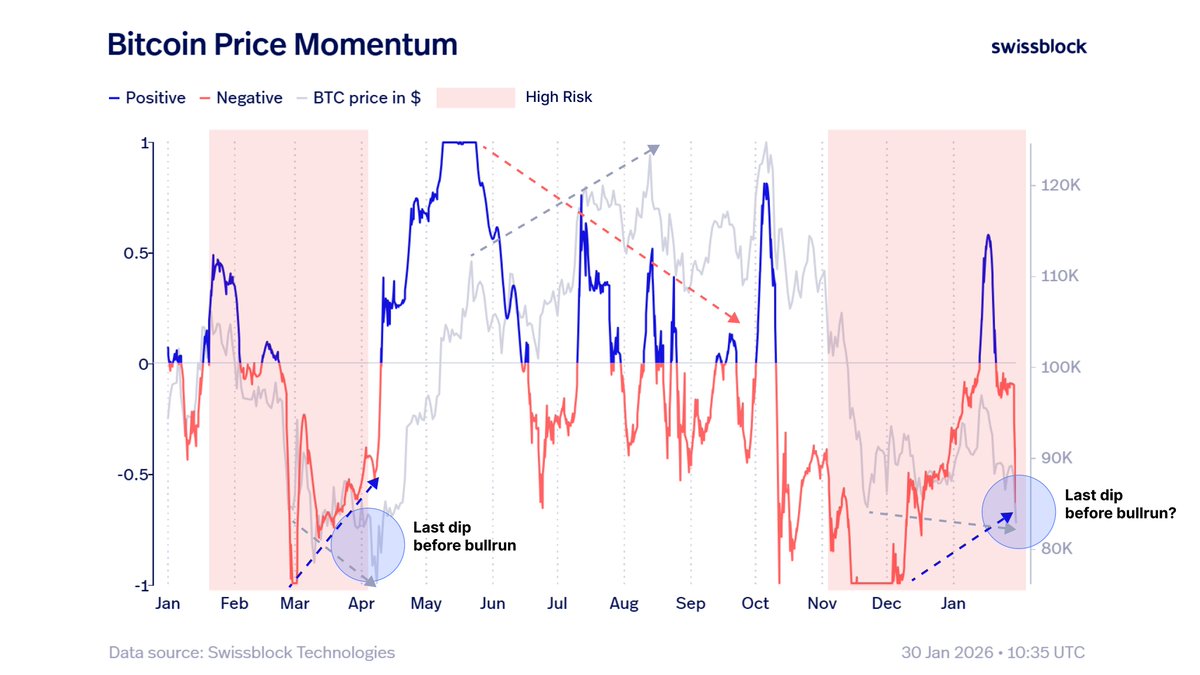
Right now, what we are watching for is BTC impulse to give the signal, with Momentum close to turning positive. That would be the clue that Bitcoin is starting to regain enough traction to attack the mid $70Ks again.
Bitcoin Vector tweet media
Altcoin Vector@altcoinvector

Bitcoin leads, altcoins follow, but only when conditions align. A sustained Altcoin Impulse phase needs 3 things: Low Risk, rising BTC momentum, and Alts impulse breaking above 25%. That is when the strongest Altcoin phases emerge. Without BTC rising momentum, Alts Impulse tends to be just a brief flare-up, reversed fast and hard. Bitcoin opens the door, but without momentum, Altcoins impulse fades.

English
0
4
42
11.9K
Bitcoin Vector
Bitcoin Vector@bitcoinvector·
Bitcoin is trapped in a range, but the real story is underneath the surface. Price has held trying to breakout, yet the Fundamental Index keeps trending lower and remains well below the strengthening zone. That means this is not healthy consolidation, it’s stability without support. As long as onchain conditions stay weak, upside looks increasingly dependent on flow, short covering, or external catalysts, not organic strength. If fundamentals don’t recover, this kind of divergence usually don’t support a sustained mid-term recovery.
Bitcoin Vector tweet media
Bitcoin Vector@bitcoinvector

Liquidity is the speed of money, how fast capital moves on-chain. When Bitcoin broke support, activity surged, coins moved faster, and participation spiked, a stress response driven by repositioning, and active demand. Since then, Liquidity has been eroding while price recovers. That is the key divergence. This move is being carried more by seller exhaustion than by strong and consistent demand. Without a reacceleration in activity, this remains a recovery attempt, not a confirmed expansion.

English
1
3
26
3.8K
Bitcoin Vector がリツイート
glassnode
glassnode@glassnode·
Demand Exhaustion Update The 24HR-SMA of Net Realized P&L peaked at $17M/hr before price lost momentum and contracted back below $70k. Profit-taking at this threshold continues to absorb upside momentum, a pattern now observed across multiple rally attempts. Broader geopolitical uncertainty appears to be compressing demand depth, limiting the market's capacity to absorb even moderate realization events. 📉 glassno.de/4bppmCo
glassnode tweet media
Bitcoin Vector@bitcoinvector

Liquidity is the speed of money, how fast capital moves on-chain. When Bitcoin broke support, activity surged, coins moved faster, and participation spiked, a stress response driven by repositioning, and active demand. Since then, Liquidity has been eroding while price recovers. That is the key divergence. This move is being carried more by seller exhaustion than by strong and consistent demand. Without a reacceleration in activity, this remains a recovery attempt, not a confirmed expansion.

English
9
17
103
25.9K
Bitcoin Vector
Bitcoin Vector@bitcoinvector·
Liquidity is the speed of money, how fast capital moves on-chain. When Bitcoin broke support, activity surged, coins moved faster, and participation spiked, a stress response driven by repositioning, and active demand. Since then, Liquidity has been eroding while price recovers. That is the key divergence. This move is being carried more by seller exhaustion than by strong and consistent demand. Without a reacceleration in activity, this remains a recovery attempt, not a confirmed expansion.
Bitcoin Vector tweet media
Bitcoin Vector@bitcoinvector

When Bitcoin broke support at $85K and collapsed toward $60K, Network Growth surged during the selloff. The breakdown pulled in new market participants, a sign of absorption and of investors eager to step in around key zones. Since then, participation has cooled, which tells us the first stress response has already passed. A renewed rise in Network Growth would signal that participants are entering the market again. Otherwise, Bitcoin remains in a recovery attempt, not a confirmed expansion phase.

English
2
3
39
37.4K
Bitcoin Vector
Bitcoin Vector@bitcoinvector·
Momentum turning positive is a key shift, but there is a catch. This is not the first attempt. January already showed a failed ignition, where momentum turned positive but lacked follow-through and quickly reverted. The difference now is that momentum is recovering from deeper exhaustion. Even so, we still need to see it sustain above the transition zone and build toward the 0.5 inflection level. Without that, this risks becoming another short-lived spike rather than an expansion. Early signal, not confirmation.
Bitcoin Vector tweet media
Bitcoin Vector@bitcoinvector

Momentum exits extreme negative territory (-1) today. While the overall trend remains defensive, the pivot suggests a new bullish attempt. Will it gain the traction that January’s failed move lacked?

English
1
4
49
8.2K
Bitcoin Vector
Bitcoin Vector@bitcoinvector·
When Bitcoin broke support at $85K and collapsed toward $60K, Network Growth surged during the selloff. The breakdown pulled in new market participants, a sign of absorption and of investors eager to step in around key zones. Since then, participation has cooled, which tells us the first stress response has already passed. A renewed rise in Network Growth would signal that participants are entering the market again. Otherwise, Bitcoin remains in a recovery attempt, not a confirmed expansion phase.
Bitcoin Vector tweet media
Bitcoin Vector@bitcoinvector

As discussed yesterday, Bitcoin’s Network Growth is currently carving out lows not seen since the 2022 capitulation, while Liquidity continues to decline sharply. In 2022, this exact setup preceded a long consolidation phase that only resolved after a major liquidity bottom, which eventually paved the way for a powerful bull run. However, the current context demands caution. We have yet to exit this consolidation phase; both Network Growth and Liquidity remain in a state of "destruction." The price action we have witnessed since early January 2026 has been characterized by Small-Cap predominance rather than Bitcoin leadership. This suggests that the recent upside is primarily driven by speculation rather than solid, organic adoption. Historically, Bitcoin has anticipated sustainable macro moves through sustained predominance. In a healthy market environment, high BTC dominance concentrates value into the "engine" of the market. Once BTC consolidates after such a move, that accumulated value overflows into the rest of the ecosystem. This sequence is what validates a move as structural rather than purely speculative. For us to transition into a healthy, non-speculative market environment, we need to see Bitcoin Dominance reclaim its trend while Network Growth and Liquidity begin their recovery. Until the "engine" starts running, the foundation remains fragile.

English
0
3
26
12.8K
Bitcoin Vector がリツイート
Bitcoin Vector
Bitcoin Vector@bitcoinvector·
Bitcoin Price Momentum + Impulse define market phases. When both align, BTC moves from transition into expansion. When they fail, rallies fade and bearish phases extend. Momentum Transition (Light blue) is the early ignition window. Momentum Expansion (Dark blue) marks when impulse and momentum align for cleaner rallies. In January, BTC attempted a bullish shift but failed. Now it is back in transition, with slight positive impulse. Ignition is emerging, but sustained positive momentum is what confirms the shift.
Bitcoin Vector tweet media
Swissblock@swissblock__

Momentum is flashing a critical shift. We’re exiting peak negative momentum, the kind of transition that often precedes a regime change. The key test now is simple: can momentum consolidate above +0.5 and hold. That +0.5 zone is the point of no return, where caution starts giving way to expansion. Past cycles show regimes can persist for months once they flip. If it sticks, this may be more than a relief rally.

English
1
7
65
48K
Bitcoin Vector
Bitcoin Vector@bitcoinvector·
Since last November, BTC’s Risk Index and BTC Spot ETF flows have moved almost in lockstep. When ETFs distribute, risk destabilizes and selling pressure dominates. When ETFs accumulate, risk decreases and drifts toward a low risk regime. Last week was the key: outflows stopped and ETF accumulation began, a signal the Risk Index was close to exiting capitulation. And so it did. If that accumulation persists, the base case is Risk Index cooling toward, and potentially below 25, where buyers regain control. @glassnode @swissblock__
Bitcoin Vector tweet media
glassnode@glassnode

$BTC Spot ETF flows are stabilising after sustained outflows. The 14-day netflow trend has turned higher, signalling easing distribution pressure as BTC breaks above 70k. Institutional demand remains tentative, but early re-accumulation signs are emerging. glassno.de/4sLx5Rh

English
4
6
49
9.3K
Bitcoin Vector
Bitcoin Vector@bitcoinvector·
Momentum exits extreme negative territory (-1) today. While the overall trend remains defensive, the pivot suggests a new bullish attempt. Will it gain the traction that January’s failed move lacked?
Bitcoin Vector tweet media
Swissblock@swissblock__

We’ve officially hit the longest $BTC Extreme High Risk period on record: 25 consecutive days, surpassing the 2023 peak of 23 days. As @CryptoMichNL points out regarding the BTCUSD vs. Supply in Profit/Loss chart from @glassnode , we might be carving out a bottom—perfectly consistent with current Risk Index readings. In 2023, the pivot from Extreme Risk toward Minimum Risk was the catalyst for a massive bullish rally. Are we about to see a repeat performance?

English
1
4
45
17.1K
Bitcoin Vector
Bitcoin Vector@bitcoinvector·
What’s next—a Bull Trap or a Crypto Winter? If we’re facing a Bull Trap, expect a sharp rally in BTC price mirrored by a strong surge in Network Growth. However, if a Crypto Winter is beginning, we’ll see erratic Network Growth and BTC price entering a sideways grind. This phase is, by far, the best window for multi-year positioning. If @AshCrypto is right and we are bottoming out at the 2021 ATHs, a Crypto Winter is on the table. We could be looking at months of low volatility—perfect for "silent" long-term accumulation. Historically, the first major crash after a cycle rally triggers a Bull Trap. Is this time different?
Bitcoin Vector tweet media
Ash Crypto@AshCrypto

HOPIUM for Bitcoin The bottom is in for now, and we are due for a relief rally soon unless stocks crash hard. Bitcoin is now retesting the previous all-time high from 2021, which last time marked the bottom for BTC. In 2022, BTC tested the 2017 ATH of $19,800, dipped below to $15,400, and then formed the bottom. We are seeing the same pattern again: we just went below the 2021 high of $69,000 and tested the $60,000 level. So the bottom is likely in and we should bounce, but if stocks dump hard, BTC can go lower.

English
4
8
58
12.2K
Bitcoin Vector
Bitcoin Vector@bitcoinvector·
Following the strong bearish momentum since mid-January, we have seen a sustained consolidation over the last two weeks. While the reduction of the Negative Alts Impulse to minimums is a highly positive sign, we remain in a 'wait-and-see' stance. A resurgence of the Positive Alts Impulse above the 25% threshold would act as the trigger for the compelling bullish move @HenrikZeberg is currently forecasting.
Bitcoin Vector tweet media
Henrik Zeberg@HenrikZeberg

#BTC Patience!

English
3
6
49
41.1K
Bitcoin Vector
Bitcoin Vector@bitcoinvector·
Periods of sustained extreme high risk, such as the one we are currently in, typically precede environments of approximately 120 days of bullish movement in $BTC. At this moment, we are chaining two strong and sustained downward moves, just as occurred in mid-2024, which preceded a 133-day massive bullish movement. It is important that we stay alert for Bullish transition zones, characterized by a drastic reduction of the Risk Index to 0, the environment of minimum risk. This could initiate the next sustained bullish move.
Bitcoin Vector tweet media
English
6
17
122
9.6K
EM
EM@Emanuel77604366·
@bitcoinvector What rally? Was there an rally?
English
1
0
1
251
Bitcoin Vector
Bitcoin Vector@bitcoinvector·
As discussed in early January, Alt Seasons act as key inflection points in crypto market cycles. The Altcoin Cycle signal in early Jan perfectly anticipated the rally that followed. Similarly, its reading in mid-January warned us of the sharp reversal from the Jan 14 highs. We are currently in a BTC Cycle, but metrics are starting to edge back toward Altcoin territory.
Bitcoin Vector tweet media
Bitcoin Vector@bitcoinvector

Every Alt Season acts as a definitive pivot for $BTC and the digital asset environment. Understanding these inflection points is key to navigating the macro trend. Is $BTC gearing up for its next major breakout?

English
3
9
84
14.6K
Bitcoin Vector
Bitcoin Vector@bitcoinvector·
Our Regime Shift indicator has just flipped bullish in $BTC, signaling a potential structural trend change. This metric allows us to anticipate mid-to-long-term shifts while we fine-tune positioning using our short-term framework. Learn more about us here: swissblock.net
Bitcoin Vector tweet media
English
21
24
176
15.3K
Bitcoin Vector
Bitcoin Vector@bitcoinvector·
@webbah High risk environments identify market bottoming processes rather than market tops; other indicators are used to identify topping processes.
English
0
0
3
652
webbah
webbah@webbah·
@bitcoinvector Just so I understand this, October 10ths liquidation event was during low risk on your chart?
English
1
0
4
875
Bitcoin Vector
Bitcoin Vector@bitcoinvector·
We are back at capitulation levels on the Risk Index. Are we bottoming out as seen in previous extreme readings, or is a deeper capitulation still ahead?
Bitcoin Vector tweet media
English
4
11
110
38.2K
Bitcoin Vector
Bitcoin Vector@bitcoinvector·
As noted in our previous momentum update, we were looking for one final leg down to complete the bullish divergence. Once we get bullish confirmation, this setup suggests a powerful move to the upside is likely. Key Level: 84.5k If buyers can reclaim and hold this level, we could see the start of a significant bullish reversal. However, should sellers consolidate price action below this mark, the case for a deeper correction toward the 74k zone gains significant weight.
Bitcoin Vector tweet media
Bitcoin Vector@bitcoinvector

Momentum is strengthening as we exit a massive high-risk environment, a shift similar to what we saw in April before the bull run. However, as we highlighted back in late December, the missing key was positive price-momentum divergence. Are we currently in the final dip to lock in that divergence and anticipate the next major leg up?

English
7
11
91
9.8K
Bitcoin Vector
Bitcoin Vector@bitcoinvector·
Historically, the combination of Risk Index and Network Growth has been a powerful leading indicator for $BTC. We’ve seen that a massive drop in Network Growth (1) paired with a High-Risk Environment (2) often precedes sustained bullish trends. With $BTC traditionally being "late to the party," we might be looking at one of the most significant rallies in years.
Bitcoin Vector tweet media
Henrik Zeberg@HenrikZeberg

#SP500 and #Russell2000 have put in strong rallies - and new ATHs #BTC is always "late to the party" - and then it catches up with vengeance. Nasdaq, SP500, Russell2000 and BTC always top together. Why would BTC all of the sudden have topped out months before the other Risk Assets? 😉 Does. Not. Make. Sense! BTC will SOAR - and Catch-Up!

English
11
19
198
84.6K