Bitcoin Vector

360 posts

Bitcoin Vector banner
Bitcoin Vector

Bitcoin Vector

@bitcoinvector

Institutional grade insights and real time signals for funds, family offices and market professionals by @glassnode and @woonomic.

Zug, Switzerland Katılım Mayıs 2025
11 Takip Edilen14.4K Takipçiler
Bitcoin Vector
Bitcoin Vector@bitcoinvector·
Bitcoin is not under selling-pressure stress. So far, selling pressure has been absorbed. But history gives us a warning: When Supply in Profit and Supply in Loss begin to compress together, while the Risk Index moves out of low-risk territory, it precede a distribution phase. 
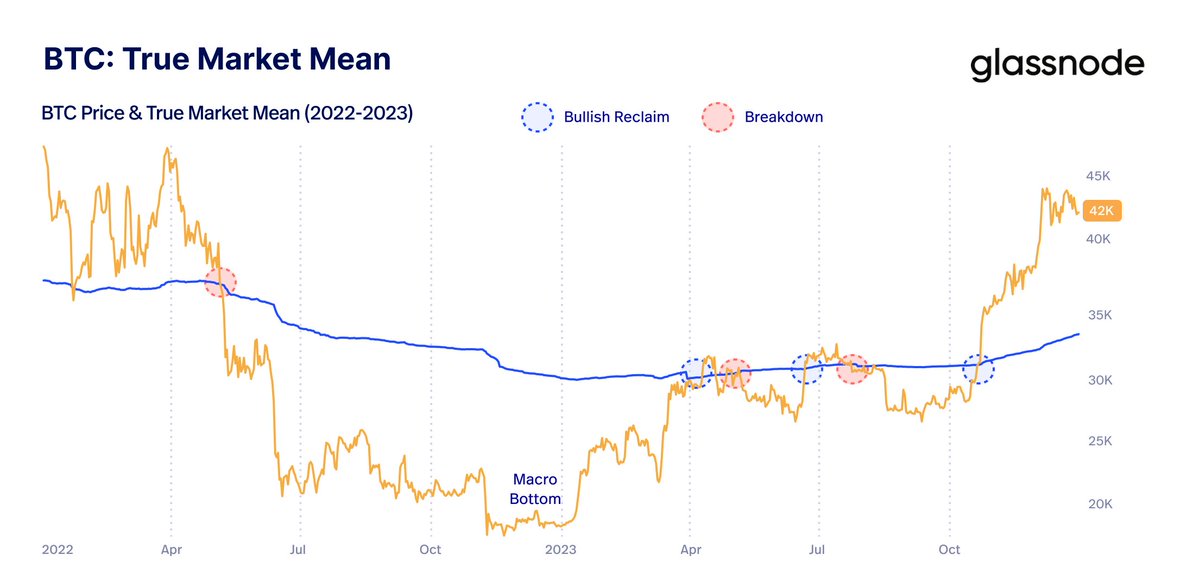
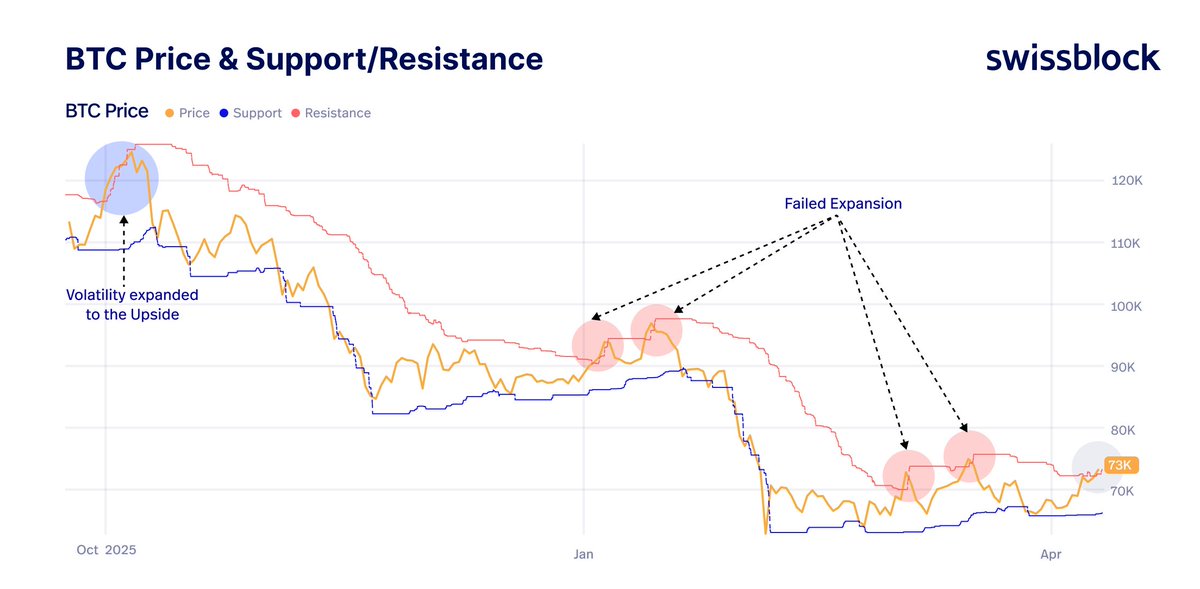
After the Oct 10 crash, that pattern evolved into a sustained selling-pressure wave, culminating in February’s capitulation toward $60K. Will we see another wave of selling pressure overwhelming Bitcoin? The first warning signal would be clear: 
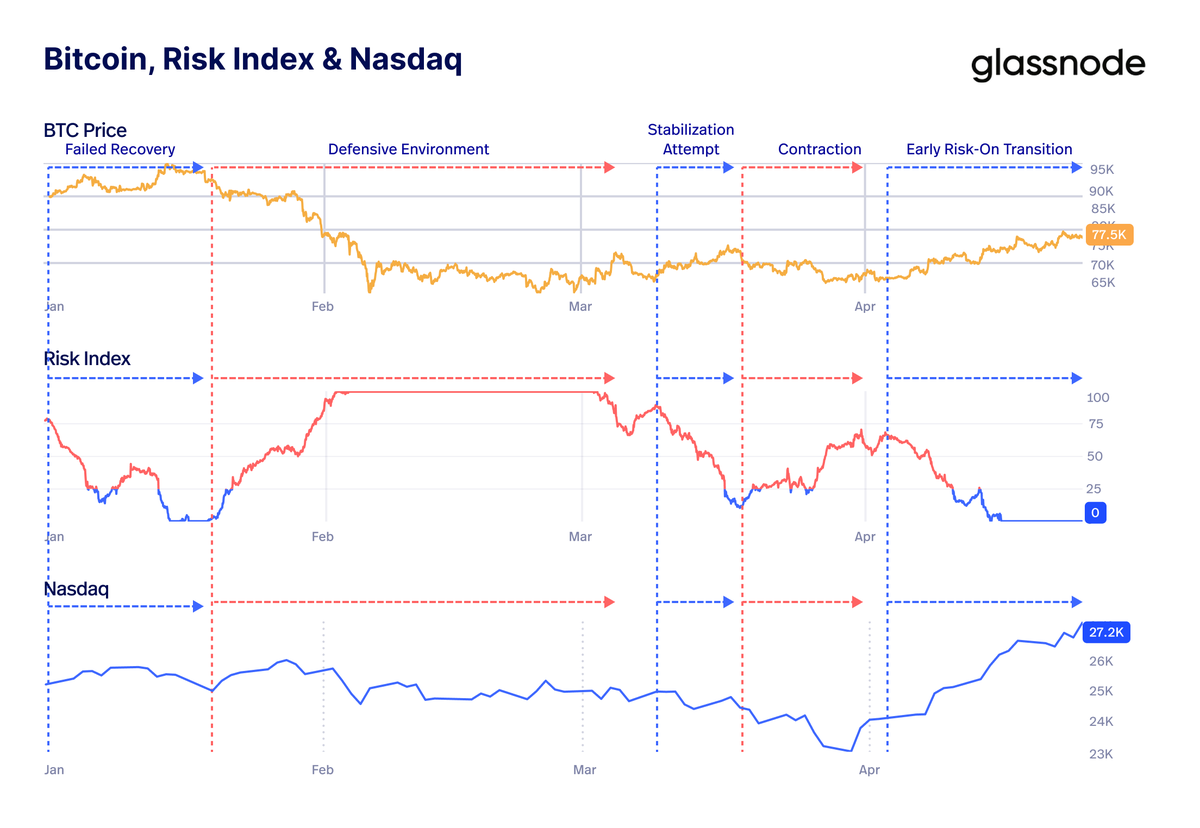
Risk Index back to high risk.
Bitcoin Vector tweet media
English
0
5
39
2.7K
Bitcoin Vector
Bitcoin Vector@bitcoinvector·
Bitcoin continues building a stair-step expansion structure. Since the late-March lows, BTC has followed the same sequence repeatedly: → Resistance gets reclaimed → Price consolidates → Support steps higher → Expansion continues Every breakout has been followed by a higher support formation. As long as BTC does not break $76.2K–$76.8K, the bullish structure remains intact. Hold that zone, and Bitcoin keeps room to expand the structure higher.
Bitcoin Vector tweet media
English
2
6
46
4.7K
Bitcoin Vector
Bitcoin Vector@bitcoinvector·
ETF holder conviction remains intact. Despite the 2026 correction, BTC Spot ETFs have already recovered 76% of the drawdown from the October 2025 ATH balance. • ATH Balance: 1.362M BTC • 2026 Low: 1.258M BTC • Latest: 1.337M BTC Yes, ETF holders distributed from October to February. But since then, they have resumed accumulation through weakness instead of fully distributing. We are now entering the first stress test for ETF holders inside a bear-cycle environment. So far, the response has been constructive: → ETF balances are rebuilding → Risk Index remains suppressed → BTC reclaimed the major cost-basis zones But the key is what happens next. If ETF balances keep rising while Risk stays low, Bitcoin can sustain expansion through $83K, and later toward $84K–$86K. If ETF accumulation stalls while Risk accelerates higher, the structure becomes vulnerable again. Flows remain the backbone of this recovery.
Bitcoin Vector tweet media
Bitcoin Vector@bitcoinvector

Bitcoin has entered the ETF battlefield. Price is trying to consolidate inside the major ETF cost-basis zone: • All ETFs Cost Basis: ~$83K • BlackRock Cost Basis: ~$82.8K • Grayscale Cost Basis: ~$80.1K At the same time, the Risk Index remains anchored in low-risk territory, meaning selling pressure is still largely absorbed. But unlike the Short-Term Holder Cost Basis, where we have clear evidence from past cycles, this is the first bear-cycle test for ETF holders. This is where institutional conviction gets tested. As price ranges below or inside the ETF cost-basis zone, we will see how ETF holders react around breakeven. If overwhelming selling pressure emerges from ETFs, it should show up clearly in the Risk Index. That is the signal to watch.

English
1
6
41
8.9K
Bitcoin Vector
Bitcoin Vector@bitcoinvector·
Bitcoin has entered the ETF battlefield. Price is trying to consolidate inside the major ETF cost-basis zone: • All ETFs Cost Basis: ~$83K • BlackRock Cost Basis: ~$82.8K • Grayscale Cost Basis: ~$80.1K At the same time, the Risk Index remains anchored in low-risk territory, meaning selling pressure is still largely absorbed. But unlike the Short-Term Holder Cost Basis, where we have clear evidence from past cycles, this is the first bear-cycle test for ETF holders. This is where institutional conviction gets tested. As price ranges below or inside the ETF cost-basis zone, we will see how ETF holders react around breakeven. If overwhelming selling pressure emerges from ETFs, it should show up clearly in the Risk Index. That is the signal to watch.
Bitcoin Vector tweet media
Swissblock@swissblock__

One of the clearest signals of Bitcoin’s early expansion: ETF flows remain aligned with the Risk Index. When the Risk Index stays in high-risk territory, selling pressure dominates → ETF flows tend to weaken or turn negative. When the Risk Index resets into low-risk territory, selling pressure gets absorbed → ETF accumulation returns. That synchronization is still in place. Even when the Risk Index ticked slightly higher last week, ETF selling appeared briefly, but accumulation quickly resumed. That tells us ETF demand is absorbing selling pressure. This remains a flow-driven breakout.

English
2
1
25
12.7K
Bitcoin Vector
Bitcoin Vector@bitcoinvector·
Bitcoin finally moved above $80K. Now the key is consolidation. BTC is capturing both: • True Market Mean • Short-Term Holder Cost Basis So far. These levels usually trigger selling pressure, but between $80K–$87K there is an air gap: • Low on-chain volume • Low trading volume • Limited resistance That means price can move efficiently through this zone. But acceptance requires one thing: Strong demand to absorb selling pressure.
Bitcoin Vector tweet media
English
0
8
40
4K
Bitcoin Vector
Bitcoin Vector@bitcoinvector·
Is Bitcoin heading into expansion? So far, BTC’s upside expansion has been conservative. Look at 2025: When price truly expands higher, the volatility-adjusted resistance stretches upward. At the same time, support rises and builds a base, either for continuation or stabilization. Eventually, that support becomes the bulls’ first line of defense, currently around $74K. If Bitcoin wants to win the Breakeven Battlefield, it needs to transition from stabilization to expansion. And that should start looking more like May 2025.
Bitcoin Vector tweet media
Bitcoin Vector@bitcoinvector

Bitcoin is hitting the breakeven battlefield. BTC is testing a stacked cost-basis zone between $78K–$83K: • STH Cost Basis • True Market Mean • ETF Cost Basis At the same time, the Risk Index remains in low-risk territory, meaning selling pressure has been largely absorbed, although it ticked higher yesterday. → Conditions are supportive → But selling pressure inside this cost-basis zone can be heavy Break and hold = expansion Reject = back to range This is the decision zone.

English
1
6
40
7.2K
Bitcoin Vector
Bitcoin Vector@bitcoinvector·
Bitcoin is hitting the breakeven battlefield. BTC is testing a stacked cost-basis zone between $78K–$83K: • STH Cost Basis • True Market Mean • ETF Cost Basis At the same time, the Risk Index remains in low-risk territory, meaning selling pressure has been largely absorbed, although it ticked higher yesterday. → Conditions are supportive → But selling pressure inside this cost-basis zone can be heavy Break and hold = expansion Reject = back to range This is the decision zone.
Bitcoin Vector tweet media
English
1
4
36
17.3K
Bitcoin Vector
Bitcoin Vector@bitcoinvector·
Liquidity has led Bitcoin’s price recovery. But relying on only one fundamental component is like flying with one wing. Network growth has stalled and continues to signal weakness. That is a crucial divergence. Liquidity can help Bitcoin take off, but without broader participation, it cannot sustain the flight.
Bitcoin Vector tweet media
Swissblock@swissblock__

One silver lining for the bears: Bitcoin’s price structure points higher, but fundamentals remain weak. They briefly improved toward neutral when BTC recovered from the $60K area, and have picked up again since BTC reclaimed $70K. But not enough. Price can still rise here. But for a medium-term trend shift, Bitcoin needs neutral-to-strong fundamentals to confirm.

English
3
4
37
6.7K
Bitcoin Vector
Bitcoin Vector@bitcoinvector·
Bitcoin just hit the battleground: It closed the week above the True Market Mean ($78K) for the first time since late January. This level decides the regime. In 2022, losing it led to prolonged weakness. Reclaiming it in 2023 took months of consolidation. → Holding it changes the trend → Losing it brings back downside pressure This week is key.
Bitcoin Vector tweet media
cryptovizart@CryptoVizArt

x.com/i/article/2044…

English
3
7
50
8.7K
Bitcoin Vector
Bitcoin Vector@bitcoinvector·
Bitcoin has moved into an early risk-on phase. It has been a long and winding road: Failed recovery → defensive → stabilization → contraction Now, risk has reset and macro has turned supportive. BTC is no longer trading in isolation, it is realigning with Nasdaq. That realignment is what often marks a trend transition. But this only holds if: • Risk stays in low-risk territory • Nasdaq continues its stable upward path This gives Bitcoin enough time for the flow regime to shift higher. And if flows follow, Bitcoin can start generating strength of its own.
Bitcoin Vector tweet media
English
2
5
43
4.3K
Bitcoin Vector
Bitcoin Vector@bitcoinvector·
One level to rule them all, for bears and bulls. In bull phases, the Short-Term Holder Cost Basis is the point of inflection. In bear phases, it becomes resistance. A year ago, Bitcoin reclaimed it, consolidated, and months later went on to make new all-time highs. In 2022, rejection below it signaled bear market continuation. Reclaim + consolidate, and bullish expansion is back on the table. Keep rejecting below it, and breakdown remains the path. The STH Cost Basis defines the regime. @glassnode @swissblock__
Bitcoin Vector tweet media
Bitcoin Vector@bitcoinvector

Bitcoin is in early expansion, but first it has to clear key resistance zones. That is where underwater holders are likely to sell into strength as price approaches breakeven. This supply should not be underestimated. For Bitcoin to keep expanding, absorption is the real test.

English
1
5
36
7.6K
Bitcoin Vector
Bitcoin Vector@bitcoinvector·
Bitcoin is in early expansion, but first it has to clear key resistance zones. That is where underwater holders are likely to sell into strength as price approaches breakeven. This supply should not be underestimated. For Bitcoin to keep expanding, absorption is the real test.
Bitcoin Vector tweet media
English
2
6
57
12.2K
Bitcoin Vector
Bitcoin Vector@bitcoinvector·
This is how Bitcoin moves when structure is rebuilding: • First ignition: early positioning • Reset: weak hands exit • Second ignition: momentum expands • Exhaustion: late positioning gets trapped The second move is usually stronger, but also more crowded, making it more vulnerable to a sharper correction if momentum fades. Watch the impulse and momentum, not the noise.
Bitcoin Vector tweet media
Bitcoin Vector@bitcoinvector

BTC impulse is pushing into extreme positive territory again. That’s where momentum looks strongest, but also where moves tend to exhaust in the short term. We’ve seen this pattern all year: impulse spikes → resistance test → rejection. Key question now: breakout this time, or another failed attempt?

English
2
6
35
20.3K
Bitcoin Vector
Bitcoin Vector@bitcoinvector·
BTC impulse is pushing into extreme positive territory again. That’s where momentum looks strongest, but also where moves tend to exhaust in the short term. We’ve seen this pattern all year: impulse spikes → resistance test → rejection. Key question now: breakout this time, or another failed attempt?
Bitcoin Vector tweet media
English
0
8
51
13K
Bitcoin Vector
Bitcoin Vector@bitcoinvector·
BTC is testing resistance for upside expansion again. Will this be another failure? The last upside expansion came just before the October 10 crash. Since then, every rebound has failed to hold, leaving Bitcoin trapped in a bearish structure still prone to another resistance test, or a breakdown. Now price is pushing into the ~$73K zone. But unless resistance is reclaimed with strength, this is still another test, not a breakout.
Bitcoin Vector tweet media
English
0
3
59
6.2K
Bitcoin Vector
Bitcoin Vector@bitcoinvector·
While Momentum keeps the bullish regime shift alive, Impulse is pushing toward its maximum potential, reinforcing the strength behind the move. The first obstacle? Price is sitting at resistance. This is exactly the kind of setup where Bitcoin can challenge that level and unlock at least a stretch toward the previous high near $76K. But if Momentum fades, Bitcoin would likely remain stuck grinding inside the range
Bitcoin Vector tweet media
Swissblock@swissblock__

$BTC remains closely correlated with the NASDAQ as a premier risk-on asset. Momentum is showing a fresh attempt at a bullish regime shift following recent price action. This metric will be essential to track in the coming days, as such a transition typically signals a sustained bullish cycle of 150 to 200 days.

English
0
2
36
6.6K
Bitcoin Vector
Bitcoin Vector@bitcoinvector·
And Market Trend confirms it: Bitcoin is in a bottoming loop: Uncharted → Downtrend → Bottom That’s stabilization attempts, not expansion. Sustained upside only comes once Market Trend anchors in Recovery (blue). Most of the year has been spent in high-risk, high-volatility conditions (red). In bearish regimes, stabilization comes first, expansion comes later.
Bitcoin Vector tweet media
Swissblock@swissblock__

Prolonged weak activity in Network Growth suggests we are in an early-stage bottoming process. Weak participation → not strength yet. But these conditions have historically acted as a prelude to sustained bullish cycles. From here, the focus is on stabilization, not expansion.

English
0
3
38
14.7K
Bitcoin Vector
Bitcoin Vector@bitcoinvector·
BTC is showing positive momentum, but impulse turned flat. That usually means one thing: short-term strength, no follow-through. Momentum can push price higher short term, but without impulse bursting, it often ends in a failed attempt. Sellers still have the edge.
Bitcoin Vector tweet media
Bitcoin Vector@bitcoinvector

$BTC impulse reacts first, then Momentum ignites. Impulse is the trigger. Momentum is the confirmation. Expansion comes after. Right now, what we are watching for is BTC impulse to give the signal, with Momentum close to turning positive. That would be the clue that Bitcoin is starting to regain enough traction to attack the mid $70Ks again.

English
0
5
37
14.6K