고정된 트윗

$SPY $SPX $ES_F
To say the markets look strong from a technical standpoint would be a stretch in our opinion.
Here is why...
From the October 2022 lows, we have 5 waves up. We can be fairly confident that the count is correct because of the bearish divergence on the RSI and MACD that is prevalent at our suspected wave 5 top. (Yes, there are other bullish counts, but this count seems more likely in our opinion)
And when you take a look at the daily chart, the RSI and MACD bearish divergence is a lot more prevalent and the structure we have forming at the top resembles an "ending diagonal in a bull market"
Taken from " Elliott Wave Principle" by Frost and Prechter, they quote "In all cases, they (ending diagonals) are found at the termination points of larger patterns, indicating exhaustion of the larger movement" (Image shown below)
Additionally, the fact that price seems to be consolidating at all time highs raises the concern that we are forming a distribution zone rather than an accumulation zone.
Of course, we can't go lower without losing the 50MA. This will be our first signal. The weekly 50MA sits above our first set of fib levels that we would be targeting and if buyers lose the 50MA, then we highly suspect these fib levels will be tested
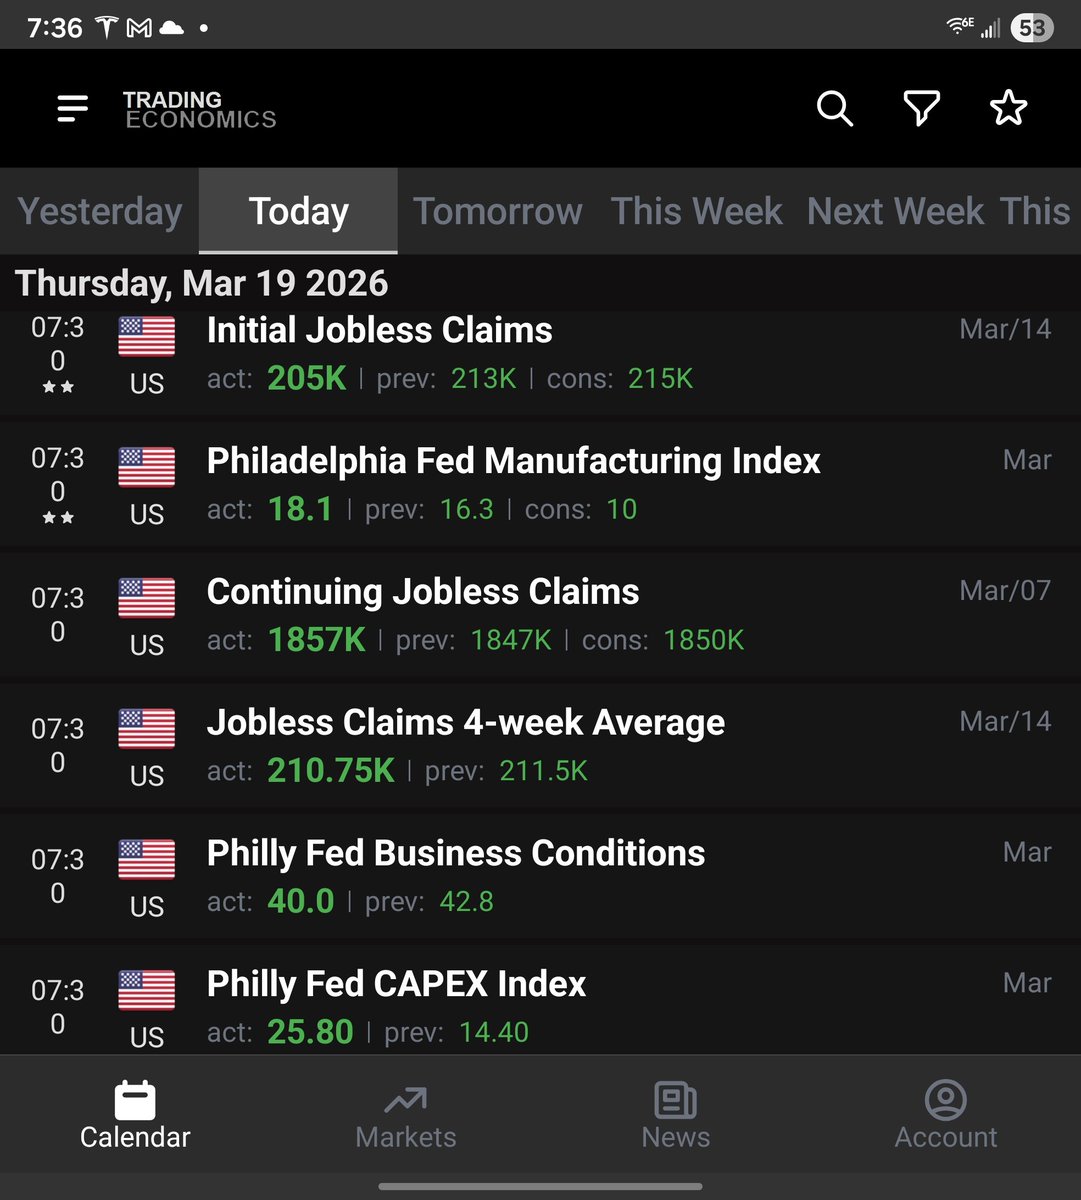
A trigger is likely needed and that is where the uncertainty comes into play. We have spoken and posted in the past about 7,000 being an important level and that has proven to be true. The $SPX tapped 7,000, but has since fallen and continued to show weakness
Other influences is a very weak crypto market that is getting pounded and the massive run we saw in precious metals. All of these may be very clear signals in hindsight.
We have been persistent about sharing charts like $GIS $TGT $UPS $VICI $NKE $EL $LULU $PFE $UNH $NVO because these tickers have NOT being following the $SPY and we chant help but notice the weakness on the chart for the reasons listed above.
**Note, we also have been sharing $PYPL, and we feel the pain as well. The fundamentals look outstanding for the price, but again stock sentiment is a real thing and $PYPL has had the worst of it. Curious to see if the CEO can turn the narrative around
That's it for now, but we wanted to share an in-depth analysis on the chart alone and what we have been noticing over the course of these last few months.
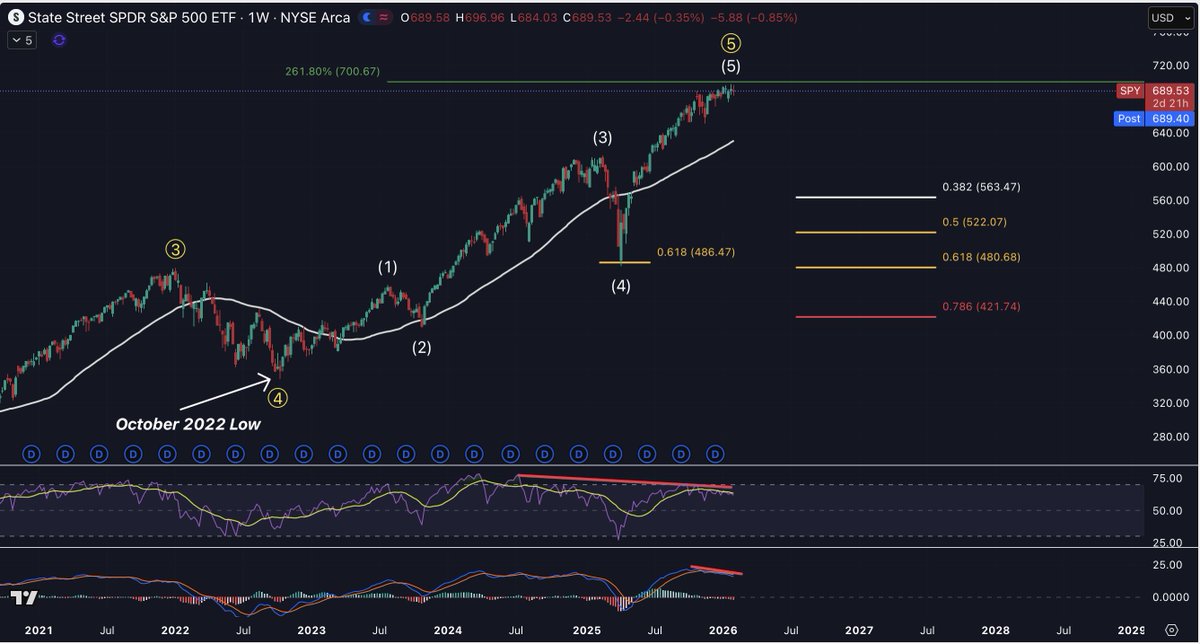
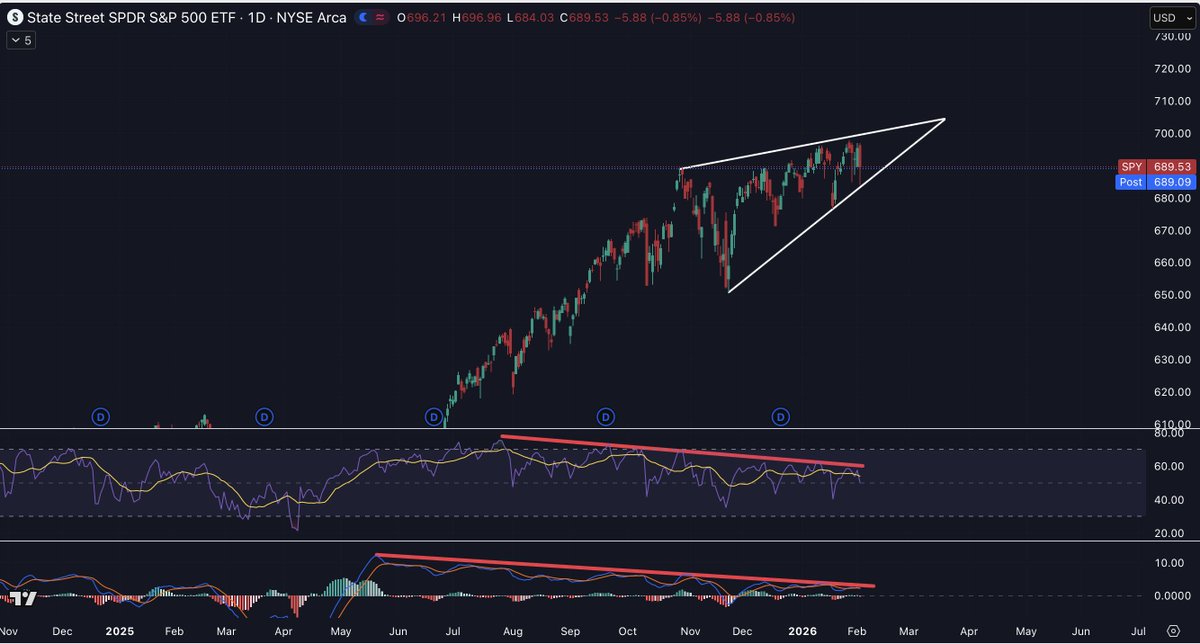
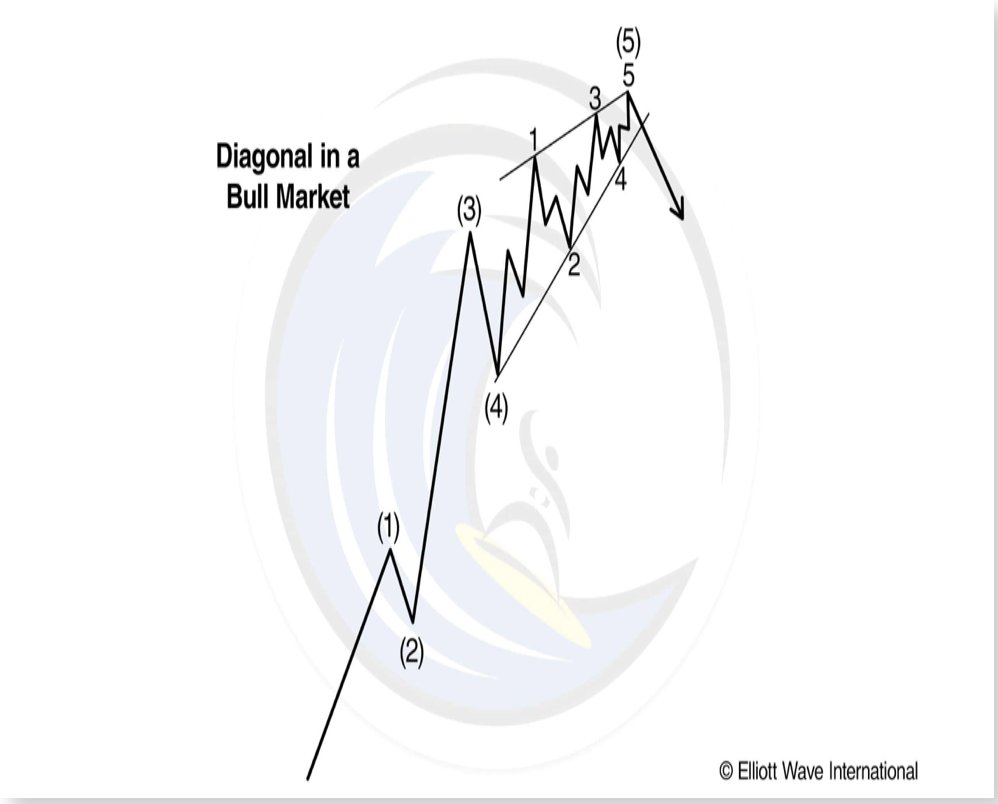
Chart Wave Trading@ChartWaveTrade
$SPX $SPY $ES_F Let us be clear, anything could happen. There are two sides as to whether or not we are entering a new bull market or not We wanted to share one possibility for everyone. We have shared in the past that $700/7,000 was a potential top in the market. We see confluence with fib extensions at that level and markets tend to like round numbers. The chart below is of $SPX in 3month candles, starting with wave 1 in the early 1990s. There is a count that shows we are in a wave 5. Now, the Elliott wave Theory is subjective and an art form and is not a perfect science. There are different counts that are a possibility. We wanted to share one of the possibilities so people are aware.
English