
ConvexEdge
1.1K posts

ConvexEdge
@ConvexEdgeX
Swing Trader. Market Cycles. I don't give financial advice. All I share on X is educational content.
가입일 Mayıs 2020
609 팔로잉2K 팔로워


Every path asks two questions:
Which way am I headed? That's the slope.
How is the road bending? That's the curve.
Traders obsess over the slope. The edge is in the bend.
Limited downside, unlimited upside - that's not just a payoff. It's how you manage risk.
That bend has a name: convexity.
(For the quants: f″ > 0.)

English

@crypto_revolt If I had to guess, somewhere between $1000 and $800. But again, time is a way more important target than price.
If I see confirmations in the timing window, I act, regardless of price at that moment.
x.com/ConvexEdgeX/st…
ConvexEdge@ConvexEdgeX
Somewhere between $30K and $44K is my guess. But honestly, the price target matters less than the timing. When the 4-year cycle low window opens, that's when you start paying attention. If confirmation signals appear during that window, you take the position — regardless of the price at that moment. Cycles are about time first, price second.
English

Concavity is the inverse - and the trap.
Gains cap, losses compound. You pick up pennies in front of the steamroller and call it a strategy.
The win rate looks great. The one loss doesn't care about your win rate.
Risk management bounds the downside, and concavity is the shape that unbounds it.
(For the quants: f″ < 0.)

English
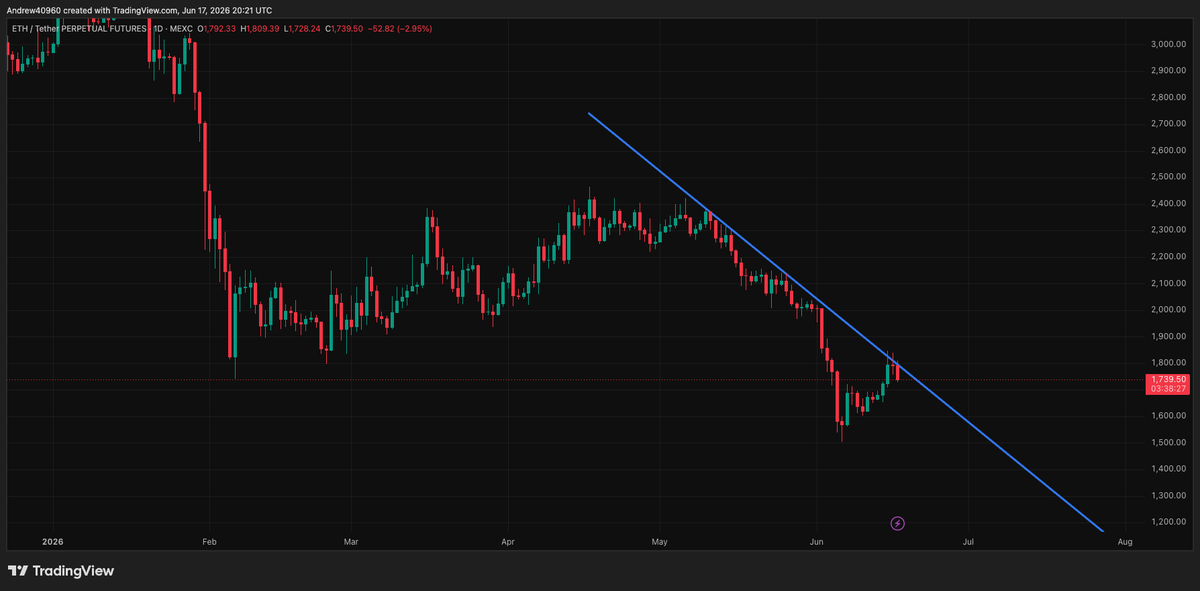
Update: $NDX broke down. Cycle Theory back in charge.
Next DCL projected ~July 17

ConvexEdge@ConvexEdgeX
$NDX Day 20. Daily cycle failed at day 16 - a close, not a wick. 2–3 weeks to the next DCL. The theory says down, not up. Blow-off tops don’t read the theory, though.
English
Added to $BTC shorts on it: dominance bottoming is the mirror of risk topping.
English
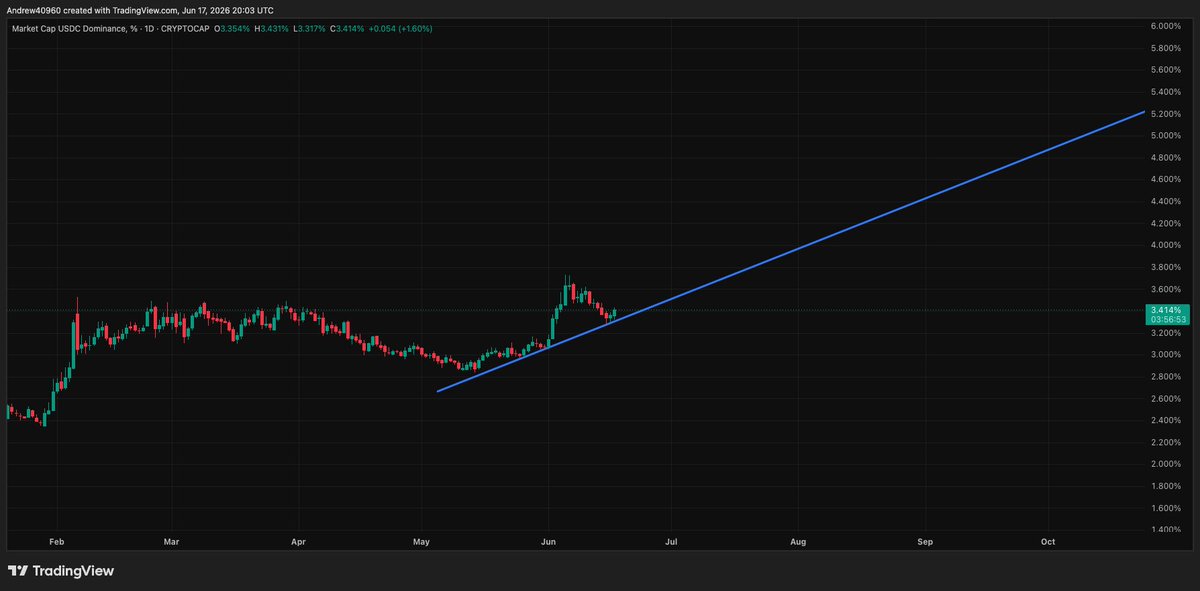
Update: $USDC.D held support and closed back above the 4H trendline. The low confirmed. I said it could fail - this time it didn't.
That's not a prediction paying off. It's probabilities resolving.

ConvexEdge@ConvexEdgeX
Same idea as my inverted charts, intraday. The @camelfinance indicator picks lows on every TF, and lows read cleaner than tops. So to time a $BTC top, I look for a low on its mirror. On the 4H, $USDC.D just printed one at trendline support - stablecoin dominance bottoming as risk peaks. Could fail. Your job is to weigh probabilities, not predict.
English
FOMC incoming. Don’t waste your capital. Always wait for confirmations and manage risk (1% rule).
English
ConvexEdge 리트윗함

There are so many macro viewpoints I see.
Most market participants analyze charts in isolation, or worse, are narrative biased.
That's a mistake.
Macro sentiment is not derived from a single chart, indicator, or asset class. It emerges from the relationship between multiple layers of data. Without that context, even the most sophisticated chart analysis risks missing the bigger picture.
Consider the following developments that have unfolded over the past year:
▶️ $GOLD broke out of a range that had persisted since 2011.
▶️ $XAG followed with a similar long-term breakout.
▶️ $SPY broke above higher-timeframe trendline resistance that had capped price action for decades.
▶️ $DXY remains in a higher-timeframe decline while consolidating beneath major monthly resistance.
These are not isolated events.
They are interconnected signals that help explain the broader macro environment unfolding beneath the surface.
Gold's breakout is often characterized as a "flight to safety," but I believe that interpretation misses the deeper message. This is not simply capital seeking refuge—it is a repricing of money itself.
Silver's breakout reinforces that thesis.
Unlike gold, silver carries substantial industrial demand, making it both a monetary asset and a critical input into economic activity. Similar behavior can be observed across numerous commodities that underpin global industry, energy production, and food supply.
When viewed collectively, a pattern emerges.
The market is repricing scarce assets relative to fiat currency.
This is not unprecedented. Throughout the history of modern monetary systems, periods of monetary expansion have repeatedly resulted in the revaluation of tangible assets and stores of value.
Markets are inherently forward-looking.
They do not wait for inflationary consequences to become obvious—they begin pricing them long before they appear in official data.
The combination of persistent inflation, expanding debt burdens, and continued monetary accommodation creates a simple mathematical reality: purchasing power declines over time.
The process is rarely linear.
Markets spend years consolidating, then suddenly reprice in powerful, nonlinear moves as key levels give way and capital rushes to adjust.
The question isn't whether the market is sending a signal.
The question is whether you're connecting all the signals together.
Connect...the...dots
p.s. I was going to include 1 more ▶️ for $TLT 20 year launch anniversary in 2022, but that's for another time
Likwid Filius@Likwid_Finance
As anticipated, the week closed with Scenario 2⃣. Looking across ST daily price action in the major indices and capital sentiment charts, directional clarity was limited & played to the tune of narratives. The short-term picture continues to paint a bearish picture, with several key levels currently behaving as potential retests before another leg lower. That remains a scenario worth respecting. However, higher timeframes continue to carry the most weight in my analysis, and until they materially change, my broader framework remains intact. Just as well, other observations noted continue to materialize: Oil weakness, AI profit taking (notice the divergence vs. strength of narrative🧐). At this stage, we appear to be approaching one of two outcomes: • Markets pivot from the attractive risk-adjusted entry opportunities for a number of bullish setups. • Or the bearish case prevails, stops are triggered, and those ideas are invalidated. Either outcome is acceptable. The objective is always to position where the reward justifies the risk and probabilities are skewed in our favor. I prefer to stay aligned with the prevailing higher-timeframe trend, maintain a constructive bias where the risk/reward is favorable, and let my stop losses concern themselves with the bearish scenarios. Until now, focus was required during times of mass manipulation...I think they even threw in an alien announcement at the end of the week😆. I believe this week should provide that pivot clarity we've been anticipating. Have a blessed week everyone🙏
English
@factor_3zy Thanks mate. The chart called it, I just read it out loud.
English

$SB could be working on an inversion after a failed DCL: a low forming and reversing up hard in the middle of the cycle, where the cycle pointed lower — seller exhaustion. These only confirm in hindsight, so I’m watching the next few days.

English
$ZS printing a DCL at the end of the timing window, trendline breaking.
I’m a buyer on the close above.

English
ConvexEdge 리트윗함

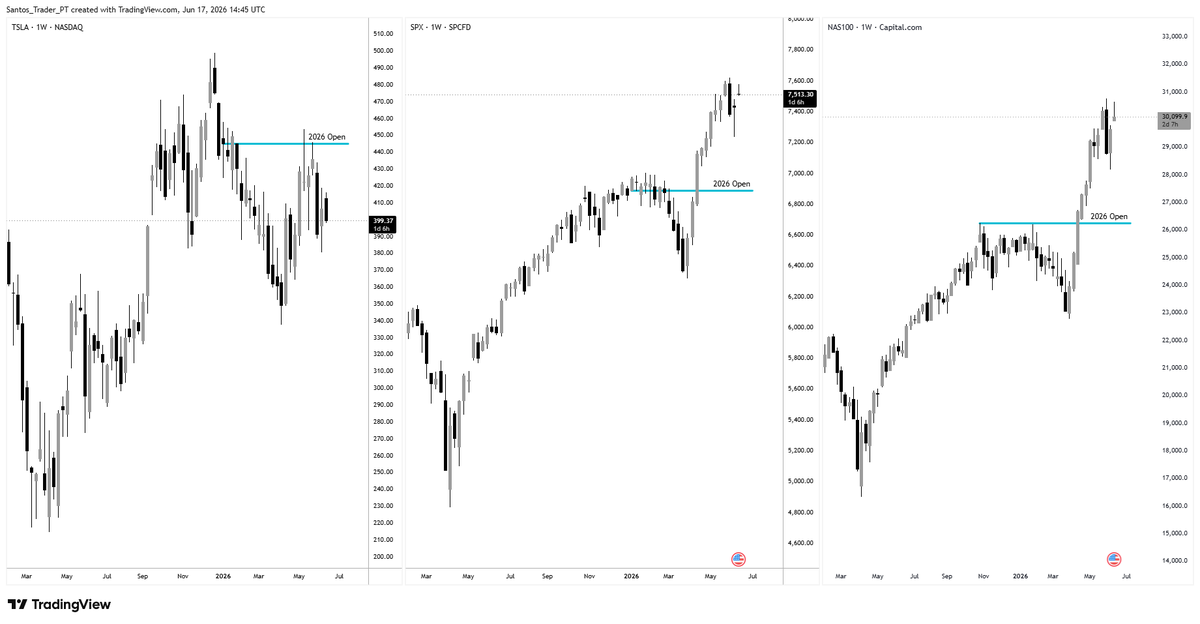
Tesla looks very weak compared with the S&P and the Nasdaq since the year started.
While the indices made new all-time highs, TSLA found resistance at the 2026 Open, making a lower high.
Maybe it's one of the canaries in the coal mine for the stock market.
So my thesis is the weekly cycle will fail and it's going lower, maybe all the way back to 250$.
Also not convinced the DCL @camelfinance indicator is giving a chance will hold.
I'm short with a small risk, 0.5%. Not going to pretend this is a stock I'm used to swing trade and/or short.
Inverted chart with Camel indicator to find the highs:
1/NASDAQ:TSLA
The inverted chart idea is proudly borrowed from @ConvexEdgeX


English