

GIF
English
𝒞𝓇𝓎𝓅𝓉𝑜 𝐵𝑒𝒶𝓈𝓉 ⸨ ✧ Rule the Game ✧ ⸩
15.4K posts

@808cryptobeast
“Ma ka pouli o ka pō, ke ʻimi nei au i ka nani o nā hōkū, me ka hoʻomākaukau i ka hoʻōla i ka naʻauao ma nā ʻaoʻao hou like ʻole o ke ao.”


Tradicional markets are giving bigger pumps, more safe, most sustainable, more predictable, better in every aspect. So I am wondering, what the f*ck are doing in crypto? Crypto is done and over. There is no reason we stay trading this shit.
And that’s the amateurish mindset. The market is only as speculative as people allow it to be. Creating multiple scenarios alone is not risk management, understanding probabilities, positioning, liquidity, psychology, and having the discipline to act accordingly is. Too many confuse uncertainty with strategy. Real risk management is about accountability, adaptability, and knowing when your assumptions are wrong, not throwing out endless possibilities to cover every outcome.


🟩 $TX tx:native We still haven't hit that 1.618 🔸 $0.00761 TX Marketplace is what gets us going up 📈 We have clearly been waiting for this "Tokenization Innovation Exemption" since Dec 2025 🟣 Purple 9-EMA moving average WILL end the TX bear market



Tomorrow’s going to be a great day.
Do you comprehend what we have here? Most useful features directly built into the layer 1. Human readable. Standardized. No surprises on the XRP Ledger. What you see is what you get. Its risk profile is unmatched, especially for high-value stakes.

@808cryptobeast 💯! An amazing fact — I used to dislike @Zenwarrior113 , but the merger showed who truly cares about investors!#Coreum #solo #xrp #solotex #Tx $tx 👇👇👇


Have a fun weekend everybody. Took some time to get away, 🎧vibing some Gregory yessuuhhhh🎧 🥊Last trip before the tournament🥊
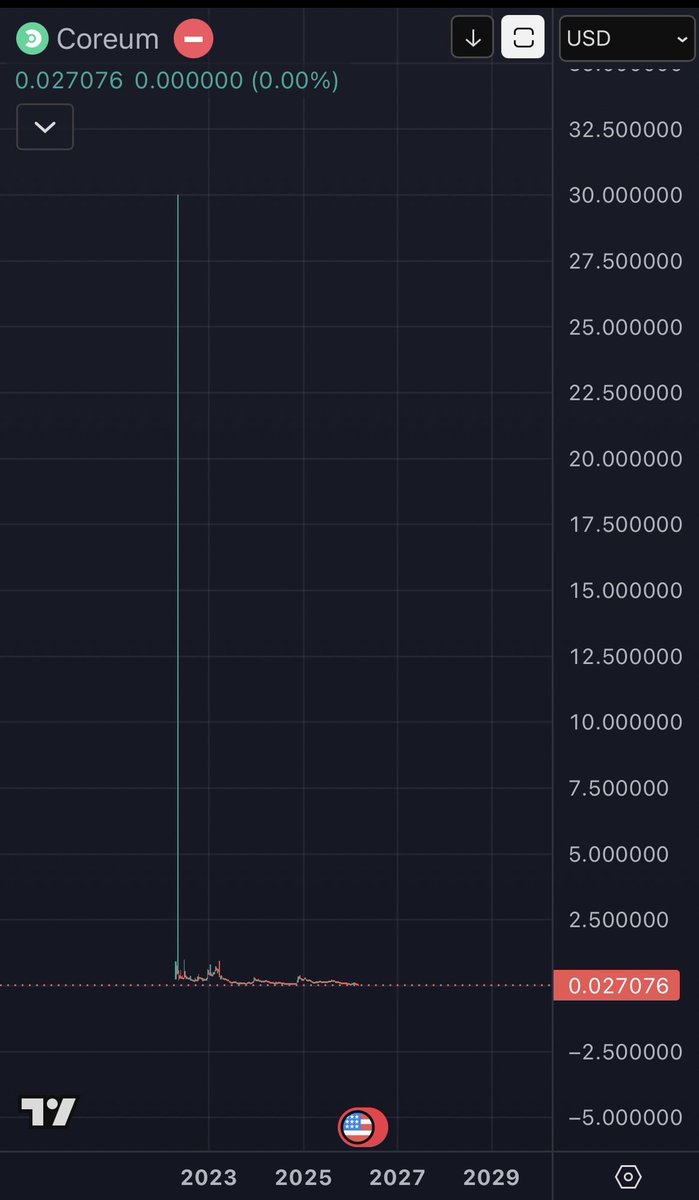
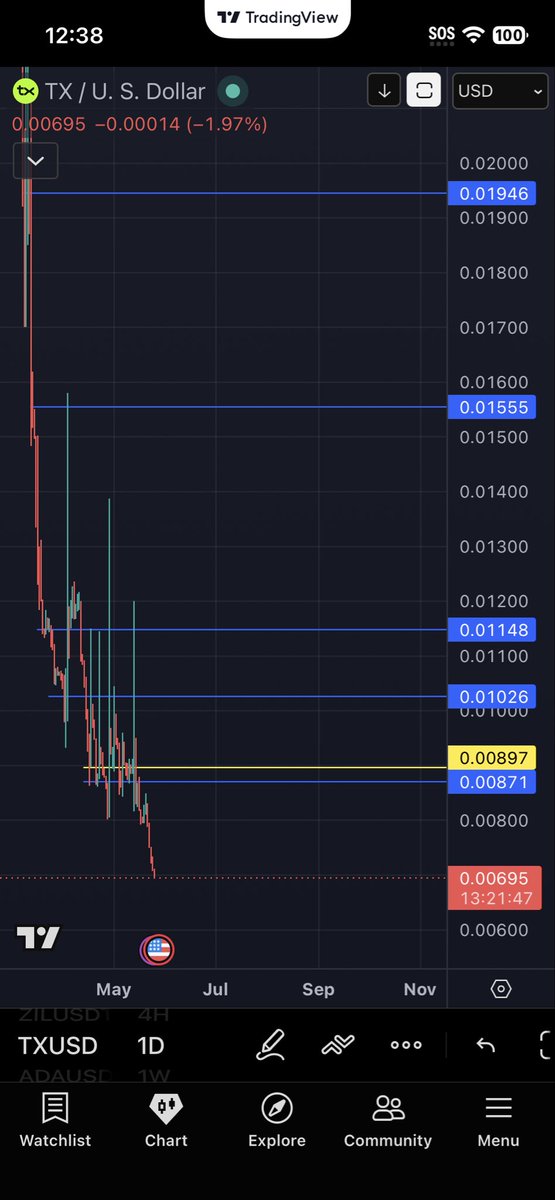
Revisiting my analysis from late April to early May 2026. I highlighted the importance of higher time frames dictating lower moves. Structure over noise, no word salad or forced indicators. The higher TFs were showing range bound and choppy conditions with downside risk if key levels broke. Since the TX move on 4/28/26, price is now down roughly 49% and trading back below $0.07, reinforcing the exact higher time frame weakness and lack of follow through I was pointing out at the time. Meanwhile, looking back at the persistent patterns from @BRW_Solo and @duarter999 on $TX / tx analysis. Their recent posts still lean heavily bullish and long term optimistic. BRW continues talking about bull run loading, 1.618 targets, and the purple EMA signaling the end of the bear market, while Duarte continues emphasizing no fear, massive upside potential toward a 25B+ market cap, and “smart early investors” simply timing things wrong. Compare that to the framing around April and early May, around the same time as my original post: strong bids, imminent upside explosions, 400% moves, and major moments supposedly right around the corner. Price never followed through on those near term expectations, yet the narrative shifted into “long term thesis, relax, future potential” without really addressing the higher time frame structure or the interim drawdown. My higher TA outlook has remained consistent the entire time with no goalpost moving, while continuing to emphasize alignment with actual structure and price action. Be careful who you follow, many frame themselves as for the community but time and time again actions says otherwise , be aware of intentions that are not shown by mere recognition but by you yourself understanding the different dynamics, learning unbiasedly. 💯💯💯

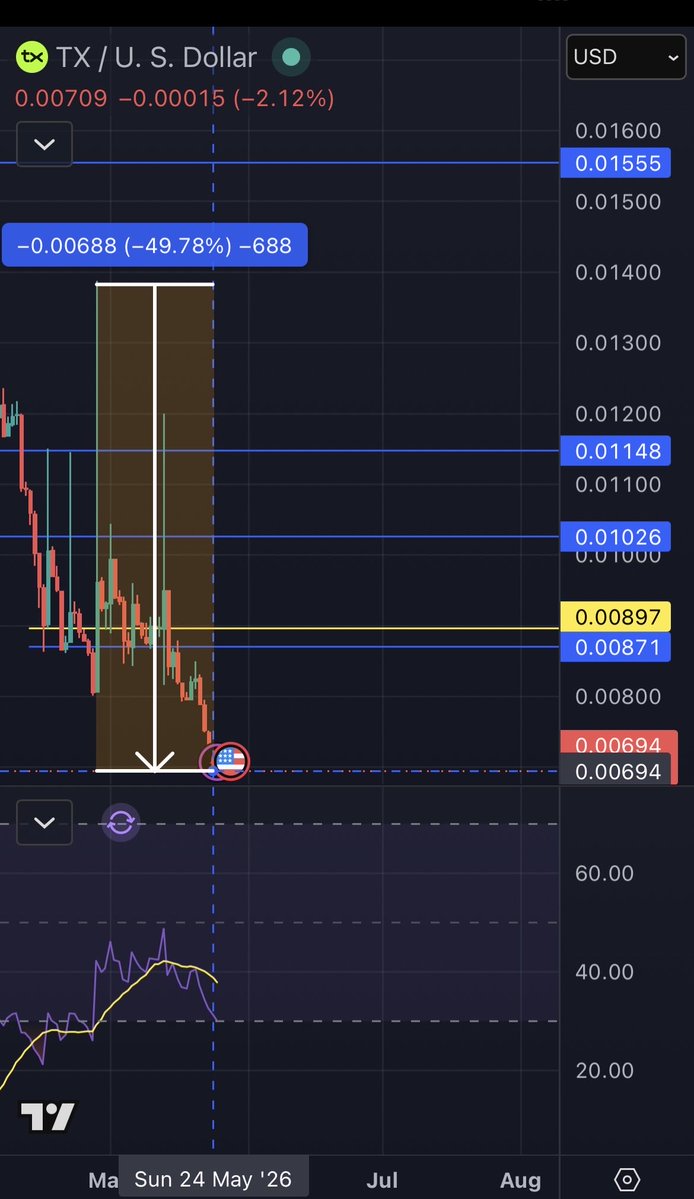
🫡Revisiting TX TA, without all that word salad and showcasing TA without bias and yes their is no need to post Your ta every hour or even everyday, that’s just you trying to confirm your bias💯 On 4/21/26 the focus was on the weekly boundaries controlling the lower time frames, and that structure has continued to play out into 5/8/26. The higher time frame levels already outlined the range price was operating within, and instead of getting caught up in narratives, theories, or emotional optimism, the chart itself continued respecting those levels. The yellow zone around 0.00897 continued acting as resistance while the weekly support region around 0.00871 remained the lower boundary. Even with relief candles forming, price still struggled to reclaim and sustain above higher time frame resistance. This is why temporary green candles alone do not confirm reversals. A lot of people overcomplicate TA with endless macro talking points, indicator worship, and confirmation bias, but real analytical observation comes from understanding structure, reactions, and how higher time frames dictate the environment lower time frames operate within until true reversals occur. The relief bounce many interpreted as strength was still operating inside a broader downside structure. Historical data repeatedly shows that after aggressive declines, markets often produce recovery reactions that emotionally pull people back in before actual higher time frame reversals are confirmed. This is why managing yourself matters just as much as managing assets. Bias causes people to see what they want to see instead of what the structure is actually showing. The chart does not need narratives attached to it. Either higher time frame levels are reclaimed with continuation and acceptance, or price remains suppressed within the existing structure until proven otherwise.

