David Bird (ASX Trader) B.Ed, CFTe

4.3K posts

David Bird (ASX Trader) B.Ed, CFTe banner
David Bird (ASX Trader) B.Ed, CFTe

David Bird (ASX Trader) B.Ed, CFTe

@ASX__Trader

Certified Financial Technician - CFTe | Financial Analyst & Educator | Media Presenter | Keynote Speaker | News Corp columnist | Founder of MtM

Katılım Ocak 2022
96 Takip Edilen21.5K Takipçiler
Sabitlenmiş Tweet
David Bird (ASX Trader) B.Ed, CFTe
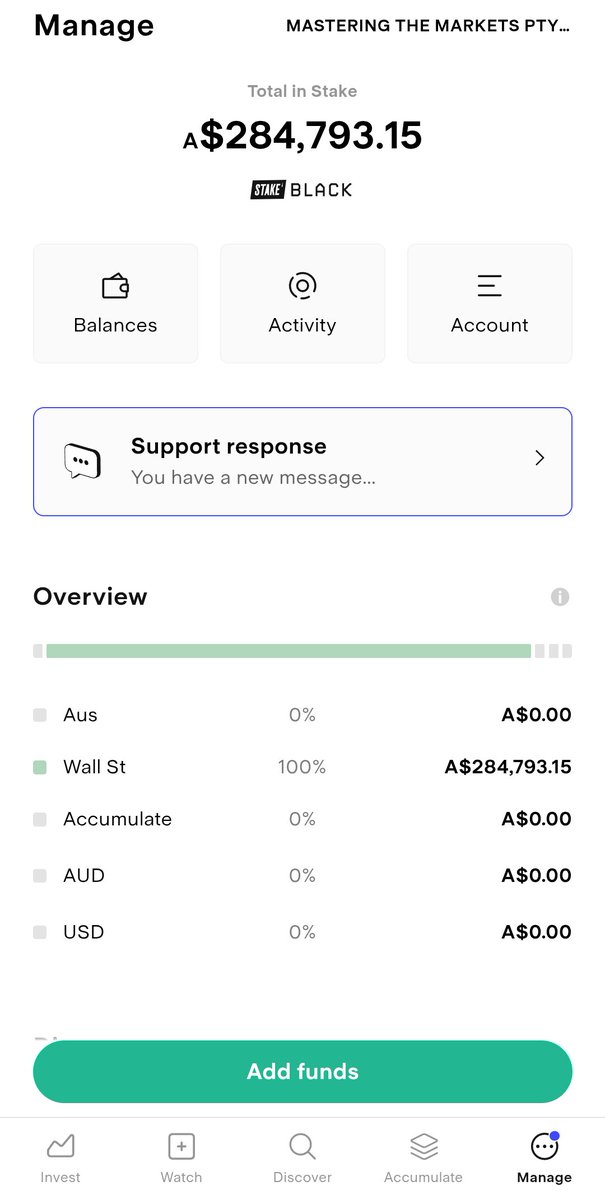
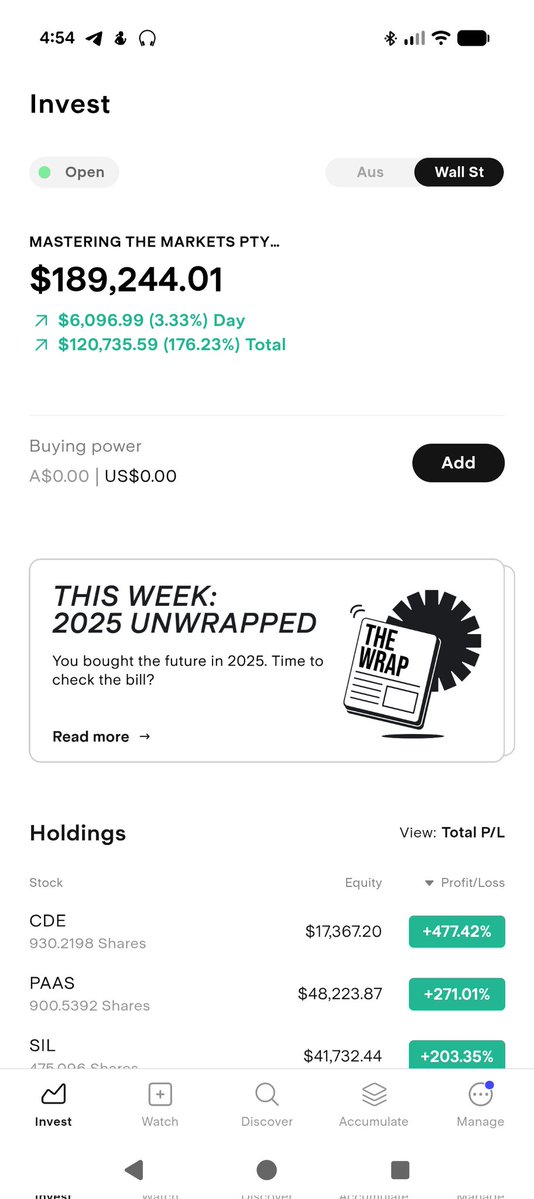
Major Milestone achieved for the public MtM account. (Account has tripled in 18months) At the beginning of last year, a few MtM students asked me a fair question: “How do we know what you’re teaching actually works?” So as you know I decided to show them — publicly. I opened a public MtM investing account (not a trading account). Minimal transactions. Long-term holds. I deposited $100,000 AUD (about $63,000 USD at the time). You’ve all been able to watch this journey publicly online for the last 18 months, from the moment I started it in April 2024 showing all the transaction statements. And as you know, we’re ASIC licensed — we’re an Authorised Representative of an AFSL — so I can’t post anything that’s misleading or untrue. As of today, that account has tripled to $189,000 USD. And what’s interesting is the part most people miss: the journey. A couple of months ago I showed you the account dropped from $270K to $220K — down $50,000aud in a couple of weeks — while many were calling a major top in gold and silver. My view didn’t change: the top wasn’t in. Because if you can’t handle the zags, you don’t deserve the zigs. Most people will never get outcomes like this for one reason: they don’t hold their winners. They cut them out of fear. Ironically, people hold onto losers because they don’t want to be wrong… but they struggle to hold onto winners because they don’t believe it can keep going. That’s why data > emotion. One thing you’ll notice is that the original $100K AUD isn’t $300K AUD yet and that’s simply because the Australian dollar has strengthened. When you invest in US assets from Australia, currency moves matter. As the AUD rises, it reduces the translated value of USD gains back into AUD terms. It’s a key factor to understand when investing offshore as I mentioned the other day with the AUD being bullish. But the best part of this milestone isn’t my result. I’ve received hundreds of messages from MtM students seeing similar progress — many doubling their accounts because they’ve learned to follow process, manage psychology, and let winners work. And that, to me, is the most important part. It’s easy for one person to do well. There’s no value in me knowing how to do this if I can’t transfer the skill to other people — so they can build it for themselves. That’s what MtM is. It’s education. I spent over a decade as a primary school teacher and HOC and that experience is everything. Not because it sounds nice but because it taught me how people actually learn. It’s not just what you teach. It’s how you sequence it. You build it like curriculum: one block at a time, in the right order, so students develop a deep, thorough understanding — not just a few tricks, not just a couple of setups, not just “signals.” Because markets don’t reward memorisation. They reward understanding. masteringthemarkets.com Learn - grow - succeed
David Bird (ASX Trader) B.Ed, CFTe tweet mediaDavid Bird (ASX Trader) B.Ed, CFTe tweet media
English
7
6
119
59K
David Bird (ASX Trader) B.Ed, CFTe
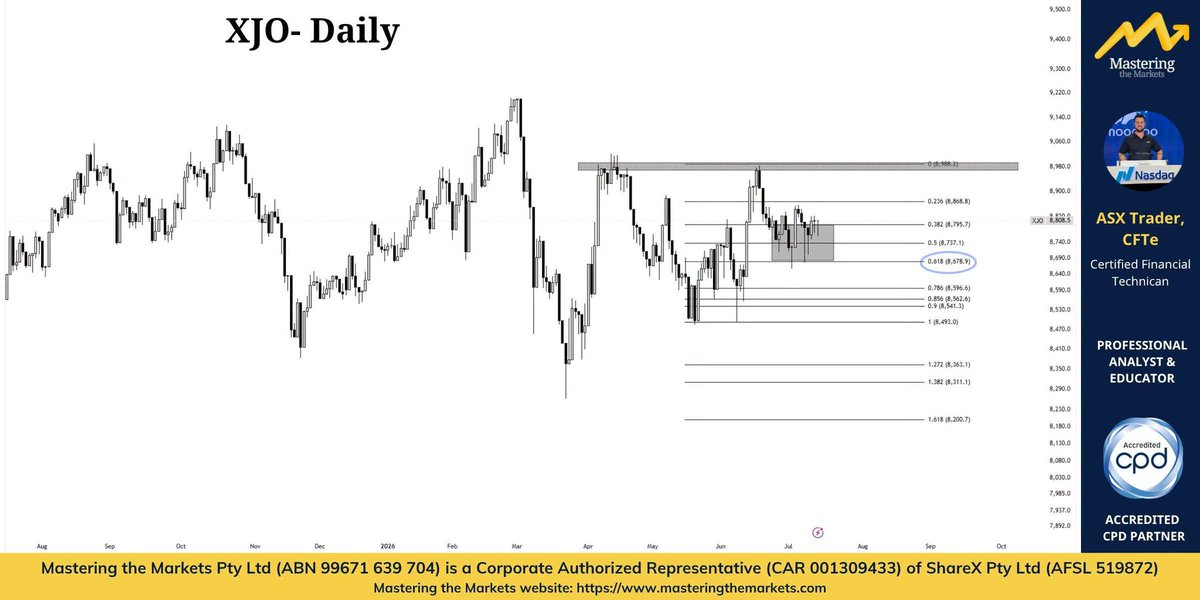
The ASX 200 has now spent almost a year in what I would describe as a kangaroo market. Plenty of movement, but very little overall progress. If you've found the market frustrating over the past 12 months, there's a good reason. Since August last year, we've largely traded sideways, with neither buyers nor sellers taking lasting control. For me, 8,670 remains the key level. While the index holds above 8,670, I maintain a bullish bias. Buyers are still defending the longer-term trend, and the market has every chance of pushing higher. However, a sustained break below 8,670 would be a warning that momentum has shifted, increasing the risk of a much deeper correction. On the upside, 9,000 is the level that matters most. A decisive break and close above that resistance would be a significant technical development and, in my view, would signal the next leg of the bull market. If I had to put probabilities on it today, I'd lean slightly in favour of the bulls. For now, patience remains the best approach. Until the market breaks out of this range, it's still a case of respecting the key levels rather than trying to predict the next move. Do you think the ASX 200 breaks above 9,000 first, or below 8,670?
David Bird (ASX Trader) B.Ed, CFTe tweet media
English
2
1
45
3.8K
RET
RET@anon_20018·
@ASX__Trader jeremy grantham is a permabear who said the worst crashes of all would happen around 21/22. then we had a normal bear market and a multiyear bull market which were still in. he isnt the best person to follow for advice.
English
1
0
1
68
David Bird (ASX Trader) B.Ed, CFTe
Jeremy Grantham isn't just another market commentator. He's one of the world's most respected long-term investors and the billionaire co-founder of GMO, an investment firm that has managed over US$100 billion. He built his reputation by focusing on valuations and long-term market cycles. Over four decades, he's become famous for warning about some of history's biggest asset bubbles, including Japan in the late 1980s, the dot-com bubble and the US housing bubble before the GFC. What many people forget is that Grantham sold his US shares in 1998, almost two years before the market peaked. For the next two years, the Nasdaq surged another 300%. People said he'd lost it. Then the bubble burst. Here's the part most people miss. Grantham wasn't trying to pick the exact top. He invests with a decade-long mindset, not a 12 month one. Even though he "missed" the final 200% rally, anyone who simply held from 1998 went nowhere for more than a decade. That's what long-term investors are trying to avoid. It's about recognising when the risk versus reward has changed. Those who've followed me for a while know I've called many major cycle tops across multiple asset classes. Even with that track record, I'm still not trying to pick the exact top. The real edge isn't selling the highest tick. It's recognising when risk outweighs reward and moving capital into better long-term opportunities. When one asset becomes historically overvalued, another is usually undervalued. Many think the S&P 500 is the only place to invest. Markets move in cycles and opportunities always exist elsewhere. Think of it like two balloons. One has had so much air pumped into it that you never know which extra puff will make it burst. The other has only just started to inflate. Which one offers the better risk versus reward? Some people might look at the 18 year cycle and say, "Only four out of the seven times it crashed." But I don't think that's the right question. The better question is this. Was the S&P 500 the best place for your capital over the following five to seven years? Looking back over the last 100 years, every 18 year cycle was followed by below-average returns. Not one produced above-average performance. Four of the seven periods ended with major crashes of around 35% to more than 55%. The other three weren't much better, with years of sideways, dead money. To me, a decade of dead money is almost as bad as a bear market because your capital isn't compounding. I'm not trying to be some 18 year cycle guru. That's not what I do. I look for confluence. Before I even looked at the 18 year cycle, there was already overwhelming evidence suggesting we're in a zone where investors should be thinking more about risk than reward. Valuations, market phases, sentiment, long-term technical analysis and several other indicators were already telling a similar story. I simply thought the 18 year cycle was another observation that lined up with everything else. On its own it proves nothing. But when multiple independent factors point the same way, I think it's worth paying attention. When one asset class becomes historically overvalued, another is usually undervalued. That's where I want to spend my time looking. That's why Warren Buffett is holding one of Berkshire Hathaway's largest cash positions ever. He also reduced risk before the GFC. He didn't sell the exact top, but had cash ready when opportunities came. The right strategy depends on your situation. If you're 20, you can probably ride through a decade of dead money. If you're 60 and relying on your investments, that's a very different story. Can you handle a decade of dead money if history repeats? Some can. Others can't. It depends on your age, your goals, your time frame and your tolerance for risk. That's why investing is personal. One strategy will never suit everyone.
David Bird (ASX Trader) B.Ed, CFTe tweet media
English
7
3
56
5.3K
David Bird (ASX Trader) B.Ed, CFTe retweetledi
The Courier-Mail
The Courier-Mail@couriermail·
The market looks quiet on the surface — but something is shifting that has only happened six times in the past 100 years, and most investors have no idea it’s even occurring. Writes ASX Trader: bit.ly/3R6Itdc
The Courier-Mail tweet media
English
1
1
6
1.9K
capTEN
capTEN@CapitalTen·
@ASX__Trader There is clearly a pattern visible in your chart: Only every second correction is an actual bear market after a more sideways movement 18 years before. So we could a see a sideways move again instead of a genuine bear market.
English
2
0
3
397
David Bird (ASX Trader) B.Ed, CFTe
The S&P 500 has never delivered above average returns after these 18 year cycle peaks over the last 100 years. History doesn't repeat perfectly, but it often rhymes. Go back to 1900s, then every 18 years after that, and a remarkable pattern emerges. • 1918: Around a 30% decline. • 1936: More than a 55% crash. • 1954: Five years of dead money. • 1972: Nearly a 50% crash. • 1990: Around 20% total return over the following five to seven years. Positive, but still below the long term average. • 2008: More than a 50% crash. Not once over the last century has this point in the cycle delivered above average long term returns. Now ask yourself... Do you really think it's a coincidence that the Gold-to-Dow ratio is sitting on major support seen only a handful of times in history? Do you think it's a coincidence that the Buffett Indicator is at the highest level ever recorded, the Shiller P/E is approaching dot-com extremes, and almost every major valuation metric is flashing red? Or do you think this time is different because of AI? Investors said the same thing during the dot-com boom. They said it when automobiles transformed the economy. They said it when radio arrived. They said it again when television changed the world. Every generation believes a new technology has rewritten the rules. It never does. Technology changes. Human psychology doesn't. Markets move in cycles. Valuations matter. The COVID decline wasn't a true secular bear market. It lasted only weeks before unprecedented stimulus pushed markets to new highs. The 2022 decline was painful, but it wasn't the kind of prolonged wealth destruction seen in 1929, 1973 or 2008. Most investors today have never lived through a genuine secular bear market. When one eventually arrives, it has a way of humbling people very quickly. History never guarantees the future. But ignoring over 100 years of evidence because "this time is different" has rarely ended well.
David Bird (ASX Trader) B.Ed, CFTe tweet media
English
22
28
203
18.7K
David Bird (ASX Trader) B.Ed, CFTe retweetledi
Swyftx
Swyftx@SwyftxGlobal·
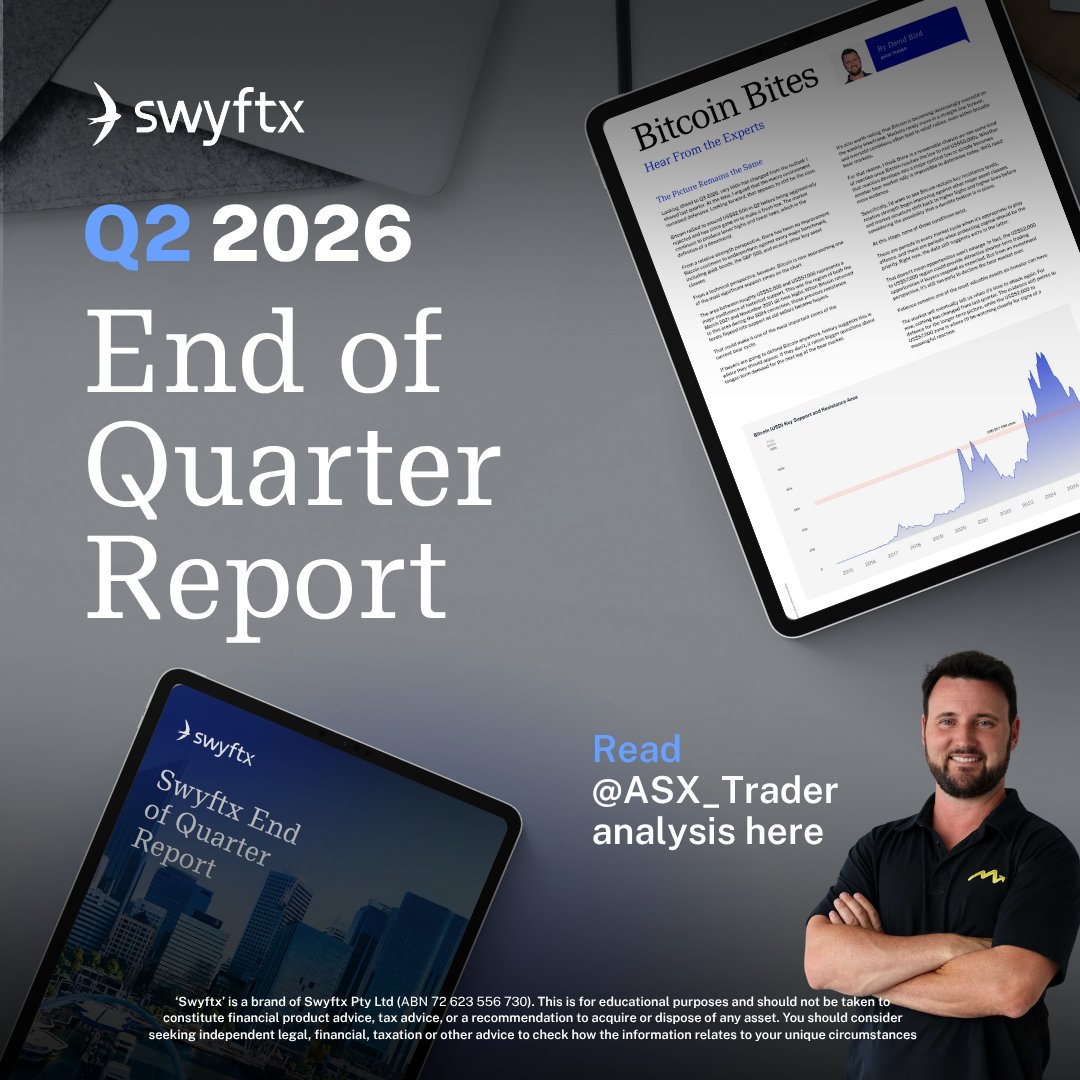
The picture hasn't changed much, and according to @ASX__Trader that's the point. David Bird from @MasteringMkts is back with Bitcoin Bites in our End of Quarter Report, mapping the support zone he's watching and why he's still leaning defensive heading into Q3. Read the full report: swyftx.app.link/e/d1hKqmxEC4b General information only, not financial advice. Crypto assets are high risk.
Swyftx tweet media
English
1
1
16
168.2K
David Bird (ASX Trader) B.Ed, CFTe
The Blues win was even sweeter last night when you're sitting right next to the Maroons' coaching box. Poor blokes didn't know what hit them. Better luck next year Billy.
David Bird (ASX Trader) B.Ed, CFTe tweet media
English
1
0
22
4.5K
David Bird (ASX Trader) B.Ed, CFTe
Yeah, that's exactly why I have different accounts. I've got a long-term investment account where I'm happy to hold assets for years. In any secular bull market, 30 to 60% pullbacks are completely normal. They're unavoidable. Just look at Nvidia. It had multiple 30% to 60% pullbacks on the way to becoming one of the best-performing stocks of the decade. If you can't sit through that kind of volatility, it's almost impossible to hold great long-term investments. Then I've got a separate medium-term account where the goal is to make money over several months. That's the account I sold from. I actually sold on the exact day of the top after saying the week before that I believed that's where the market would peak. It's all timestamped on my timeline. Different accounts. Different timeframes. Different strategies. That's what stops you from making emotional decisions and mixing up investing with trading.
English
0
0
1
211
yovann
yovann@yovann20516221·
@ASX__Trader In what play book doesnt a 53% drop (Silver) is a "temporary pull back"? I mean...thats a very DEEP pullback. You have deep pockets and a very high risk tolerance (or lack of technical analysis) if you can allow a stock or an asset to drop 50% and call it a pull back.
English
1
0
0
54
David Bird (ASX Trader) B.Ed, CFTe
A lot of people were asking how I managed to call the low in precious metals last week. What they don't know is why I still believe there's a strong chance we've got more upside over the coming weeks. Here's one of the biggest clues. When I zoomed into the daily chart, silver made a fresh low... but the silver miners didn't. Instead, they formed a double bottom. That's bullish divergence. It's a concept we teach in TEC101. The indices must confirm. You've just got to think about it logically. Silver miners are leveraged plays on the metal. If silver is making a fresh low, you'd normally expect the miners to make an even deeper low. But they didn't. Instead, they held their ground, formed a double bottom, and started putting in a higher low. That's often a sign buyers are quietly stepping in before the underlying asset turns. It's exactly the same clue I saw back in 2022 when I called the gold low around US$1,600. Gold made a new low, but Northern Star didn't. It put in a higher low instead. This was just one of several pieces of confluence that gave me the confidence to go long. I've done a full breakdown inside the free Academy, showing every chart, every level, and the complete thought process behind the trade, plus why I believe precious metals could still have several more weeks of upside. academy.masteringthemarkets.com/c/mtm-educator… I'll also post the 2022 Northern Star vs gold chart below so you can compare the two setups side by side.
David Bird (ASX Trader) B.Ed, CFTe tweet media
English
10
7
99
9.2K
David Bird (ASX Trader) B.Ed, CFTe
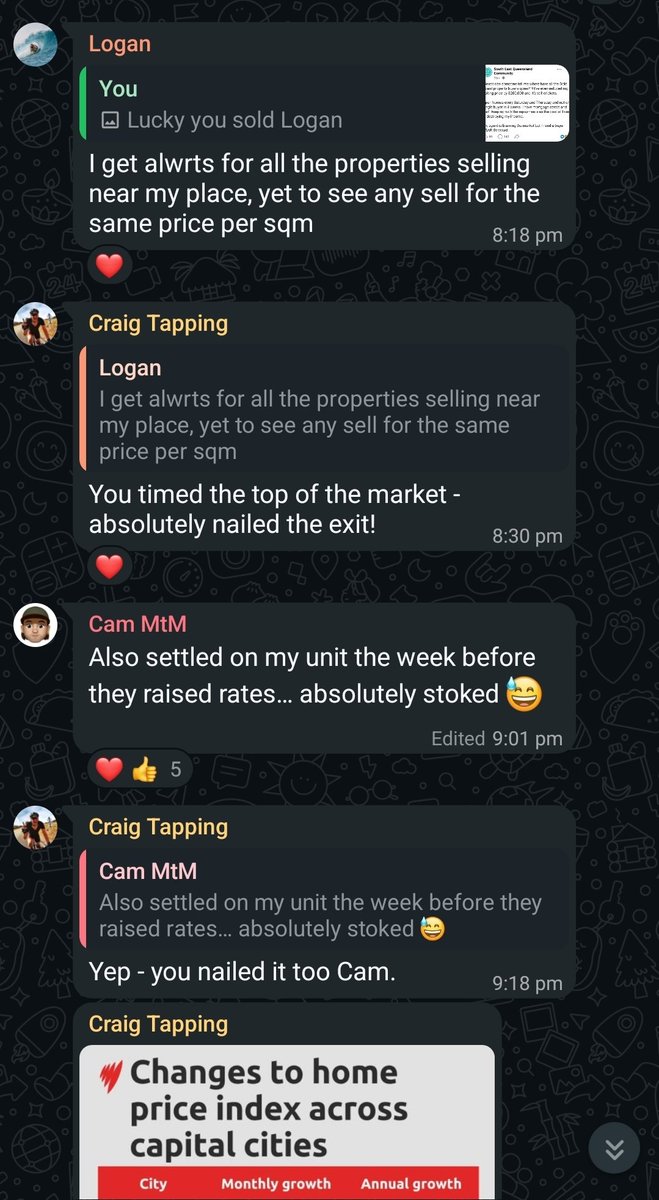
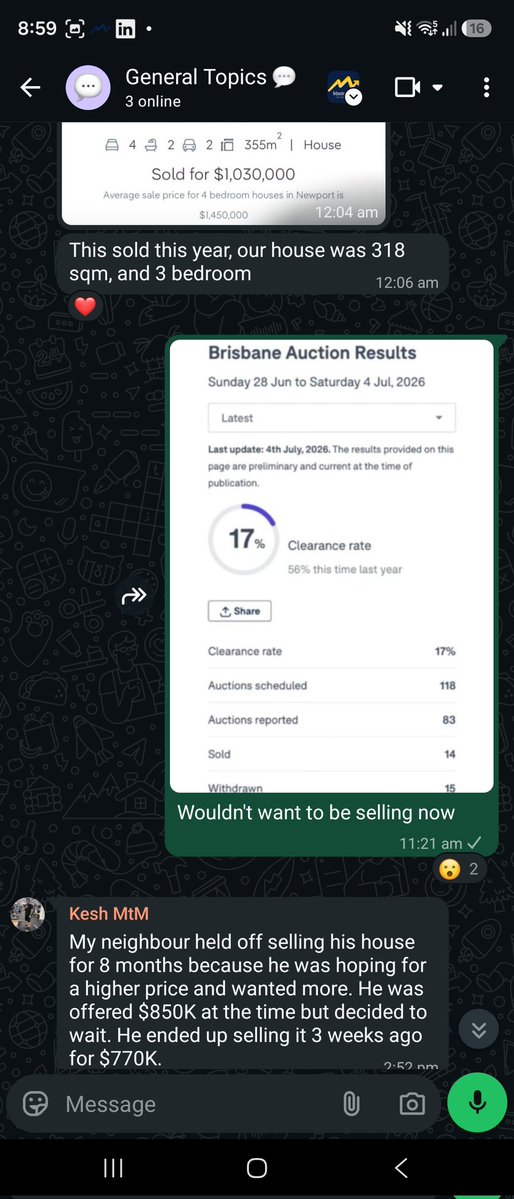
What can one property sale teach us about market cycles and psychology? There's a lot of noise in the property market right now. Rather than listening to opinions, I'd rather look at real data. Let me show you a real-life case study from one of our own MtM staff members. In 2020, Logan bought land for $289,900, built a home, and was all in for around $510,000. He also received the $40,000 government building grant. Towards the end of last year, after studying market cycles and following the data, he made the decision to sell. Not because we told him to. We don't tell people what to buy or sell in any asset class. We teach market cycles, market structure, sentiment, liquidity and risk management so people can make informed decisions for themselves. Five years later, he sold the property for $1.2 million, making around $770,000 in profit. The return is impressive, but that's not the real lesson. Over the past 12 months, Logan has continued tracking that exact market. Comparable homes in the same suburb, including properties larger than the one he sold, are now selling for around $200,000 less than the price he achieved. It's not just this one example. Does that mean every property is falling? Of course not. Real estate is a local market and there will always be suburbs that outperform. But the broader environment has changed. Buyer demand has softened in many areas, properties are taking longer to sell, vendors are reducing asking prices more frequently, and price expectations have adjusted. One decision has put Logan in an incredible financial position. At just 30 years old, he's sitting on around three quarters of a million dollars in cash from one well-timed investment. For long-term investors who weren't planning to sell, none of this should matter. But if you were planning to sell, upgrade, downsize, or were over-leveraged, timing mattered. Understanding market cycles and acting on them are two completely different things. Some people can see the signs. Very few have the confidence to act. That was me in 2017. I'd only been trading for a couple of years and could see the crypto market becoming extended. Instead of trusting my own analysis, I listened to YouTube, social media and everyone telling me the bull market would continue. I gave back hundreds of thousands of dollars in profits because I didn't trust myself. That became one of the biggest lessons of my career. Today, when the data lines up and public sentiment becomes overwhelmingly one-sided, I pay close attention. That's exactly what I believed we were seeing in property towards the end of last year. In financial markets, institutions sell into strength because that's when liquidity is highest. Property is even less liquid than shares, so timing matters even more. If you want premium prices, you need buyers. Smart money sells when demand is strongest, not when everyone agrees the market has peaked. Markets rarely feel obvious at turning points. The goal isn't to predict the future with certainty. It's to understand probabilities, manage risk, and make decisions based on evidence instead of emotion. That's what education should do. Not create followers. Create independent thinkers who have the confidence to make their own decisions when it matters most.
David Bird (ASX Trader) B.Ed, CFTe tweet mediaDavid Bird (ASX Trader) B.Ed, CFTe tweet mediaDavid Bird (ASX Trader) B.Ed, CFTe tweet media
English
2
2
56
6.2K
David Bird (ASX Trader) B.Ed, CFTe retweetledi
The Courier-Mail
The Courier-Mail@couriermail·
Long-term charts are flashing a signal so rare it has only appeared a handful of times in the past decade — and every time a major market turning point followed. Find out more with ASX Trader: bit.ly/4bu50Yb
The Courier-Mail tweet media
English
0
1
5
2.2K
Alvin
Alvin@Speculator_186·
@ASX__Trader Woodside and natural gas look intresting too
English
1
0
4
267
Trendzz1
Trendzz1@liarliar__1·
@ASX__Trader How do you feel about silver bullion as part of an SMSF?
English
1
0
0
321
Dollar Bill
Dollar Bill@billfromaxecap·
@ASX__Trader Fascinating to see how trending influences people's beliefs. Seen so many reposts of this and it's fake.
English
1
0
1
131
Scott Dalton
Scott Dalton@2xsdalton·
@ASX__Trader Gold Coast is a boom bust town. Nearly 20 years in commercial property there. I recall struggling to sell industrial land in Arundel after the GFC for $300-$400/sqm. When l left the industry in 2025, the same land was trading in the $1500’s/sqm. And the cycle repeats.
English
1
1
11
725
zoppa
zoppa@ZoppaRako·
@ASX__Trader This is govt propaganda aimed at the young voters who are frothing at the mouth at the thought that property prices have dropped 200k (they haven't)
English
7
0
37
3.9K