Adrian Wu
19.8K posts


Adrian Wu
@AdrianXBT_
Venture Scout & Talent Lead https://t.co/sc0MCwiqMG (@shape3vc) Finding founders, deals & killers Web3 - DeFi - Infra | ex research at @mventureslabs (APAC)


🚨🇮🇱 A Mossad tiny team slipped into Tehran, cracked a secret warehouse, and stole Iran’s ENTIRE nuclear archive. They claim 100,000+ documents proving their secret bomb program. Half a ton of smoking gun. Right under their noses. Source: Call me Back Podcast YT
🇺🇸🇮🇷 If you thought Trump couldn't possibly wreck the global economy much more, think again. He just doubled down on CENTCOM's announcement: Iranian ports will be blockaded starting today at 10am ET. No doubt when this is all over, he'll take responsibility for fixing the economy.

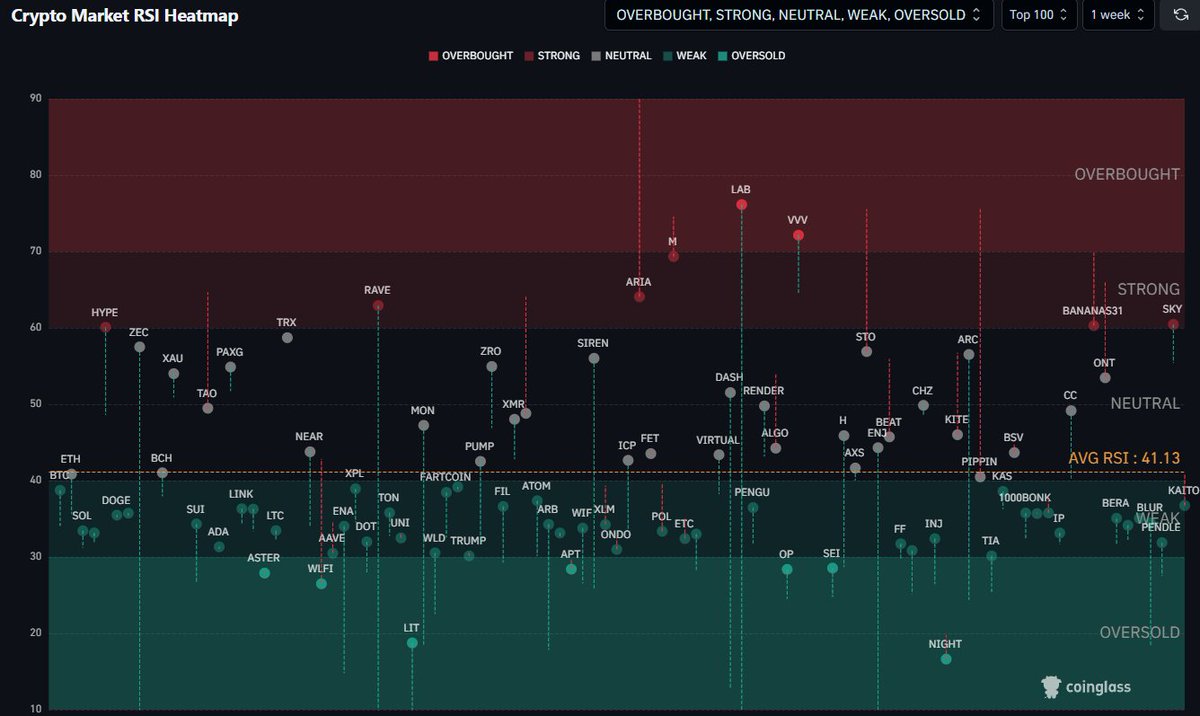


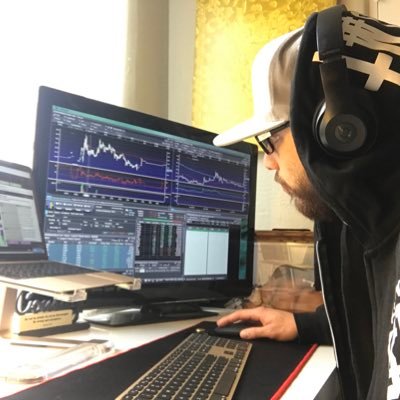
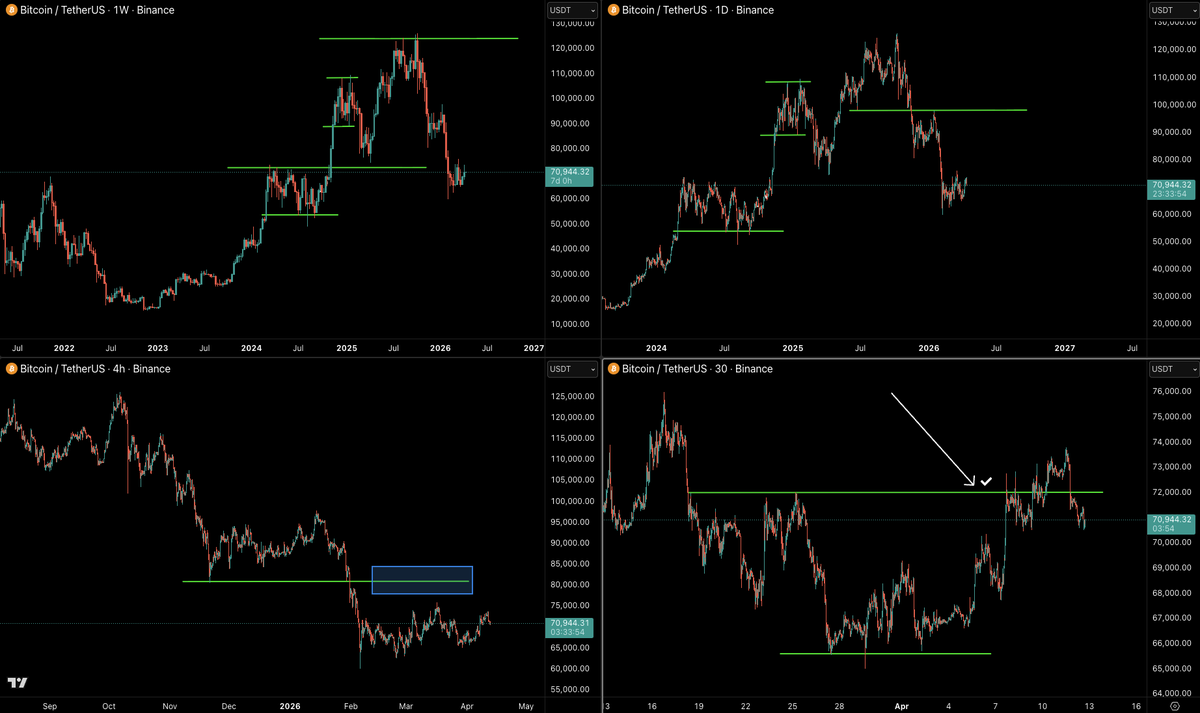
How I Read a Chart in 60 Seconds. Most traders open a chart and immediately start drawing lines. Trendlines, fibs, indicators stacked on indicators. No structure. No process. Just visual noise. This educational post is sponsored by @_WOO_X, where I trade crypto with zero fees on spot. I have been doing this for years. When I open a chart cold — no context, no bias, nothing — I know what I'm looking at within 60 seconds. Not because I'm fast. Because I follow the same 5 steps every single time. Here they are. STEP 1 — HTF Structure First (Weekly / Daily) Before anything else, I zoom out. Weekly or Daily chart. Clean. No indicators yet. I'm asking one question: what is the trend? Higher highs and higher lows? Bullish structure. Lower highs and lower lows? Bearish structure. Neither? Then we're in a range — and that changes everything. If it's trending, I want to know where we are in that trend. Are we near a key support? Pushing into resistance? Mid-leg with no reference points? If it's ranging, I define the boundaries first. Where is the range high? Where is the range low? Because in a range, the strategy flips completely — you're not chasing breakouts, you're fading extremes and waiting for deviation. This step takes 10 seconds. And it eliminates 80% of bad trades before they start. STEP 2 — Key Levels + Liquidity Now I mark levels. But here's the rule: 2 or 3 levels maximum. Not 15. I want the levels where price has reacted multiple times. The ones that are obvious. If you have to squint to see whether it's a level — it's not a level. Then I look at liquidity. Where are the equal highs? Where are the equal lows? Where are the stop clusters likely sitting? Liquidity is the fuel. Price needs it to move. If there's a pool of liquidity sitting above a range high, I know price is likely going to hunt it before reversing. If there are clean equal lows below support, the market will sweep them. This is not about drawing every level you can find. It's about identifying the 2-3 zones where the real action will happen — and understanding where the liquidity traps are. STEP 3 — Market Phase Now I identify the phase. Every market is always in one of four phases: 1. Accumulation — price is basing after a downtrend. Low volatility, tight range, smart money is loading. 2. Markup — the trend begins. Higher highs, higher lows. This is where most of the easy money is made. 3. Distribution — price is topping after an uptrend. Same low volatility and tightness as accumulation, but at the top. 4. Markdown — the downtrend. Lower highs, lower lows. Exits and shorts. Why does this matter? Because the phase tells you what kind of trade to look for. In accumulation, you're looking for breakout entries. In markup, you're riding the trend on pullbacks. In distribution, you're tightening stops and watching for structure breaks. In markdown, you're either short or on the sideline. If you don't know the phase, you don't know what you're trading. You're just reacting. STEP 4 — LTF Confirmation (4H / 1H) Only now do I zoom in. 4-hour or 1-hour chart. I'm looking for three things: Does the lower timeframe structure agree with my HTF bias? If I'm bullish on the daily, I want to see bullish structure forming on the 4H. Moving averages — are they aligned with my bias? If price is above the 200 EMA/MA on the 4H and both are sloping up, that confirms the bullish read. If they're flat or crossing down while I'm trying to go long, something doesn't fit. RSI — I'm not trading RSI signals. I'm checking for divergence. If price is making a new high on the daily but RSI on the 4H is making a lower high, that's a warning. If price is pushing up and RSI confirms, that's clean. Here's the most important rule of this step: if the LTF disagrees with the HTF, there is no trade. I don't force it. I don't talk myself into it. I wait. The next setup is always around the corner. STEP 5 — Bias in One Sentence After those four steps — 60 seconds total — I should be able to say one sentence: "I'm bullish above X, bearish below Y, and right now price is doing Z." That's it. That's the whole read. If I can say that sentence clearly, I have a bias. I have a framework. I have a plan. Now I can look for entries. If I can't say that sentence — if it feels forced, if I'm unsure, if the data conflicts — then I don't have a read. And that's fine. I close the chart and move to the next one. There are hundreds of charts. Not every one needs to be traded. The discipline to say "I don't have a read" is worth more than any setup. What NOT to Do. Don't start on the 5-minute chart. Ever. The 5-minute chart without context is pure noise. It will give you a bias that contradicts the higher timeframe and you'll lose money following it. Don't draw 15 levels and call it "analysis." If your chart looks like a colouring book, you have too many lines. You don't need more levels — you need fewer, better ones. Don't force a bias because you want a trade. Wanting to trade is not a reason to trade. If the chart doesn't speak to you in 60 seconds, it has nothing to say right now. Don't skip HTF because "it looks good on the 1H." The 1H can look perfect and still be sitting right under daily resistance with bearish divergence on the weekly. Context kills bad trades before they happen. Don't make it complicated. Five steps. Same order. Every chart. Every time. The process is the edge. It's not the indicator. It's not the pattern. It's not the setup. It's the process you follow before you even consider clicking buy or sell. Same steps. Every chart. Every time. No shortcuts. Trade spot with zero fees on WOO X Pro: wooxpro.com/en-US/invite/P…
