Sabitlenmiş Tweet

Nandish
3.1K posts

@Aendryr
Growth focused trend trader. Techno-fundamentalist. Buy high, sell higher. No investment advice given.

@ohiain My question is, when it pulls back, for how long does it need to hold the support? Sometimes it just spends a few days around the key moving averages and takes off again, sometimes weeks. It's very hard time the entry right and this is where I always get confused.


It took me years to understand that some of the best opportunities show up when multiple timeframes start telling the same story. A setup immediately gets my attention when a leading stock starts tightening up around the daily 50EMA while simultaneously sitting on the weekly 9EMA. That area tends to attract a lot of eyes from trend followers & swing traders to larger institutions, all evaluating risk around the same spot. When relative strength remains constructive, volatility starts contracting, and buyers continue defending that confluence of support...that's usually my cue to zoom into the smaller TFs and pay very close attention. I just need to recognize that the stock is building pressure, building up the right side, and if expansion comes, the risk/reward can become very attractive. This is something I pay attention to.

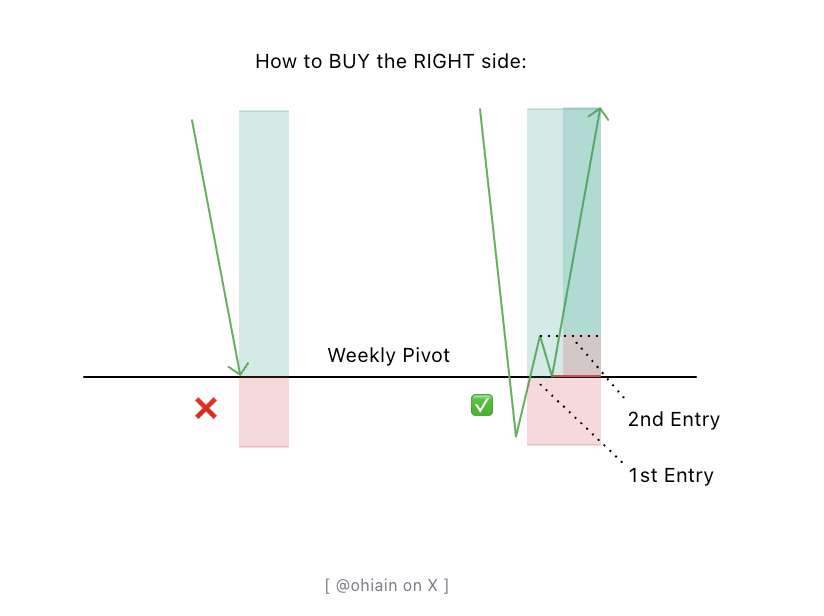
Trading clicked for me when I stopped trying to buy the exact bottom & started FOCUSING on "buying the right side of the move." Want better entries? STOP trying to catch the low. This is how I consistently find asymmetric entries in leading stocks: When I first started, I thought the best traders were the ones catching every low tick perfectly. The reality is that trying to time bottoms is incredibly difficult because when a stock is flushing lower, nobody actually knows where it's going to stop. What I've learned is that I don't need to be the first buyer. I just need to participate when the odds start shifting back in my favor. That's why I love seeing sellers push a stock into a major pivot that I'm already interested in. Maybe it's the 9EMA, the 21EMA, a weekly high, a prior breakout level, or another area where institutions have previously shown demand. When price starts moving into those areas, I become interested...but I don't buy immediately. I simply wait. I want to see how price reacts once it gets there. The way I think about it is that the left side of the V is controlled by fear. People are selling because they're nervous, locking in profits, or reacting emotionally to the pullback. The right side of the V is where buyers start taking control again. That's where confidence begins returning to the stock...and you can visually see it! This is why I use 15 and 30minute pivots so heavily. Once price flushes into a key level, I start looking for signs that selling pressure is drying up. > Is the stock stabilizing? > Are buyers stepping in? > Is it holding the pivot? Once I see that process begin, I'll often use the 15 or 30minute pivot high as my trigger. At that point I'm no longer buying because I "hope" the stock bounces. I'm buying because buyers have already started proving they're willing to defend the area. This gives me extremely tight risk, with my invalidation pivot being LOD. Could I occasionally get a better entry trying to catch the exact low? duh, of course. But I'd much rather sacrifice a few percentage points of entry price in exchange for confirmation. The strongest trends don't care if you missed the first 1-2%. If the stock is truly a leader, there is usually plenty of opportunity ahead... That's why so many of my trades look the same. I identify leadership... 2) wait for controlled weakness into a major pivot. 3) watch sellers exhaust themselves. 4) then enter as momentum begins turning back up. It sounds simple, but that single adjustment changed everything for me because my goal isn't to buy the lowest price. My goal is to put myself in positions where I can define risk clearly and participate when the probabilities start leaning in my favor. I'd rather buy strength off weakness than weakness hoping for strength. My 2 cents.
@ohiain What makes a stock leader? Can you pls elaborate? I got into $DOCN too today due the structure


If there is no tightness, there is no trade for me! Multiple names gave actionable entries today right off support pivots... first compression, absorbed sellers, & built tension. This is EXACTLY the type of behavior I look for every single day. Chart: $AMZN, $FLNC, $MRAM & $BW.
@ohiain I think what I struggle with is selecting the right stocks to do this with. Seeing setups everywhere. I wish I could find a little more focus, confidence, and conviction.
@ohiain How u decide if the stock is a leader or not, please share
I used to pick perfect chart patterns in dying sectors and wonder why they never moved, until I learned to follow the money first. I used to pick stocks in a vacuum. I'd find a beautiful chart pattern, enter with confidence, and watch it go nowhere while stocks in another sector ripped 20%. That changed when I started treating sector rotation as my primary filter. Here's a simple process you can follow: Every Sunday, I review the eleven sector ETFs. $XLK, $XLF, $XLE, $XLV, $XLY, $XLP, $XLI, $XLC, $XLRE, $XLB, and $XLU. I'm looking at their weekly charts to see which sectors are absorbing capital and which are bleeding it. I rank them by relative strength against $SPY and $QQQ over the past 4 and 12 weeks. The top three get my attention. The bottom three get blacklisted. I don't care how pretty an individual stock looks if its sector is getting sold. Then I drill down to individual stocks within the leading sectors. This is where stage analysis becomes a piece to the puzzle. I'm hunting for stocks/sectors that have built large, multi month/year stage 1 bases... those long, choppy consolidations where a stock goes sideways after a prior move. The longer the base, the bigger the potential move when it breaks out. I want to see multiple weeks built out on the weekly chart... but a great weekly base isn't enough. I rotate down to the daily timeframe to assess if the risk/reward is actually there. Is the stock coiling tight? Are the daily candles contracting in range? Is it riding along a rising 9/21 or 50EMA? I'm looking for asymmetric setups where I can risk little to make 5-10x my risk. If the daily is too loose or choppy, I pass, even if the weekly looks perfect. I also watch for the rotation warning signs. When a leading sector starts making lower highs, or when its top holdings begin breaking support levels, I tighten stops and reduce exposure, because sector leadership doesn't last forever. For example, within the recent months Technology led, then money rotated into financials and industrials. The edge is to simply trade with the current, not against it. When a sector has institutional money pouring in, individual stocks within it get lifted. Your mediocre setup in a hot sector will outperform a perfect setup in a weak one. With this method, I'm no longer fighting the market's underlying currents. I'm identifying where capital is flowing, finding stocks with big bases within those leading sectors, and waiting for the daily chart to tighten up before entry. Keepin' it simple and repeatable!