AnyChart

7.6K posts

AnyChart banner
AnyChart

AnyChart

@AnyChart

Cross-Platform Data Visualization Tools 📊 JavaScript charts 📈 Qlik extensions ➕ more for #DataViz and #Analytics ✨ #qlik #javascript #frontend #webdev

Katılım Nisan 2009
3.2K Takip Edilen6.4K Takipçiler
Sabitlenmiş Tweet
AnyChart
AnyChart@AnyChart·
Excel is still a daily tool for analysis. 
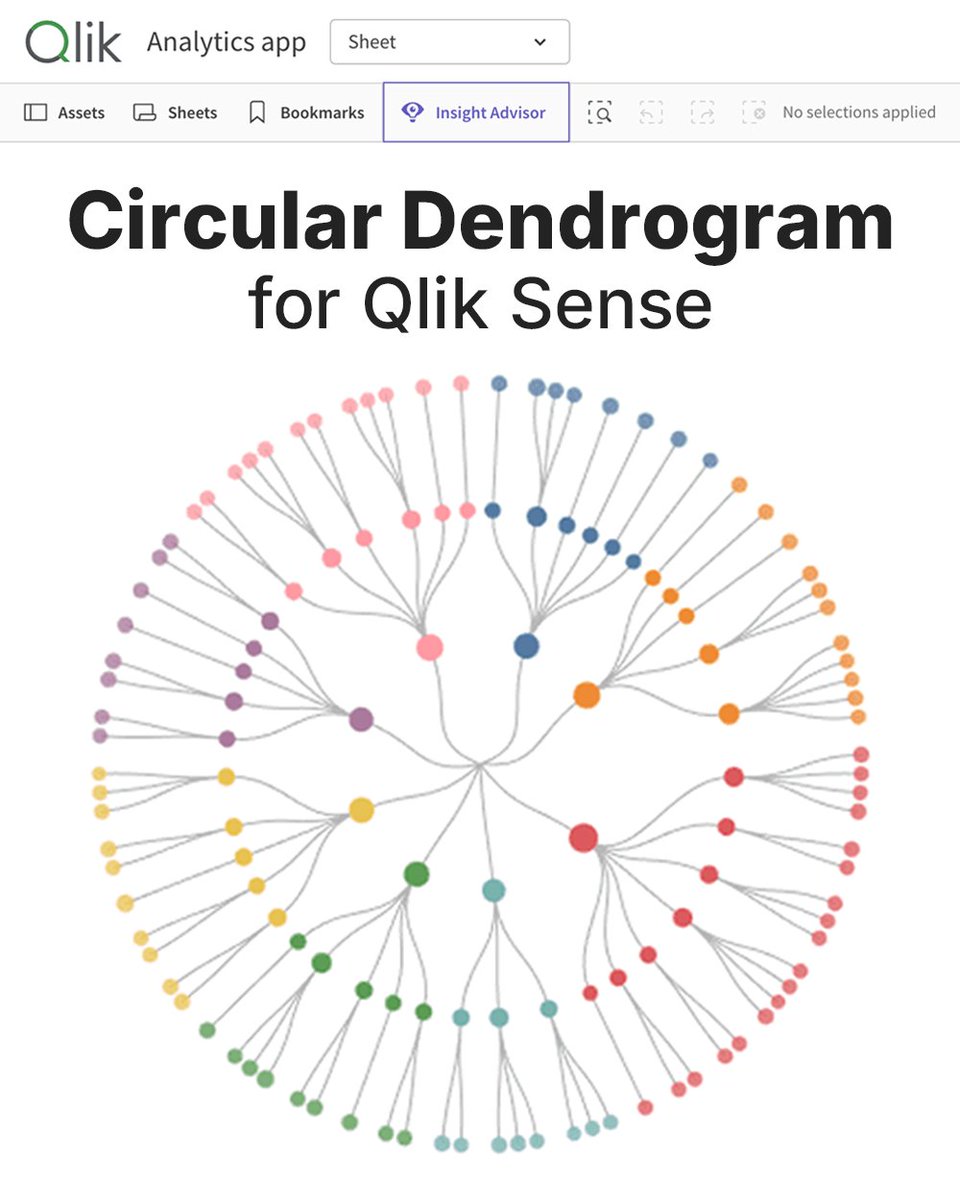
Qlik Sense is built for governed analytics. 📝 We published a comprehensive guide to using both, and when each approach makes sense: → Exports & imports → Automation → Live connections → Embedded spreadsheets Read it on our blog.
AnyChart tweet media
English
1
1
3
298
AnyChart
AnyChart@AnyChart·
Qlik didn't have it. We built it for Qlik. Just released the Circular Dendrogram extension for Qlik Sense — a radial tree for org charts, product taxonomies, account hierarchies, file structures, and other nested data. Learn more and check it out: qlik.anychart.com/news/circular-…
AnyChart tweet media
English
0
0
1
65
AnyChart
AnyChart@AnyChart·
A data map turns location into a variable. Patterns start to show across space. The new #DataViz Weekly leans spatial, showing what maps can add when data has a geographic side: 📍 146M U.S. jobs 📍 Sahel violence 📍 Rio's sister cities 📍 Smoking endgame anychart.com/blog/2026/05/2…
AnyChart tweet media
English
0
1
9
1.4K
AnyChart
AnyChart@AnyChart·
Most line charts smooth between data points. A step line chart doesn't. That's the whole point. Our new JavaScript charting tutorial: build one with 10 years of real Fed rate data. Every hike, every cut, every flat stretch in between → anychart.com/blog/2026/05/1…
AnyChart tweet media
English
0
0
1
114
AnyChart
AnyChart@AnyChart·
Data carries the facts. A good chart unlocks the meaning 📈 Fresh examples that pulled us in lately and we believe will do the same for you: ▸ Polymarket winners/losers ▸ English similes ▸ Big Tech lobby in 🇩🇪 ▸ Global progress New #DataViz Weekly ↴ anychart.com/blog/2026/05/1…
AnyChart tweet media
English
1
0
2
101
AnyChart
AnyChart@AnyChart·
DataViz Weekly 📊 is back with another batch of great examples showing how visualization puts data to work: 🌟 Rise of AI-generated content 🌟 Divorce rates by job 🌟 Global press freedom at a 25-year low 🌟 Pet boom in Italy New roundup on our blog: anychart.com/blog/2026/05/0…
AnyChart tweet media
English
0
0
2
135
AnyChart
AnyChart@AnyChart·
New #DataViz Weekly is out, curating four fresh data visualization projects worth your time if charts and maps are your thing 📊 ✦ British voter intent by demographic ✦ U.S. power grid under strain ✦ Iceberg A23a disappearing ✦ Music industry in 2025 anychart.com/blog/2026/05/0…
AnyChart tweet media
English
1
0
2
123
AnyChart
AnyChart@AnyChart·
80+ years of U.S. presidential approval data (Gallup). Visualized as a vertical area chart in #JavaScript. Our new tutorial shows how to build it: → Mirrored areas → Smooth spline curves → Date/time scale → Highlighted zero baseline → Custom tooltip anychart.com/blog/2026/04/0…
AnyChart tweet media
English
0
1
1
215
AnyChart
AnyChart@AnyChart·
Here's the new edition of DataViz Weekly: anychart.com/blog/2026/04/2… Made or found a cool map or chart? 💬 Ping us, and it may end up featured next time.
English
1
0
1
53
AnyChart
AnyChart@AnyChart·
Love good charts and maps? 👀 Welcome to #DataViz Weekly, putting a spotlight on notable data visualizations as they come out. Made the cut this time: 📌 Tehran strike damage by land use 📌 Population change in Europe 📌 Job stability by occupation 📌 Buildings by road proximity
AnyChart tweet media
English
1
0
2
98
AnyChart
AnyChart@AnyChart·
Seen a data visualization worth sharing, or built one yourself? Let us know, and we may feature it next time.
English
0
0
0
66
AnyChart
AnyChart@AnyChart·
Visualization helps data say more 📈 New DataViz Weekly is out with fresh picks showing how charts & maps can make complex subjects easier to understand: 🔸 Causes of death 🔸 Cuba's oil crisis 🔸 Family business succession wave 🔸 3 years of war in Sudan anychart.com/blog/2026/04/1…
AnyChart tweet media
English
1
0
1
147
AnyChart
AnyChart@AnyChart·
Data rarely speaks for itself. 📈 Give it the right visual & it does. Good data graphics keep turning up, and we never stop looking. New DataViz Weekly's out, featuring: 📍 Early spring in 🇺🇸 📍 DC cherry blossom 📍 Orbital crowds 📍 Buildings by age in 🇳🇱 anychart.com/blog/2026/04/1…
AnyChart tweet media
English
0
1
2
124
AnyChart
AnyChart@AnyChart·
The world keeps shifting. Data tracks where. Visuals help it land 📊 Fresh examples worth a look: ◆ China's rise in AI talent ◆ Shadow fleet & Iran war ◆ Vietnam's rise in U.S. electronics ◆ Food self-sufficiency by country See the new #DataViz Weekly: anychart.com/blog/2026/04/0…
AnyChart tweet media
English
0
0
1
163
AnyChart
AnyChart@AnyChart·
Data has stories to tell. Visualization helps them reach us 📈 Continuing #DataViz Weekly with a spotlight on 4 compelling new examples: 📌 Hormuz oil & gas flows 📌 Rural hospital crisis 📌 ICE arrests of parents of U.S. citizen children 📌 State-to-state migration flows
AnyChart tweet media
English
1
0
3
111
AnyChart retweetledi
David J Phillips
David J Phillips@davj·
"Make no mistakes DO NOT HALLUCINATE. YOU ARE AN EXPERT SOFTWARE ENGINEER"
English
188
2.1K
24.2K
1.4M