
ramrockzz
47 posts

ramrockzz retweetledi

#OperationSindoor on the games field.
Outcome is the same - India wins!
Congrats to our cricketers.
English
ramrockzz retweetledi

THE SILVER MEDALIST AT WORLD C'SHIP 🥈
- India's Rakesh Kumar 🇮🇳❤️

English
ramrockzz retweetledi
These things make you fall in love with Sport 🫶
- Paris Paralympics & World Champion Oznur Cure holding the medal for new World Champion Sheetal Devi, and the group hug at the end! ❤️
Pure Goosebumps! 🥺

English
ramrockzz retweetledi

World Champion - the world title is ours. With all my heart, for my country. ♥️🇮🇳🏹


English
@reliancejio @JioCare the quality of network has been getting deteriorated by day for both jiofiber and mobile network.
English
ramrockzz retweetledi

Lots of news of the scarcity of water flowing in at IT and Intellectual capital, Bengaluru of India. Do you know why Bengaluru has such a situation?
Is there a solution?
Yes, there are many. Large complexes need multiple sources of water, an infrastructure to support it, a culture of saving water and ensure accountability for using water.
Do you know that one large apartment complex has successfully implemented these solutions and has sufficient water despite the crisis?
Check out their case study and take steps to ensure water continuity throughout the year.
Read more here: vicharpravah.com/water-scarcity…
#WaterScarcity #Infrastructure #WaterConservation #borewell #STP #RWH #Bengaluru #India
English
ramrockzz retweetledi

Sectoral Masterclass-Episode 1
As we start a masterclass in sectoral analysis
NIM,NII,Gross NPAs,Net NPAs
So many terminologies in Banking!🤯
Confused?😥
How to objectively analyze a Bank?
Don't worry!
A comprehensive thread🧵on how to objectively analyze a Lender?
Lets go👇

English
ramrockzz retweetledi

Lets understand ROCE, ROE, D/E and few other metrics by a very simple example.
Ramu sells Vadapav.
He started a biz with 2Lac. Thats equity.
To grow the business he took loan of 1 Lac. For buying equipment and Land.
So the total capital in the business is 3 Lac rupees.
1/15
English
ramrockzz retweetledi
Simplifying Health Insurance from the scratch!
The cost of hospital bills are sky rocketing. This will protect you from financial ruin.
- A Thread 🧵–
English
ramrockzz retweetledi
Infosys took big advantage of the IT Boom in 2000s
Pharma outsourcing is an emerging trend
Syngene is taking big advantage of this trend
The company reported its results yesterday & the stock has tanked
A thread🧵on the business of Syngene & the opportunities ahead
Lets go👇

English
ramrockzz retweetledi

Everyone dreams of buying a STOCK at the BOTTOM and sell it at the TOP to get MAX PROFIT.
It looks IMPOSSIBLE, but it can be done using RSI Divergence Strategy.
A detailed thread🧵 on how to use RSI Divergence Strategy in Trading:

English
ramrockzz retweetledi

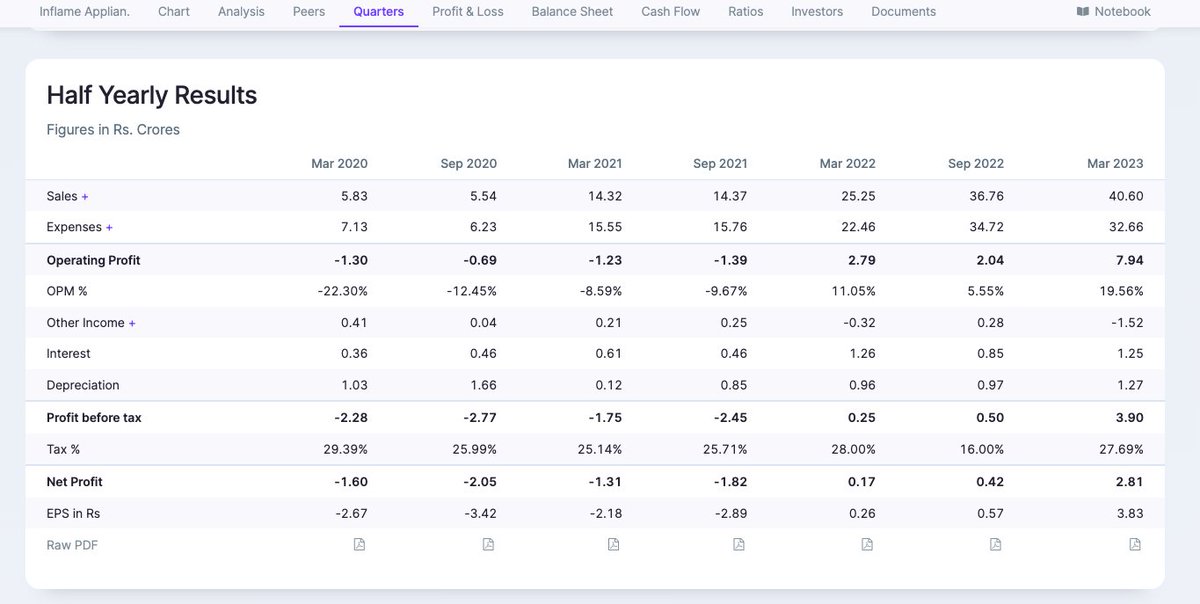
Result of the day - Inflame Appliances Q4
40 Cr Revenue - 8 Cr EBITDA (20% Margins)
Adjusting exceptional loss - PBT of 5.5 Cr 👌
Hats off to the conviction of @GunavanthVaid sir, a lot more to learn 🙏
English
ramrockzz retweetledi
SKP Bearing : another interesting microcap
Dividend of INR 1 per share
FY23 PAT 13.25 Cr on 48.76 Cr Sales ~ 27% Net Margin👌
FY23 EBITDA 19.33 Cr ~ 39.6% Operating Margins
Trading at 17x EV/EBITDA & 24.6x FY23 EPS
D - No reco. ; studying about it currently

English
ramrockzz retweetledi

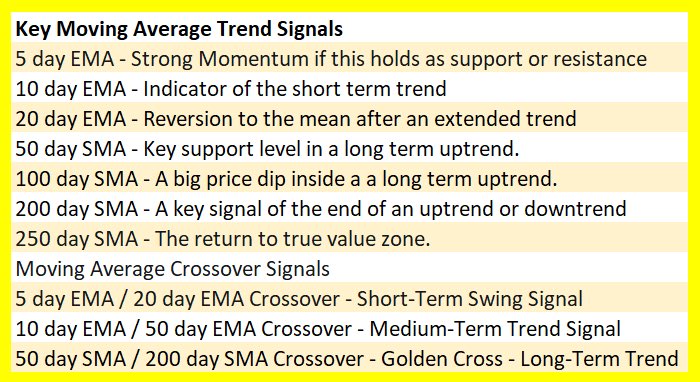
Moving Averages Cheat Sheet:
Moving averages can be used as trend and swing trading tools in technical analysis. They quantify the direction and momentum of existing price moves on a chart. They can show trends and swings in price through their confluence of incline or decline in relation to price.
Moving averages filter for market sentiment in different time frames when price remains above one for multiple days. With the ribbon you can see the momentum and trend direction of price action by how many moving averages price is above on the chart.
My strategies are built from these moving averages.
5 day exponential moving average – Momentum
10 day exponential moving average – Short term trend
20 day exponential moving average – Reversion to the mean
30 day exponential moving average – Swing Filter
50 day exponential moving average – Pullback in an uptrend
Price becomes bullish in the timeframes of the moving averages it stays above.
The more moving averages price remains above the more bullish the chart is.
Here are exponential moving average crossover signals that can occur inside the Ribbon that can signal a bullish entry on a chart in a long term uptrend. When the short term moving average crosses and closes over the long term moving average that is the entry signal.
5 day / 20 day ema crossover: Flying Eagle crossover
5 day / 30 day ema crossover: Flying Falcon Crossover
10 day / 30 day ema crossover: Flying Squirrel Crossover
10 day / 50 day ema crossover: Flying Dragon Crossover
The more crossover signals that a chart has at one time the more bullish it is.
If a trend starts running a profit target could be set near the 70 RSI zone.
A stop loss should be placed after entry based on personal risk tolerance:
•A stop loss could be placed on a percentage drop of price.
•A stop loss could be set if price falls below the short term moving average in the crossover.
•A stop loss could be set if price falls below both moving averages used in the crossover.
A trailing stop should be used on winning trades based on open profit risk parameters.
•For swing traders a trailing stop could be set at a loss of the short term moving average.
•For momentum traders a trailing stop could be a loss of the previous day’s low.
•For a trend trader a winner could be held under the short term moving average crosses back under the longer term moving average.
These signals are built for charts in long term uptrends or tend to swing from highs to lows in price like stock index ETFs, market leaders, and leading growth stocks. These are not meant for markets that historically trade sideways or down in price. Also highly volatile charts tend to create too many false signals.
For a higher probability of success with signals they should all be backtested on your watchlist before using them in live trading.
While all backtests may not beat buy and hold on a chart most will have better risk adjusted returns by having lower drawdowns. The crossover signals can create positive expectancy models for trading by creating small losses and big wins based on the trade management using stop losses and trailing stops, that is where the real edge comes from in trading.
Here are moving average cross unders that can signal a bearish entry on a chart in a long term downtrend. These can be used to go to cash, or signals for short selling based on the long term chart trend.
5 day / 20 day ema cross under: Lame Duck cross under
10 day / 50 day ema cross under: Loch Ness Monster cross under.
The biggest enemy of moving averages is high volatility. Crossover signals help filter out most of the noise of volatility and show the trend.


English
ramrockzz retweetledi
Zim Laboratories : (CMP - 91 ; Market Cap - 450 Cr)
A very under-researched but very impressive Small Cap Pharma Company
R&D spend : 26Cr (FY23) ; 84 Cr in last 4 years
PAT : 24 Cr (FY23) ; 49 Cr in last 4 years (cumulative)
🧵A Thread 🧵

English
ramrockzz retweetledi

What are the different types of Capex a company does and how to judge the outcomes probabilistically?
1. Capital Expenditure is the type of expenditure any business or organisation does to add more fixed assets or plants and machinery. A simple example is, one factory owner deciding to put another factory with more machines. This we can classify as growth capex.
2. There is another type of Capex as well, where companies have replace existing machinery or where companies replace the worn out equipment. This is known as Maintenance Capex.
3. When it comes to Growth Capex- there are 3 types which we must understand with multiple examples.
A) First type of Growth Capex is known as Green Field Capex. Where you set up a project from scratch. Now, since you are doing the capex for the First time on a piece of land. A lot of money will also get spent on basic utilities. Thus, your asset turns will always be low in a Greenfield investment. For eg:- Rainbow Children Hospital announced a Greenfield Capex at Gurgaon. Now given its a Greenfield capex in a hospital business it will take atleast 5-7 years to break even.
Another example of Greenfield Investment is what SRF did in 2010 after Acquiring 293 acres of land at Dahej. They initially announced a 1000 crore Capex.
Any capex done from scratch:- known as Greenfield capex. It is much more time consuming.
B) Second type of Capex is known as a Brownfield Capex. Where once your basic utilities and facility is in place. You can simply expand on the same site. A wonderful example of this is Mold-Tek Packaging. Which mentioned in its recent concall, that Asset turns (how much sale can be generated from Rs1 of assets) are 1.5x in Greenfield investments and 2-2.5x in Brownfield. Unit level economics end up improving. SRF which bought a 293 acre land, over the years kept on doing capex at the same piece of land. Over time, the invested capital turnover from that land parcel has gone from 0.7x to 1.1x. Thereby, helping to improve Profitability of the chemical business. (Major role is by margins, read about Local economies of Scale).
It is less time consuming.
C) De-bottlenecking
This is a type of Capex where minor changes like changes in machine configuration, pin pointing the bottlenecks or Changing the workflow configuration (Think having a seperate warehouse). Can massively improve the Asset turns and Profitability of the business. For eg:- A company manufacturing Phenol in India is increasing its achievable capacity by 50% just by doing a capex of 100 crores. Original capex amount that was spent to set up the plant was 1400 crores. You will often find such terms in a manufacturing business. Another company into Amines business, just by small de-bottlenecking of 30 crores was able to generate incremental revenues of 450 crores!(15x). Whereas, original asset turns were 1.5x.
D) Non Revenue Generating Capex:-
I will further divide such capex into two parts:-
(i) Maintenance Capex:- This is the type of Capex that is done to replace the old machinery and to maintain the Fixed Assets. This is done to ensure that the business keeps functioning and old assets are replaced. One rule of thumb is to substitute Deprecation amount as the regular maintenance capex that is done every year. Earlier BKT Industries announced 350 crore as replacement or maintenance Capex at its old plant at Waluj (recently shelved)
Broad rule of thumb= Depreciation will be equal to Maintenance Capex. Sometimes managements in concalls or interviews give the exact Maintenance Capex numbers.
(ii) Capex done to ensure Business becomes more sustainable:-
Check the Falling Fixed Asset Turns of Aarti Industries:-
2018: 1.9x
2019: 1.94x
2020: 1.69x
2021: 1.25x (FY22, 23- Had termination income etc- tough to compare)
One of the reasons is that the Company did significant capex on Sustainability as well to make its plants ZLD, and more environmentally friendly.
4) How to check visibility revenue & competitive positioning while companies are incurring Capex spends?
A) Some companies by their nature of the business will do Capital Expenditure and the business will be done on a Spot Basis. Spot means- there are no confirmed buyers, you just go to the market and sell on the Spot. Generally, products which can be replicated or a bit commodity in nature. Such companies will end up doing Capex without confirmed commitments. Eg:- Deepak Nitrite's Phenol capex can be one such example. Another one is, Dynemic products ( A food cooler company). Which did massive Capital expenditure, and once capex was commercialised the demand softened+Raw Material prices increased. The company went under losses due to elevated depreciation & Interest cost. Spot Capex- For an investor judging the utilisation can be tricky. You really need to understand the companies market position & demand for the products along with the supply side scenario. If too much supply comes in and demand is soft. Even then the market goes through a downturn. Think about what happened with Transformer companies in 2011-2020. Too much supply and less demand for the products. Understanding Market supply & demand dynamics is really important in such companies. Gives opportunities to smart investors to do cyclical investing, and often many investors go wrong here as well. Recent cycle has been the Polypackaging one, where demand grows at X and Supply is going up by 3-4x in next 1 year. Companies are already in cash losses.
B) Confirmed Contracts Capex:- Think about few companies such as PI or NFL or Deccan etc. These companies are doing capex on the basis of long term confirmed contracts. Here the visibility becomes much higher, even analysts start baking that into their projections as revenue ramp up is usually given by companies in their concalls. Example from the past:- NFL did 400+ crores of capex for a Confirmed long term contract with Honeywell for their patented Ref gas. The moment capex was announced, PE got rerated as visibility for analyst community increases.
C) Capex with high visibility:-
One of the Coffee Companies in India has announced expansion of its Facility in Vietnam. This expansion comes on the backdrop of the fact that 50% of the expanded capacity is already booked out by a customer. It gives high degree of confidence to go ahead and do capex.
D) Capex for Stores:-
In retail businesses or QSR businesses. Companies like Titan, Westlife or Trent will give broad visions of setting up xxx number of stores. An easier way to understand the potential revenue generation will be:-
Multiply revenue per store that has been achieved*New number of stores that are being opened. Once these stores become fully mature, this will give you a rough idea on how much sales the company can generate once the stores are fully mature.
E) Capex done for Backwards integration:-
Companies that want to make their Raw Material in house will incur capex for backward Integration. Eg:- BKT Tyres doing capex for Carbon black which is a Key Raw Material.
Another example where things went South is:- Usha Martin setting up a steel plant to manufacture steel wires. Due to debt that was taken and inherent volatility in steel prices. The company went bankrupt and had to get its debt restructured+Ended up selling the steel plant. Backwards integration can cut both ways if not thought well by the Promoters.
F) Opex for Branches:- When Banks and NBFC's open significantly higher amount of branches. This spend is termed as OPEX or Operating expenditure. Once, higher number of branches are opened then in the near term Cost to income (how much rupees you are spending to earn) goes up. As new branches reach maturity, then AUM per branch and productivity per branch keeps improving. Over a period of time the Cost to income ratio falls. Think what is happening with HDFC Bank right now.
These are few musing on Capex :) There is much more that I want to write that will be a part of Upcoming Book on Basics of Fundamental Analysis in India🇮🇳🇮🇳
Hopefully you found value in reading this post. Thank you for your time.
Disclaimer: Nothing in this post is a buy or sell recommendation. Sole purpose is to share how to think about Capex with retail investors :)
English
ramrockzz retweetledi

10 Clever Personal Finance Rules that will help u save more.
1) Rule of 72
2) 100- Age Rule
3) 50-30-20 Rule
4) 1st Week Rule
5) 6X Emergency Fund
6) 20X Term insurance
7) 40% EMI Rule
8) 2X Savings Rule
9) 3*3*3 Plan
10) 25X Retirement Rule.
#PKBOLA Explains👇
1/12
English
ramrockzz retweetledi

Is US going to default because the CDS spreads have hit a record high?
This image is doing rounds. Not sure how many of us understand whats the Credit Default Swap (CDS) & CDS Spread, so a quick 🧵 (1/7)

English