Benedek Katona

198 posts

Benedek Katona banner
Benedek Katona

Benedek Katona

@Benedektrader

CEO of Full-Time Trader Academy Built one of Hungary’s largest trading communities Mentored 110+ funded traders managing over $15M in capital

Magyarország Katılım Haziran 2022
96 Takip Edilen182 Takipçiler
Sabitlenmiş Tweet
Benedek Katona
Benedek Katona@Benedektrader·
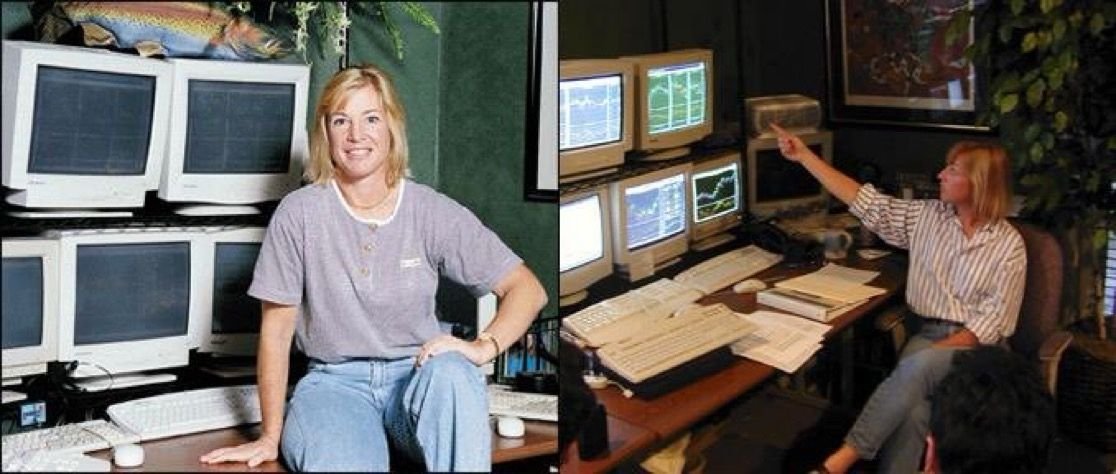
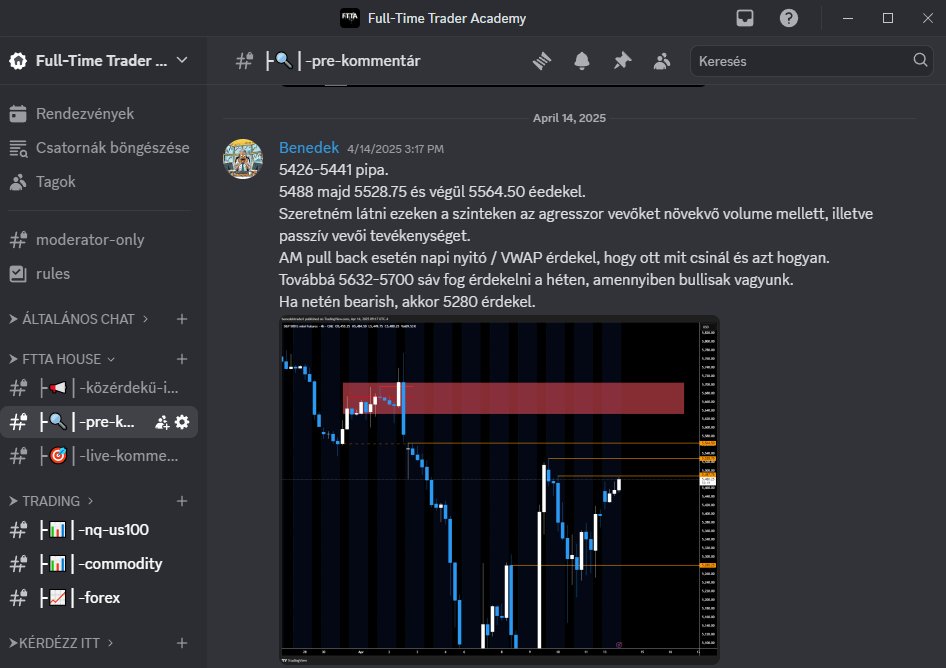
My name is Benedek, but in my country, most people know me as Benedektrader due to my work in trading. In Hungary, financial literacy is still 20-30 years behind, though younger generations are becoming more engaged with financial markets. However, despite this growing interest, there is no valuable, structured Hungarian-language education for those who want to learn real, applicable trading knowledge. I experienced this firsthand when I started trading in 2019. The only Hungarian resources available were basic retail concepts like indicators, support-resistance, and trendlines—concepts that fail to reveal the true mechanics of the market. Naturally, I suffered heavy losses early on and kept wondering: Why isn’t anything working? Is it just me? This led me to study English-language content, dive into Wall Street’s old-school trading methodologies, and explore SMC and ICT concepts, which brought me significant success. Yet, I still felt there was more behind the candlesticks than what any mentor was teaching. 
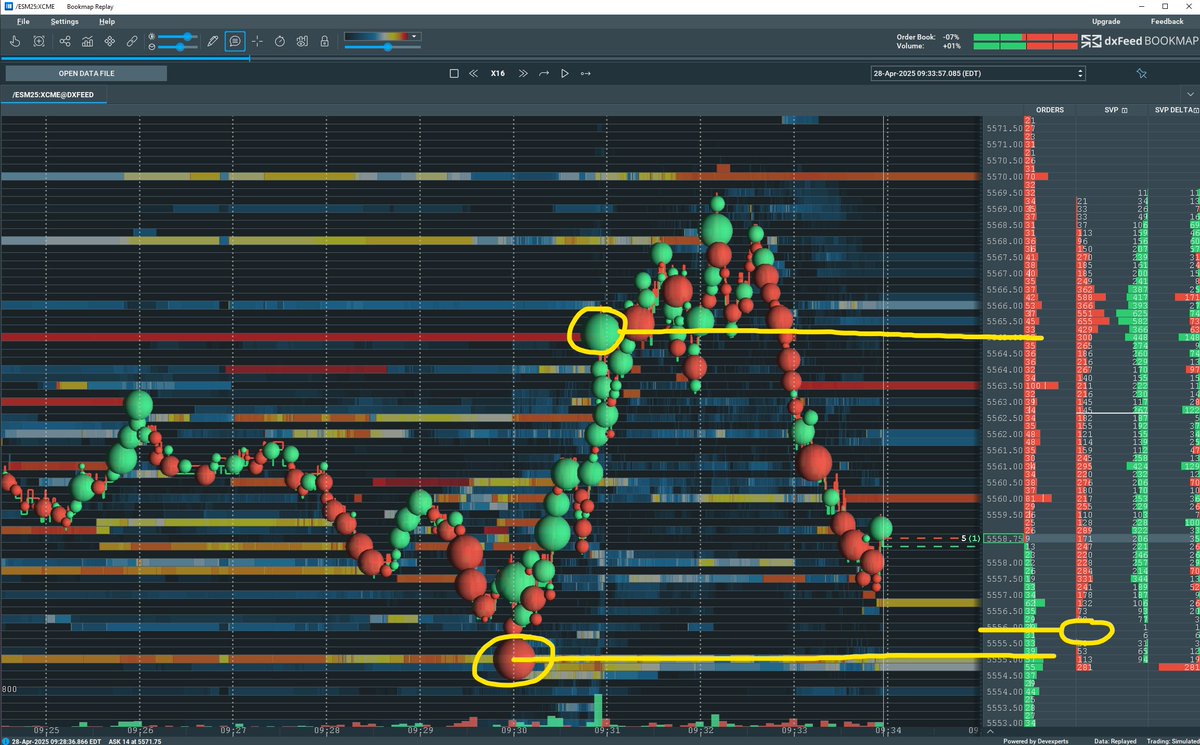
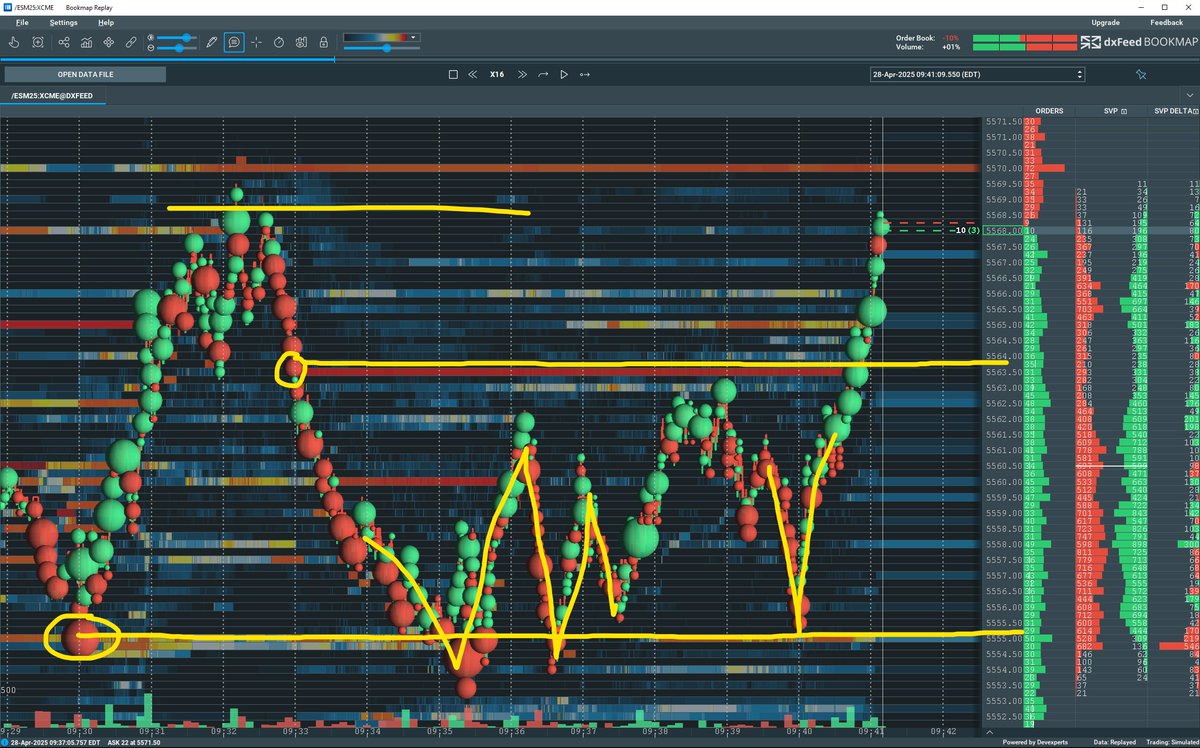
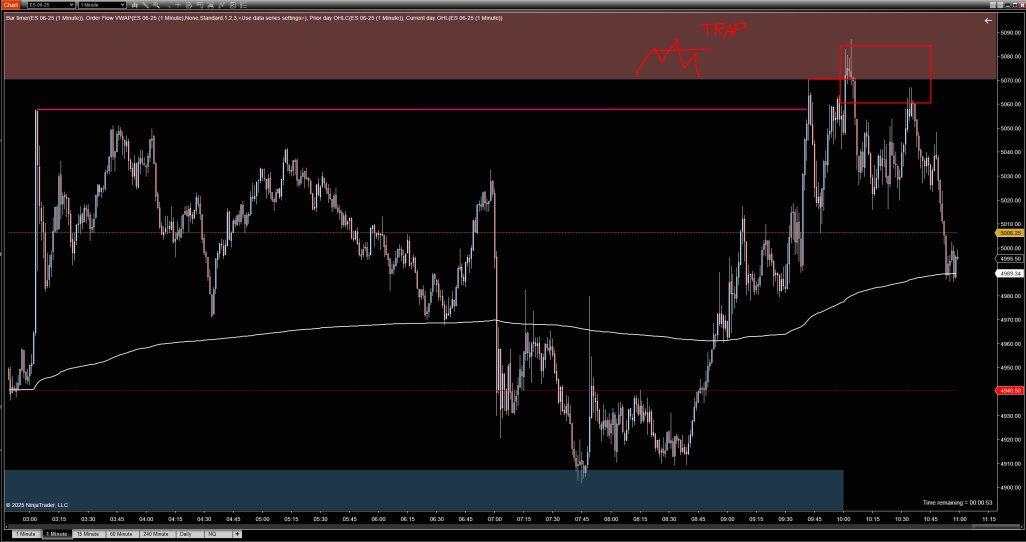
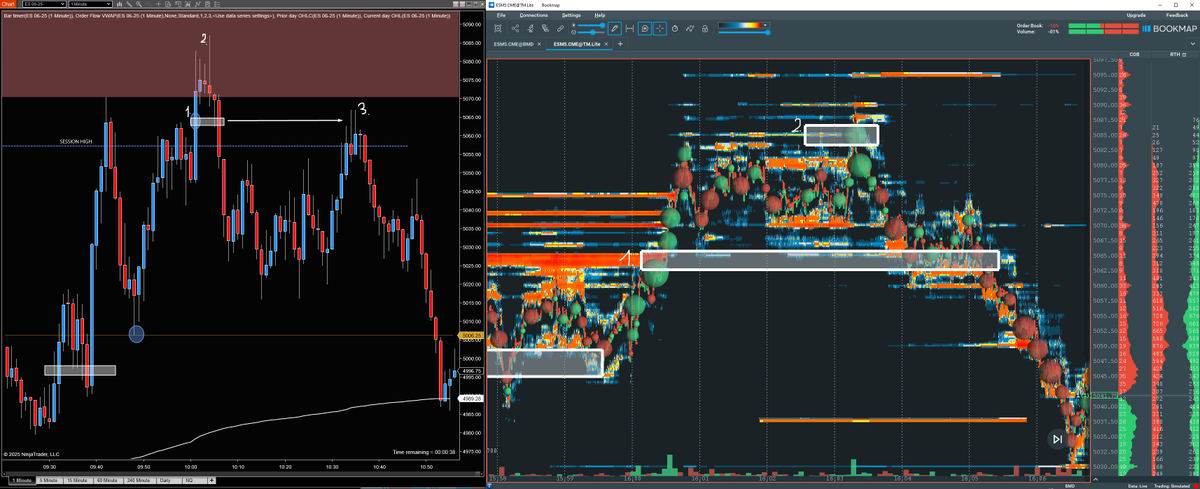
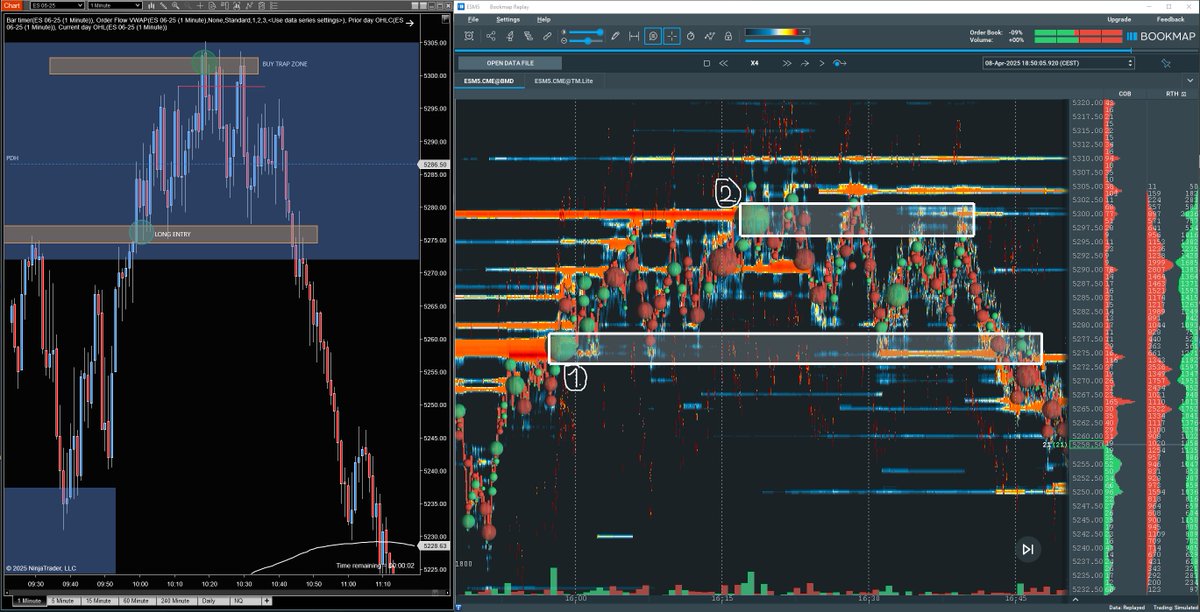
My final breakthrough came with Order Flow analysis. After mastering Footprint charts and Bookmap, everything clicked—I finally understood how candlestick patterns, market phases, and price structures actually form. 
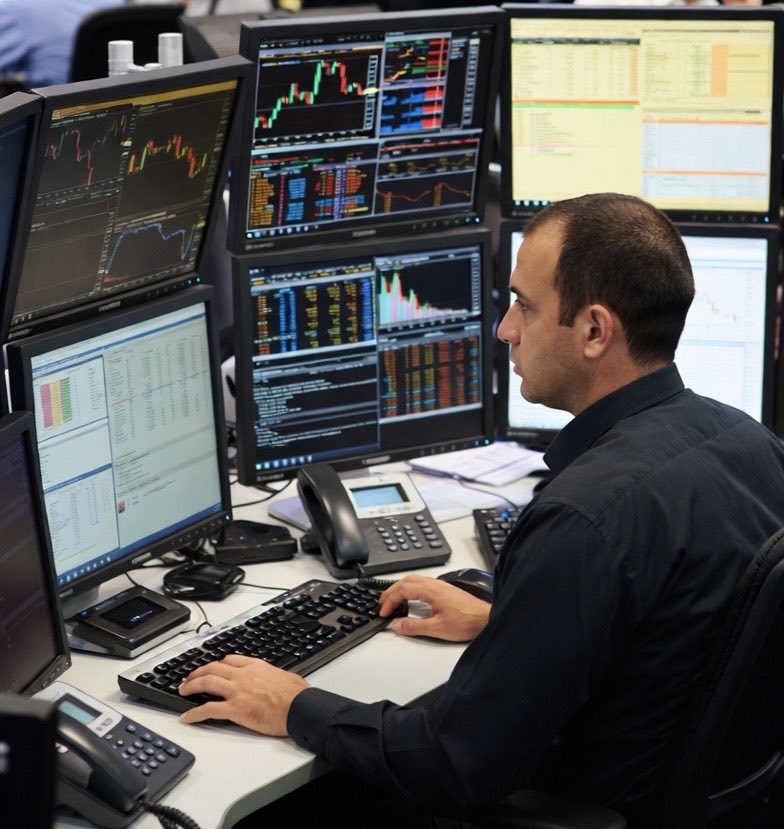
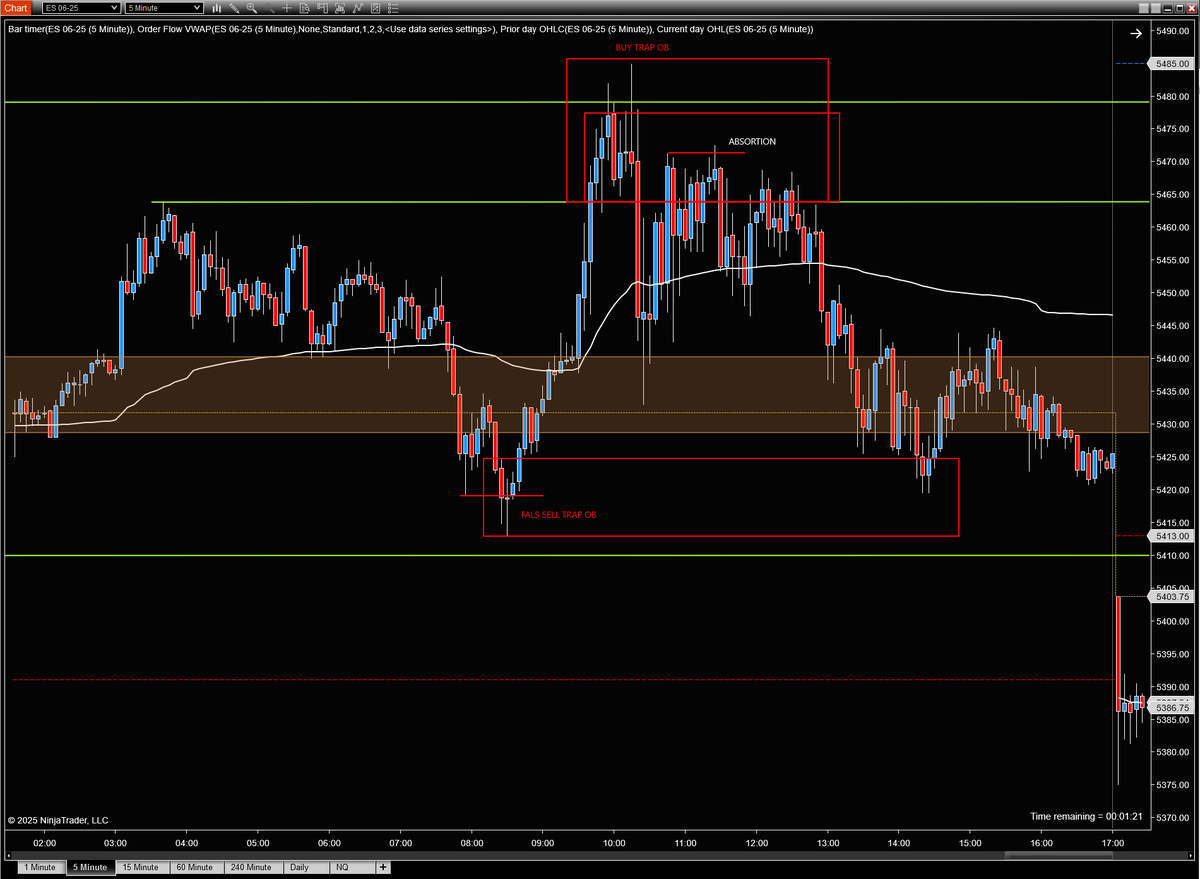
Today, I make my trading decisions using Order Flow tools and a proprietary 4-model "Buy & Sell Trap" entry system. Through my community, I now help both beginner and advanced traders achieve consistent success week after week.
English
0
0
5
279
Benedek Katona retweetledi
MARKET INSIGHTS!
MARKET INSIGHTS!@IManghaila·
Market Wizard Linda Raschke's 12 Technical Trading Rules 1. Buy the first pullback after a new high. Sell the first rally after a new low. 2. Afternoon strength or weakness should have follow‑through the next day. 3. The best trading reversals occur in the morning, not the afternoon. 4. The larger the market gaps, the greater the odds of continuation and a trend. 5. The way the market trades around the previous day’s high or low is a good indicator of the market’s technical strength or weakness. 6. The previous day’s high and low are two very important “pivot” points, for this was the definitive point where buyers or sellers came in the day before. Look for the market to either test and reverse off these points, or push through and show signs of continuation. 7. The last hour often tells the truth about how strong a trend truly is. “Smart money” shows their hand in the last hour, continuing to mark positions in their favor. As long as a market is having consecutive strong closes, look for the up‑trend to continue. The up‑trend is most likely to end when there is a morning rally first, followed by a weak close. 8. High volume on the close implies continuity the next morning in the direction of the last half‑hour. In a strongly trending market, look for resumption of the trend in the last hour. 9. The first hour’s range establishes the framework for the rest of the trading day. 10. A greater percentage of the day’s range occurs in the first hour than was the case in the past, and thus it has become increasingly important to trade aggressively if there are early signs of a strong trend for the day. 11. There are four basic principles of price behavior which have held up over time. Confidence that a type of price action is a true principle is what allows a trader to develop a systematic approach. The following four principles can be modeled and quantified and hold true for all time frames, all markets. The majority of patterns or systems that have a demonstrable edge are based on one of these four enduring principles of price behavior. Charles Dow was one of the first to touch on them in his writings. Principle One: A Trend Has a Higher Probability of Continuation than Reversal Principle Two: Momentum Precedes Price Principle Three: Trends End in a Climax Principle Four: The Market Alternates between Range Expansion and Range Contraction In the world of money, which is a world shaped by human behavior, nobody has the foggiest notion of what will happen in the future. Mark that word – Nobody! Thus the successful trader does not base moves on what supposedly will happen but reacts instead to what does happen.
MARKET INSIGHTS! tweet media
English
18
230
1.2K
77.8K
Benedek Katona retweetledi
NEXTA
NEXTA@nexta_tv·
⚡️ Attack on Dubai: Explosions near Burj Khalifa An Iranian missile landed in a prestigious area on the artificial Palm Jumeirah island. The area is home to luxurious hotels popular with Russian tourists. One of them caught fire.
NEXTA tweet mediaNEXTA tweet media
English
238
3.2K
9K
2.7M
Benedek Katona retweetledi
Market Rebellion
Market Rebellion@RebellioMarket·
Market Wizard Linda Raschke’s 12 Technical Trading Rules: 1. Buy the first pullback after a new high. Sell the first rally after a new low. 2. Afternoon strength or weakness should have follow through the next day. 3. The best trading reversals occur in the morning, not the afternoon. 4. The larger the market gaps, the greater the odds of continuation and a trend. 5. The way the market trades around the previous day’s high or low is a good indicator of the market’s technical strength or weakness. 6. The previous day’s high and low are two very important “pivot” points, for this was the definitive point where buyers or sellers came in the day before. Look for the market to either test and reverse off these points, or push through and show signs of continuation. 7. The last hour often tells the truth about how strong a trend truly is. “Smart” money shows their hand in the last hour, continuing to mark positions in their favor. As long as a market is having consecutive strong closes, look for up-trend to continue. The up trend is most likely to end when there is a morning rally first, followed by a weak close. 8. High volume on the close implies continuity the next morning in the direction of the last half-hour. In a strongly trending market, look for resumption of the trend in the last hour. 9. The first hour’s range establishes the framework for the rest of the trading day. 10. A greater percentage of the day’s range occurs in the first hour then was the case in the past, and thus it has become increasingly important to trade aggressively if there are early signs of a strong trend for the day. 11. There are four basic principles of price behavior which have held up over time. Confidence that a type of price action is a true principle is what allows a trader to develop a systematic approach.
Market Rebellion tweet media
English
13
267
1.3K
90.6K
Benedek Katona retweetledi
VickyFX⋆˙⟡
VickyFX⋆˙⟡@HiVickyFX·
🚨 BREAKING: PROP FIRMS BANNED DUBAI TRADERS! 🚨 - Major prop firms (Tradeify, MFF, TPT & more) just BLOCKED all Dubai/UAE residents - Rumors swirling that CME Group pressured them ,but ZERO official confirmation - Traders scrambling to remaining firms: Topstep, Alpha Futures, FundedNext, Lucid Trading - Many using Dubai LLCs as workaround (for now) ⚠️TAX NIGHTMARE FOR DUBAI TAX MIGRANTS: - Thousands moved/registered companies in UAE for 0% tax on prop payouts - Banned firms = fewer accounts → lower profits - Forced payouts could trigger massive home-country taxes (up to 50% in Canada/EU/India) More firms may follow → Dubai trading tax haven era ending fast? Traders in Dubai are you affected? Drop your experience below 👇
VickyFX⋆˙⟡ tweet media
English
40
22
281
65.1K
Benedek Katona retweetledi
Steve Burns
Steve Burns@SJosephBurns·
Trading is Math: Math is the language of profitable trading because successful trading is fundamentally about managing probabilities, edges, and risk — and math is the only language precise enough to describe these things accurately and consistently. Here are the main reasons: 1. Edge exists only as a statistical/probabilistic phenomenon
→ No math → no way to prove or measure an edge exists 2. Risk management is pure mathematics
Position sizing, stop placement, R-multiples, maximum drawdown, ruin probability, Kelly criterion, volatility scaling → all math 3. Profitability = Expectancy × Trade Frequency × (1 – Commission/Slippage drag)
If you can’t calculate expectancy mathematically, you don’t actually know whether you’re profitable or just lucky 4. Most market patterns are illusions until quantified. Beautiful chart patterns become profitable (or unprofitable) only after statistical validation (win rate, avg win/loss, profit factor, Sharpe/Sortino, etc.) 5. The market speaks in distributions, not predictions 
Profitable traders think in terms of
• probability distributions
• fat tails
• skewness
• serial correlation
• regime changes
All mathematical concepts
Steve Burns tweet media
English
29
193
1.3K
69.8K
Benedek Katona retweetledi
C3
C3@C_3C_3·
No other politician has the balls to do this over fear of being called racist. Trump is 1 of 1.
C3 tweet media
English
1.6K
14.7K
140.8K
3.8M
Benedek Katona retweetledi
Spicy
Spicy@spicyofc·
Open Interest keep it simple ↓
Spicy tweet media
English
7
78
586
47.4K
Benedek Katona retweetledi
Alex Prompter
Alex Prompter@alex_prompter·
R.I.P McKinsey. You don’t need a $300k consultant anymore. You can now run full competitive market analysis using Grok 4. Here are the exact 3 mega-prompts I use to replicate McKinsey-style insights for free:
Alex Prompter tweet media
English
814
4.2K
41.9K
13.7M
Benedek Katona retweetledi
Goshawk Trades
Goshawk Trades@GoshawkTrades·
Poker is one of the most important cheat codes in trading. Jeff Yass ($59B net worth) trains traders at his $500B+ hedge fund using poker for good reason. Here are 5 poker concepts that will make you a better trader:
Goshawk Trades tweet media
English
55
489
3.6K
672.6K
Benedek Katona retweetledi
Linda Raschke
Linda Raschke@LindaRaschke·
DAX: This morning I mentioned there is one way to trade these extended runs if not already carrying a position: Buy Dips below the 5 SMA or, buy any MORNING weakness. Do not buy afternoon weakness.
Linda Raschke tweet mediaLinda Raschke tweet media
English
1
17
250
13.1K
Benedek Katona retweetledi
michael
michael@_michaelreal·
Haven't traded all month - Made $2k today Gameplan is attached Off open we saw a sudden drop get absorbed leaving a 0 print- we then traded above 65 At this point I wanted to see 0p fill- we swept LOD, saw more selling and no continuation Long at 56, 4pt stop, target HOD
michael tweet mediamichael tweet mediamichael tweet mediamichael tweet media
English
6
3
59
6.8K
Benedek Katona
Benedek Katona@Benedektrader·
The image shows the following text: This is a true liquidity sweep (officially called a booksweep), when the aggressor side 'sweeps' passive orders from the order book. A previous high-resistance liquidity zone – which could be a trap OB – is broken through by the price in a volatile manner, during an expansion phase. This is where the imbalance (FVG), or low volume area, is formed. #bookmap
English
0
1
1
122
Benedek Katona
Benedek Katona@Benedektrader·
Before the New York session opens, I regularly share my market view (on ES) with my community, including the key levels I’m watching for potential trades. Yesterday was no different — I identified two key levels that were of interest to me, which can be seen on the chart. In English: “The 5487.75 level acted as a ceiling yesterday, from which the 5458 buy trap formed. This acted as resistance both yesterday and today. The 5411 level was a sell trap demand OB yesterday, and so far today it seems to hold the same role. These are the two levels I’m focusing on during the New York AM session on ES.” Every day, I look for levels where buy or sell traps might form — false breakouts — and zones that are likely to serve as retests of those traps. Yesterday, my expectation going into the New York AM session was that we would first see a buy trap, followed by a move lower toward the support below Monday’s low. That’s exactly what happened: the trap formed, followed by an extended consolidation where absorption occurred, and then price moved toward my target. Once again, I was able to apply a proven trap model effectively, and for greater precision, I used Bookmap to fine-tune my entry. The result speaks for itself. At the end of the day, the same mechanics are at play in every market and asset class: passive and aggressive buyers and sellers are constantly battling it out. My edge comes from being able to identify — with high precision — where traders are likely to get trapped, and recognizing the signs that confirm it. That’s where turning points happen.
Benedek Katona tweet mediaBenedek Katona tweet mediaBenedek Katona tweet media
English
0
1
2
137
Benedek Katona
Benedek Katona@Benedektrader·
In the FTTA concept that uses only candlestick charts, I refer to this exact sequence of events as a "Buy Trap OB". A Buy Trap OB is the zone where long traders (more specifically, aggressive buyers) get trapped. During a breakout, dumb money aggressively buys at a premium, while smart money is selling into it. Dumb money buys aggressively at premium prices, while smart money sells passively at those same premium levels using sell limit orders. Once the buying pressure is exhausted, aggressive sellers step in, driving the price down. Long traders' stop-losses get triggered, and the price drops sharply – this is the imbalance. Once the imbalance move is rebalanced and price returns to equilibrium, it often revisits the trap zone. At this point, smart money reappears and starts selling passively again. The cycle begins all over...
Benedek Katona tweet media
English
0
0
1
90
Benedek Katona
Benedek Katona@Benedektrader·
It’s the same as yesterday, except this time the reversal occurred at the session high rather than the PDH. These false breakouts are often accompanied by absorption, where aggressive buyers (market buys) are absorbed. This can be seen at point 2, indicated by the large green bubbles. Above and below this level, a high concentration of passive sellers is observable on the heatmap in the dark zones. At point 1, price broke the previous local high, which again was accompanied by significant buying activity (large green bubble). This level often acts as support and can serve as a long entry signal if the context is appropriate. However, since price reached the session high and Monday’s consolidation zone, this acted as resistance once price moved above it (point 3). On Bookmap, it’s essential to monitor these high-activity areas, as they represent key levels. These zones are typically the origin points of expansion phases following consolidation, where the market accelerates. Price often returns to these areas. Another type of key level are the trap points, where market participants are caught offside.
Benedek Katona tweet media
English
1
0
1
110
Benedek Katona
Benedek Katona@Benedektrader·
I primarily trade the ES. My strategy is based on order flow, balance–imbalance zones, and liquidity. However, it’s not the classic SCM/ICT approach. Instead, it's a custom methodology developed through personal experience, focusing on specific liquidity “trap” levels. I use the Bookmap heatmap to identify levels where one or more large market participants are active. These levels are recognizable by the execution of 1,000 or even several thousand contracts within seconds. Such levels are typically significant due to the presence of a large number of passive resting orders (see Points 1 and 2). When aggressive buyers or sellers consume a large passive level, this can act as a support or resistance zone — depending on the context (e.g., Point 1 at 5276). After a clean break and successful retest, I look for long entries, provided there’s a higher liquidity target — such as a zone with another significant cluster of passive orders. These zones tend to act as magnets for price (see Point 2). But every trend eventually comes to an end... Price cannot rise indefinitely — at some point, a reversal occurs. In this case, that happened between 5300 and 5305, where passive sellers absorbed the aggressive buyers. Once the buyers were exhausted, price reversed and moved lower. You can identify this absorption by observing the dark orange heatmap zone, where a large green bubble appears but fails to push through the level. Following that, no additional large green bubbles form, signaling that aggressive buying has faded. On a candlestick chart, this appears as a false breakout — what I refer to as a “buy trap OB zone.” During such a breakout, all aggressive buyers are absorbed, trapped in losing positions as the price reverses against them. The candlestick chart is merely the symptom — the footprint. The true why lies in the underlying volume dynamics and the flow of orders. #bookmap
Benedek Katona tweet media
English
0
2
5
199