
RC
88 posts

Our platform is now live and trading will begin this Friday, March 20, 2026. If you are interested to take part, either send "+" in comments or DM.
Reminder, those who subscribe before March 22 will receive the option of uncondition full refund within 14 days of payment.
Stratosphere@StratosphereBot
Who we are Portfolio managers from the @SoJustFollowMe team What we offer Stratosphere is a Live Portfolio Access service: • Real-time view of a live portfolio during the US trading session • Personal notifications for every trade in the portfolio What’s included in the notifications • Ticker / instrument • Strike price, expiration date, contract type (for options) • Direction (long/short), action (buy/sell) • Position size as % of AUM • Entry price Trading instruments • ETFs tracking major indices and economic sectors • Mega-Cap and Large-Cap stocks • Options on all of the above • Leveraged ETFs Subscription options • Quarterly: $350 USDT (to be announced) • Annual: $1,000 USDT Since the service is currently in launch / test mode, subscribers who join between March 15 - 22 (NY time) will receive the option of an unconditional full refund within 14 days of payment. • Free 1-day trial (coming soon) Next steps If you are interested in becoming one of the first subscribers, then either: 1. Subscribe to this @X account and add a comment with “+” to this post, or 2. Send a direct chat message with “+” This way we will be able to send you access instructions.
English
@SoJustFollowMe Appreciate the thoughtful response. That makes sense, especially around drawdowns and risk metrics with smaller AUM. I’m excited to see how Stratosphere develops and how the strategy performs as you continue testing and scaling it. I’m excited to be part of it
English

I’ll be honest - I don’t have a clear answer to that. None of my team has experience managing a portfolio with $150k AUM.
We’re thinking this through in detail and running backtests.
For now, my take is that a small AUM probably cannot directly affect CAGR.
It may lean toward slightly worse outcomes for drawdowns, recovery and Sharpe/Sortino ratios.
We’re working on how to balance this factor.
Denistratos@SoJustFollowMe
Thank you for your words - I truly appreciate them. One important thing to understand: the team running the $150k account won’t be able to fully replicate the strategy we run in the fund. Originally they wanted to run it with $1m, but I insisted on lowering it. I’ll explain why. No matter how often I say that account size doesn’t matter and that a professional can show what they’re capable of even with $10k - I’m not exactly being dishonest, but that’s also meant to support people with smaller accounts. In reality, some things are technically harder to do with a small deposit. So why lower it? Because many subscribers simply won’t have $1m. I didn’t want the service to look like “look what we can do.” I want it to have clear practical value. Why $150k and not $25k? Because people will join at different times - tomorrow, next week, a month later. I didn’t want someone joining later to just watch a growing portfolio that has already run out of cash, with no entry options left. It would be an honor to have you among the subscribers. You’ve always given me the impression of being a thoughtful person. And I’ll admit I also have a small selfish interest - you’re familiar with my content, and I know you’ll always give honest feedback. That matters a lot to me, since my name is attached to this service.
English
My team and I are launching the public portfolio service STRATOSPHERE.
• AUM size – $150k
• trade structure – so that trades fit almost any account size
• underlying assets – indices, economic sectors, large-capitalization companies
• main instruments – call options and leveraged ETFs
• trading time – regular trading session from 9:30 to 16:00 NY time
Every action in the portfolio – you’ll receive an individual notification shortly.
Portfolio viewing will be available online every trading day from 9:00 to 16:30 NY time.
Who is this service for?
That is a question each of you will have to answer for yourself – only you can assess your experience, your approach to trading, your discipline, your trading strategy or its absence, and only you know your trading history and its real results.
What can be said for sure: if you
• close every year in profit, year after year outperforming $SPX
• are a committed supporter of holding positions through red
• are convinced that you can consistently make money with a portfolio consisting entirely of “undervalued” companies like $MSTR, $PYPL, $JD, $EL, $SMCI, $SNAP, $PATH, $DUOL, $HIMS, $OPEN, etc.
• trade earnings, news, IPOs, SPACs and other random events
• are a fan of shorts, hedging and other strategies with a low probability of success over long periods of time
• firmly believe that you can perform the work of an open-heart cardiac surgeon after studying information on @X written by a theatre student
This service is definitely not for you.
p.s. The service is anonymous. Neither we nor other clients will be able to know that you use it unless you disclose this information yourself.
Want to know more? Go to @StratosphereBot
What are the principles behind the strategy? Posts below show how I think and trade.
🟢 Must reads
🔵 Good to know
THE BASIS OF MY STRATEGY
🟢 Deliberate Aggression → Absolute Control
x.com/sojustfollowme…
🟢 How I differ from 99.99% of traders
x.com/sojustfollowme…
🟢 How I structure my portfolio
x.com/sojustfollowme…
🟢 Predict Indicator: Red or Green Days Ahead
x.com/sojustfollowme…
🟢 My Trading Evolution: From Imitation to Independence
x.com/sojustfollowme…
🟢 Why I Trade Only the U.S. Market
x.com/sojustfollowme…
🟢 Why I Don’t Hedge (and Stanley Druckenmiller too)
x.com/sojustfollowme…
🟢 Why I Rarely Use Short Positions
x.com/sojustfollowme…
🟢 Answers to questions about my trading strategy. Part one
x.com/sojustfollowme…
🟢 Answers to questions about my trading strategy. Part two
x.com/sojustfollowme…
🟢 Important note
x.com/sojustfollowme…
WHY I TRACK TRADING ALGOS
🟢 Power, Media, Money: Algos Against You
x.com/sojustfollowme…
🟢 Brokers in suits are out – AI runs Wall Street now
x.com/sojustfollowme…
🟢 News and “accidents”… not so accidental after all?
x.com/sojustfollowme…
🟢 Jeffrey Epstein on Wall Street
x.com/sojustfollowme…
🟢 Visible trading algos shifts from New Year
x.com/sojustfollowme…
WALL STREET: BRUTAL REALITY
🟢 All you need to know about Wall Street hedge funds. Q4 2025
x.com/sojustfollowme…
🟢 Mutual & Hedge Funds: 2025 Disaster, Déjà Vu
x.com/sojustfollowme…
🟢 All you need to know about Wall Street hedge funds. Q3 2025
x.com/sojustfollowme…
🟢 All you need to know about Wall Street hedge funds. Q2 2025
x.com/sojustfollowme…
🟢 Everything You Need to Know About U.S. Hedge Funds – in a Single Brutal Chart. Q1 2025
x.com/sojustfollowme…
WHY I THINK WE’RE MORE LIKELY HEADING FOR THE COLLAPSE OF THE AI BUBBLE
🟢 The collapse of the AI bubble. Part one SPX/M2SL
x.com/sojustfollowme…
🟢 The collapse of the AI bubble. Part two SPX/M2SL
x.com/sojustfollowme…
🟢 The collapse of the AI bubble. Part three QQQ/M2SL
x.com/sojustfollowme…
🟢 $MSTR: SEC, fraud, crash -62% in one day
x.com/sojustfollowme…
🟢 IMF in panic? Reading between the lines
x.com/sojustfollowme…
Continued ↓

Denistratos@SoJustFollowMe
🚨 THE COLLAPSE OF THE AI BUBBLE. PART ONE – INTRODUCTORY. In his 1886 work “Beyond Good and Evil,” Friedrich Nietzsche wrote: “…if you gaze long into an abyss, the abyss also gazes into you.” Well, Mr. @michaeljburry seems to have stared deep into the market’s abyss – and spotted an AI bubble staring back. The problem is, this poor Cassandra’s predictions have been missing the mark for years. Fair enough – the existence of an AI bubble is obvious to almost everyone (except a few completely delusional individuals). But when it bursts, and what to do next – he doesn’t know. I do. Before you is one of the small fragments of my trading system: SPX/M2SL – an indicator showing the ratio of the S&P 500 to the M2 money supply (seasonally adjusted). In essence, it’s a measure of the total amount of money available in the U.S. economy. What’s important to know? This exact indicator gave me the signal to move 100% to cash: ▫️ in 2018 – before Trump Tariffs 1.0 and the start of the trade war with China ▫️ in early January 2020 – before COVID-19 ▫️ in December 2021 – before the 2022 Bear Market These and other introductory key dates are marked on the chart. Observe, study, verify. Words here are basically unnecessary. Part Two – the practical one – is planned to drop tomorrow. But whether it actually comes out depends entirely on you. I won’t post it until this one gets 35 likes and 35 comments. Or 100 likes. Not a single one less. p.s. Charts posted by @Barchart under titles like “Tech Stocks relative to M2 Money Supply 🚨 Dot Com Bubble vs. Now 🤯👀” are absolutely useless and uninformative. Same goes for all other M2 Money Supply “variations.” See for yourself 👇🏻👀 p.p.s. On the chart, you’ll see what looks like SPX/M2SL touching its lower boundary – but in reality, there was no touch‼️ • I expanded the range and only noticed after the chart was finalized – and didn’t bother redoing it, since it makes no difference for the introductory part; • The chart was prepared earlier this week, and with the market correction, the indicator itself also adjusted slightly – moving away from that “touch.” Future updates (if there are any) will be published without this error. $SPY, $QQQ, $MAGS, $SMH, $NVDA, $MSFT, $AAPL, $GOOGL, $AMZN, $META, $TSLA, $AVGO, $ORCL, $PLTR, $AMD, $NFLX, $ANET, $CRWV, $NBIS, $HOOD, $SOFI
English
Who we are
Portfolio managers from the @SoJustFollowMe team
What we offer
Stratosphere is a Live Portfolio Access service:
• Real-time view of a live portfolio during the US trading session
• Personal notifications for every trade in the portfolio
What’s included in the notifications
• Ticker / instrument
• Strike price, expiration date, contract type (for options)
• Direction (long/short), action (buy/sell)
• Position size as % of AUM
• Entry price
Trading instruments
• ETFs tracking major indices and economic sectors
• Mega-Cap and Large-Cap stocks
• Options on all of the above
• Leveraged ETFs
Subscription options
• Quarterly: $350 USDT (to be announced)
• Annual: $1,000 USDT
Since the service is currently in launch / test mode, subscribers who join between March 15 - 22 (NY time) will receive the option of an unconditional full refund within 14 days of payment.
• Free 1-day trial (coming soon)
Next steps
If you are interested in becoming one of the first subscribers, then either:
1. Subscribe to this @X account and add a comment with “+” to this post, or
2. Send a direct chat message with “+”
This way we will be able to send you access instructions.

English
$873k in realized profits (screenshots in Highlights) or 70%+ YTD return from June to December 2025 in the public portfolio.
I made this with full transparency – every trade from entry to exit, every position change, daily P&L.
For new followers – who’s behind this account:
Greek, 44. @MIT grad. 21 years in the markets.
Former Chief Investment Officer & Head Portfolio Manager on Wall Street.
I managed a portfolio with ten-figure AUM and delivered a 44.7% CAGR over the last 7 years.
I am currently serving in the same capacity at a hedge fund in Abu Dhabi, UAE.
My edge is a trading system inspired by Jim Simons’ Medallion & Renaissance approach.
I design and operate mathematical market system.
Running since 2019 – green every single year, consistent outperformance vs #SPX, with superior drawdown, recovery, Sharpe and Sortino ratios.
In the coming days, my team and I are launching a new project. Want to be notified first? Leave a comment: “Stratosphere”.
In the meantime, below are the key posts I’ve written over the past 10 months on @X – they show how I think and trade.
🟢 Priority reads
🔵 Secondary reads
The Basis of My Strategy. Read below ↓

English
@SoJustFollowMe When running equity exposure through LEAPS, are you generally rolling before they enter the final year to avoid accelerated theta decay?
English
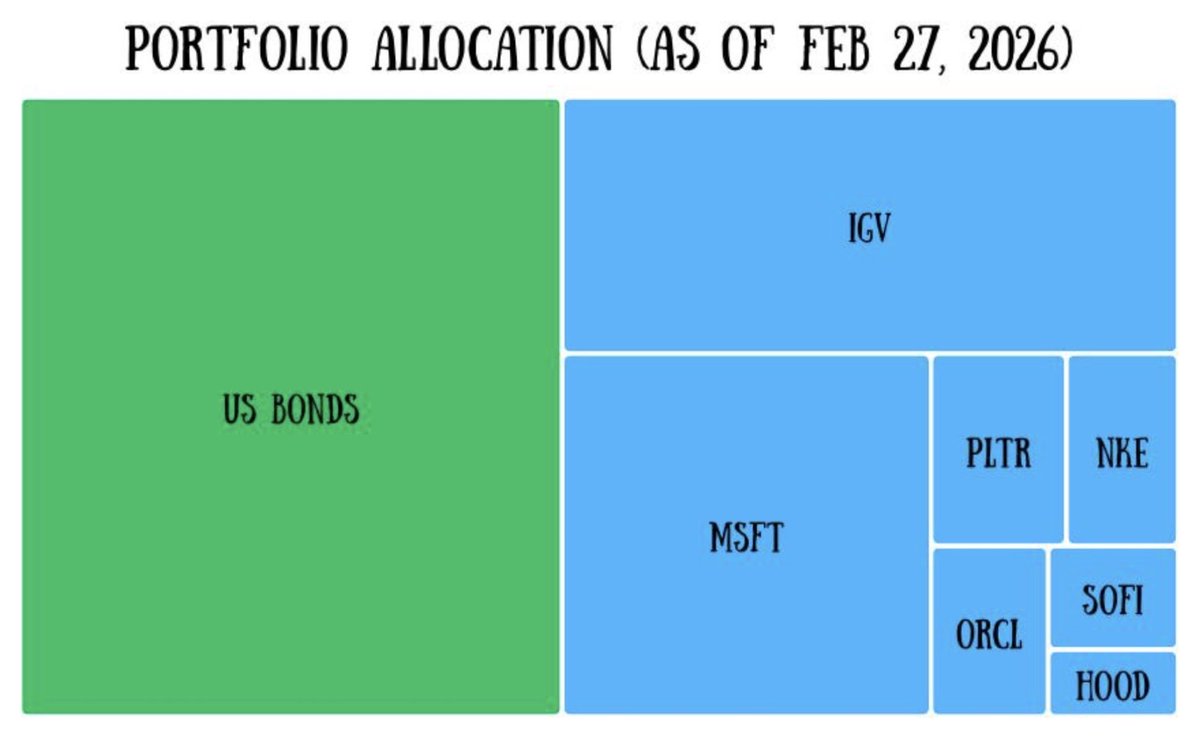
Portfolio Allocation (as of Feb 27, 2026)
$HOOD – 1.16%
$IEF – 46.81%
$IGV – 21.98%
$MSFT – 18.76%
$NKE – 2.97%
$ORCL – 2.78%
$PLTR – 3.67%
$SOFI – 1.87%
Portfolio Structure:
Allocation: $5.23m – $2.78m equity, $2.45m bonds.
Leverage: 1.87x. Free cash: 73.7%.
- - - - - - - - - - - - - - - - - - - - - - - - - - - - - - - -
Part for those who want to dig into the details.
What is important to understand when looking at the weekly data:
1️⃣ AUM ≠ allocation
Example on S&P 500 instruments:
1% AUM in $SPY = 1% allocation
1% AUM in $SSO (2x $SPY) = 2% allocation
1% AUM in $UPRO (3x $SPY) = 3% allocation
1% AUM in LEAPS options on $SPY, ITM, ~80% delta = 4-5% allocation
And so on.
2️⃣ You see the actual allocation of positions
Example in 4 steps:
1. The first position is opened at 1% of AUM → you will see it with a 100% allocation.
2. A second position is opened at 1% of AUM → you will see two positions at 50% each.
3. A third position is opened at 2% of AUM → you will see one position at 50% and two at 25% each.
4. A fourth position is opened at 1% of AUM → you will see one position at 40% and three at 20% each.
At the same time, remaining cash is 95%.
- - - - - - - - - - - - - - - - - - - - - - - - - - - - - - - -
At first, this may seem complex.
But once you understand the logic and follow it over time, it becomes clear why professionals use this approach.
Eventually, you will start looking at the weekly portfolio updates through their lens.
Denistratos@SoJustFollowMe
Portfolio Allocation (as of Feb 20, 2026) $HOOD – 1.63% $IGV – 12.97% $NFLX – 4.21% $NKE – 4.38% $ORCL – 3.96% $PLTR – 5.07% $SOFI – 2.80% $IEF – 64.98% The full portfolio structure – including account leverage and free cash – is shown on the last Friday of each month. - - - - - - - - - - - - - - - - - - - - - - - - - - - - - - - - Part for those who want to dig into the details. What is important to understand when looking at the weekly data: 1️⃣ AUM ≠ allocation Example on S&P 500 instruments: 1% AUM in $SPY = 1% allocation 1% AUM in $SSO (2x $SPY) = 2% allocation 1% AUM in $UPRO (3x $SPY) = 3% allocation 1% AUM in LEAPS options on $SPY, ITM, ~80% delta = 4-5% allocation And so on. 2️⃣ You see the actual allocation of positions Example in 4 steps: 1. The first position is opened at 1% of AUM → you will see it with a 100% allocation 2. A second position is opened at 1% of AUM → you will see two positions at 50% each 3. A third position is opened at 2% of AUM → you will see one position at 50% and two at 25% each 4. A fourth position is opened at 1% of AUM → you will see one position at 40% and three at 20% each At the same time, remaining cash is 95%. - - - - - - - - - - - - - - - - - - - - - - - - - - - - - - - - Therefore, avoid rushing to conclusions – each position represents only a small fraction of portfolio AUM. At first, this may seem complex. But once you understand the logic and follow it over time, it becomes clear why professionals use this approach. Eventually, you will start looking at the weekly portfolio updates through their lens.
English
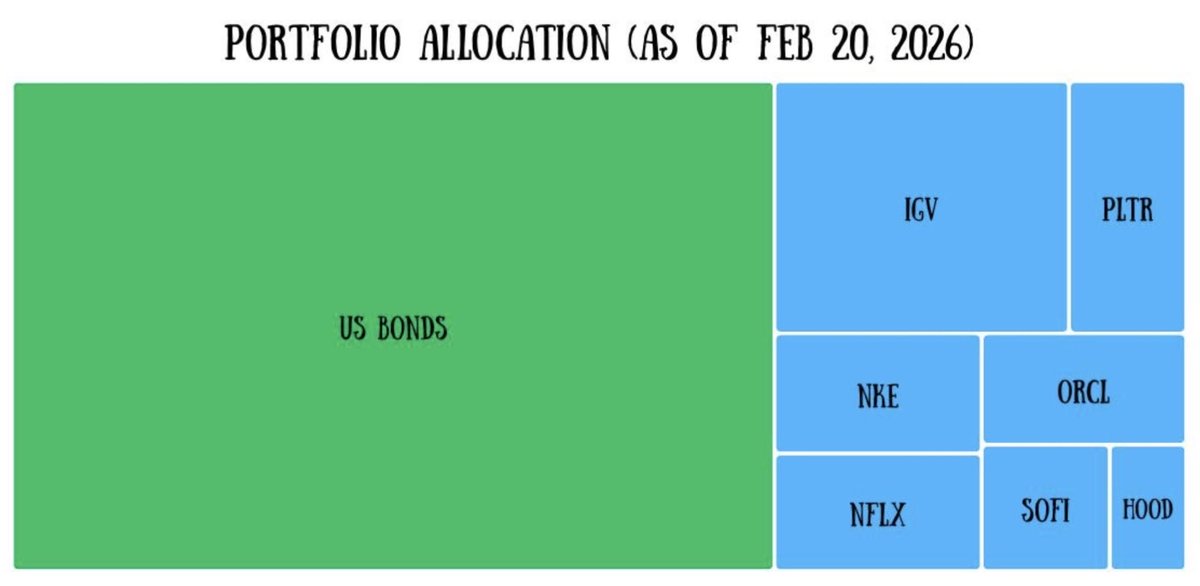
Portfolio Allocation (as of Feb 20, 2026)
$HOOD – 1.63%
$IGV – 12.97%
$NFLX – 4.21%
$NKE – 4.38%
$ORCL – 3.96%
$PLTR – 5.07%
$SOFI – 2.80%
$IEF – 64.98%
The full portfolio structure – including account leverage and free cash – is shown on the last Friday of each month.
- - - - - - - - - - - - - - - - - - - - - - - - - - - - - - - -
Part for those who want to dig into the details.
What is important to understand when looking at the weekly data:
1️⃣ AUM ≠ allocation
Example on S&P 500 instruments:
1% AUM in $SPY = 1% allocation
1% AUM in $SSO (2x $SPY) = 2% allocation
1% AUM in $UPRO (3x $SPY) = 3% allocation
1% AUM in LEAPS options on $SPY, ITM, ~80% delta = 4-5% allocation
And so on.
2️⃣ You see the actual allocation of positions
Example in 4 steps:
1. The first position is opened at 1% of AUM → you will see it with a 100% allocation
2. A second position is opened at 1% of AUM → you will see two positions at 50% each
3. A third position is opened at 2% of AUM → you will see one position at 50% and two at 25% each
4. A fourth position is opened at 1% of AUM → you will see one position at 40% and three at 20% each
At the same time, remaining cash is 95%.
- - - - - - - - - - - - - - - - - - - - - - - - - - - - - - - -
Therefore, avoid rushing to conclusions – each position represents only a small fraction of portfolio AUM.
At first, this may seem complex.
But once you understand the logic and follow it over time, it becomes clear why professionals use this approach.
Eventually, you will start looking at the weekly portfolio updates through their lens.
Denistratos@SoJustFollowMe
Portfolio ended up $47,600 today. How did your portfolio perform? No trades Open Positions: • $PLTR, $NFLX, $ORCL, $NBIS, $SOFI, $HOOD, $IBM, $ADBE, $NKE, $TGT, $NOW, $CRM – all LEAPS calls • $IGV, $IEF (US Treasury 7-10) – all LEAPS calls • T-Bills & T-Notes – cash equivalents
English

In the last 26 months, we doubled revenue at my orthodontic clinic.
What happened to overhead?
Fixed costs get cut in half.
Rent went from 6% of collections to 3%
Practice loan from 4% to 2%
Fixed utilities/softwares from 2% to 1%
Great way to fix your overhead is to grow your collections!
English
@SoJustFollowMe I did not see a post where you opened a short position. How did you decide to this ?
English
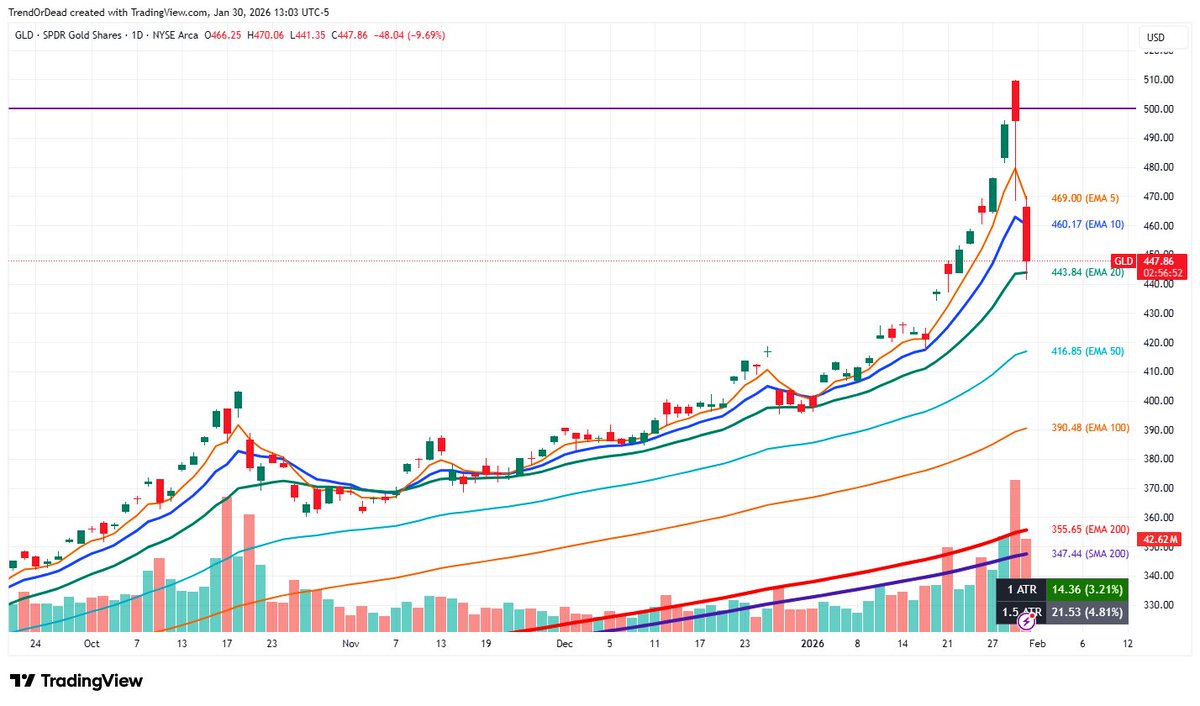
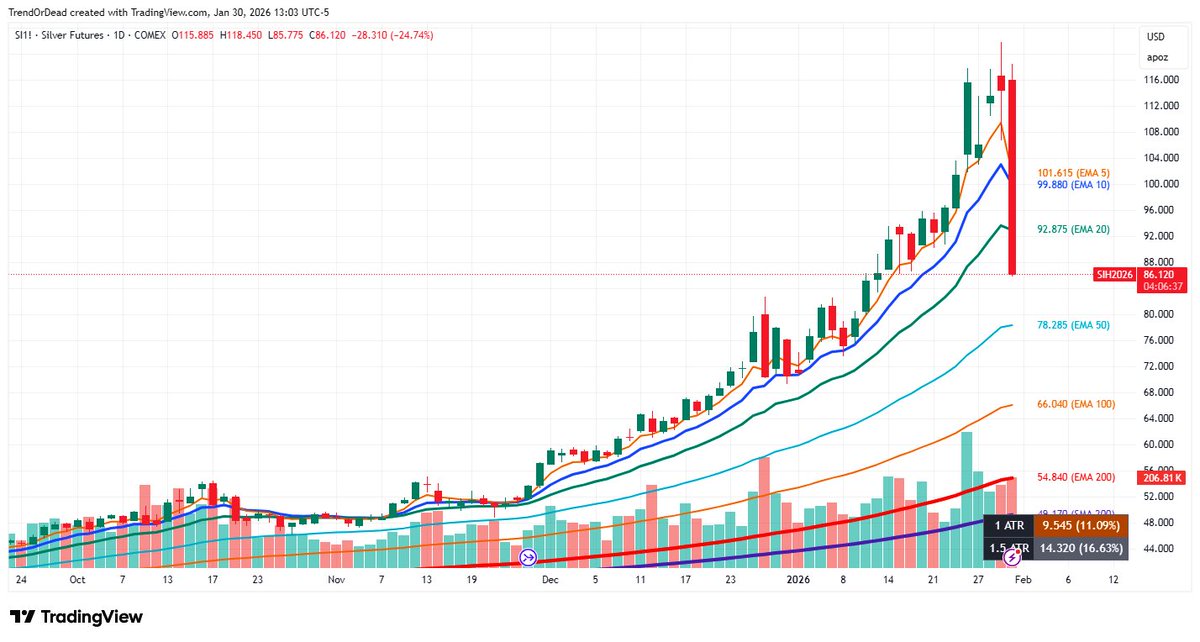
$GLD and the power of the round $500 level for the most liquid precious metals ETF.
The short opened yesterday in $SLV and $PPLT is closed.
English
@SoJustFollowMe How do you determine when to add to an already existing position
English
Portfolio ended up $42,100 today.
How did your portfolio perform?
Trades:
• Bought $AAPL – LEAPS
• Sold $AAPL shares
Why? Significantly increased the position.
Open Positions:
• $MSFT, $PLTR, $AAPL, $ANET, $NFLX, $ORCL, $SOFI, $HOOD, $NBIS – all LEAPS calls exp Jan 15, 2027
• $UPRO (3x $SPY), $TQQQ (3x $QQQ)
• $RACE, $DAVE
• $IEF & $TLT (US Treasury 7-10 & 20+) – all LEAPS calls exp Jan 15, 2027
Portfolio Structure:
Allocation: $12.4m – $7.6m equity, $4.8m bonds.
Leverage: 4.3x. Free cash: 9%.

English
@SoJustFollowMe Is it common for your system to be flagging so many companies?
English
In the past three weeks, I shared 19 companies my algo-tracking system flagged as buys – high probability of growth:
• $ADBE – $288.4
• $AJG – $255.3
• $APP – $509.1
• $BRO – $79.8
• $COST – $879.7
• $CROX – $85
• $CSU – CAD 3,288
• $DAVE – $191
• $FDS – $286.3
• $FISV – $68.1
• $FTNT – $73.6
• $HUM – $269.2
• $INTU – $551.7
• $MOH – $176.3
• $NKE – $63.8
• $NOW – $132.7
• $RACE – $358.2
• $TGT – $100.5
• $TMUS – $185.2
Prices reflect the day each post went live. Scroll down to see the posts for each company.
⚠️ This could’ve been 20 companies, but $DUOL missed 99 likes out of 250. Not a dealbreaker for me – but if it matters to you, go ahead. Post below.
I’ll post monthly updates – by year-end, we’ll see exactly how the strategy performed.
Next, we’ll see how the strategy’s results stack up against my public portfolio (daily on @X) and Wall Street hedge fund gurus like #Renaissance Technologies, #Duquesne Family Office, #Berkshire Hathaway $BRK, @BillAckman, @RayDalio, @michaeljburry, Paul Tudor @ptj_official, Ken Griffin @Citadel, @Carl_C_Icahn and more.
Read the WALL STREET: BRUTAL REALITY series in the pinned post for full context.
Your turn – answer below ↓
Denistratos@SoJustFollowMe
I’m no fan of @duolingo, but many of you bought it long ago and are now deep in a drawdown. According to data from #Gemini, #GROK and #ChatGPT, $DUOL has long been recommended by: @jimcramer, @Stocktwits, @SeekingAlpha, @JonahLupton, @TheLongInvest, @alc2022, @oguzerkan, @joecarlsonshow, @mvcinvesting, @BourbonCap, @patientinvestor, @FunOfInvesting, @MMatters22596, @qualtrim, @QualityInvest5, @Couch_Investor, @JKeynesAlpha, @CMDarnton0, @topsecretstocks, @StockChaser_ and many others. It’s quite possible some are shareholders. I don’t follow any of them and can’t judge their methods; apologies if anyone was included by mistake. Let me also state this right away: I’m not here to throw dirt at anyone or to lecture. These are bloggers on @X. And, by and large, they show and tell you exactly what you’re willing to accept by relying on them. If you want fairy stories about Wide Moat, Cash Cows, Counter-cyclicality, Margin of Safety, Pricing Power and Buybacks, Insider Buying and Selling – you’re welcome. If you want Fibonacci or other forms of chart wall art – that’s fine too. If you hold $DUOL and are in the red, it’s not someone else’s fault. Responsibility is yours alone. At the same time, at least two people I personally follow are holding a position in $DUOL. I deliberately won’t mention their names publicly. Want to know where algos are most likely to reverse the price in $DUOL? It’s simple. 250 likes under this post – and you’ll learn about another pattern embedded in the data by cold numerical methods, independent of anyone’s fantasies or emotions, one the algos will be forced to react to. I’ll not only indicate the price range – position will be opened once the price hits it, in my public portfolio. Think I’m wrong? A thousand arguments ready? Don’t. I don’t want to argue for the sake of arguing. Likes in – entry point revealed. Who’s right – me or those who spent months telling followers why these moments were good? Time will decide. p.s. For the stubborn ones who will start giving me arguments about how nice it is to be right in hindsight: my portfolio is public and open. Each of you can see every position I added or closed over the past year. After all, there’s search. You can also find everything I’ve ever written or commented on regarding $DUOL. A repost would be appreciated – it helps reach the likes faster and speeds up the process.
English
@cooltaj Pick one position of your choice to ask about and I'll give you the answer
English
@SoJustFollowMe Why are there stock positions and not itm leaps? What directs your thought process with opening a position like this
English
Likes are in. Today’s stock – $FTNT.
3 touches of the weekly 200 EMA over the past 10 years, three swings:
• December 2016 → over 6 years, +1,250%
• October 2023 → 16 months, +135%
• August 2025 → played in the public portfolio, realized 22% in 3 weeks (screenshot in highlights)
I plan to open a position at the touch of the weekly 200 EMA. Today that’s $72.65.
Position size – 1.75% of AUM.
Stop-loss – 1 ATR (see bottom-right of the chart).
Risk/reward ratio – 1 / 23.

Denistratos@SoJustFollowMe
Want a stock that last 3 times this pattern appeared ran: • over 6 years, +1,250% • 16 months, +135% • 3 months, +25% For me, it’s a buy. I’ll open a 1.75% position in the public portfolio – same sizing logic as $DAVE, $NKE, $PG, $TMUS. I’ll share the ticker if this hits 150 likes.
English
Want a stock that last time this pattern appeared ran for 10 years and delivered over 3,500%?
For me, it’s a strong buy.
I’ll open a 3.5% position in the public portfolio – same sizing logic as $AAPL, $AVGO, $RACE.
Could go to 5%.
I’ll share the ticker if this hits 150 likes.
GIF
English
Likes are in. The Secret Stock added to the public portfolio yesterday – $DAVE.
Over the past year and a half, it has touched the 200 EMA D five times:
• June 27, 2024 → July 17, 2024 – 20 days, +52%
• August 6, 2024 → February 18, 2025 – 196 days, +321%
• April 7, 2025 → July 8, 2025 – 92 days, +310%
• November 21, 2025 → January 26, 2026 – 20 days, +29%
• January 15, 2026 → …
This is not a trade I usually take – it’s a tiny-cap company, which makes it unusual for me – but I’m entering it calmly, based on the current stage of the market (more details in Sunday posts).
The position is 1.75% of AUM, stop – 1.5 ATR (see the lower right corner of the chart).
Risk/reward is estimated as:
• 1 / 2.5 if things go against us
• up to 1 / 25 if things go as expected
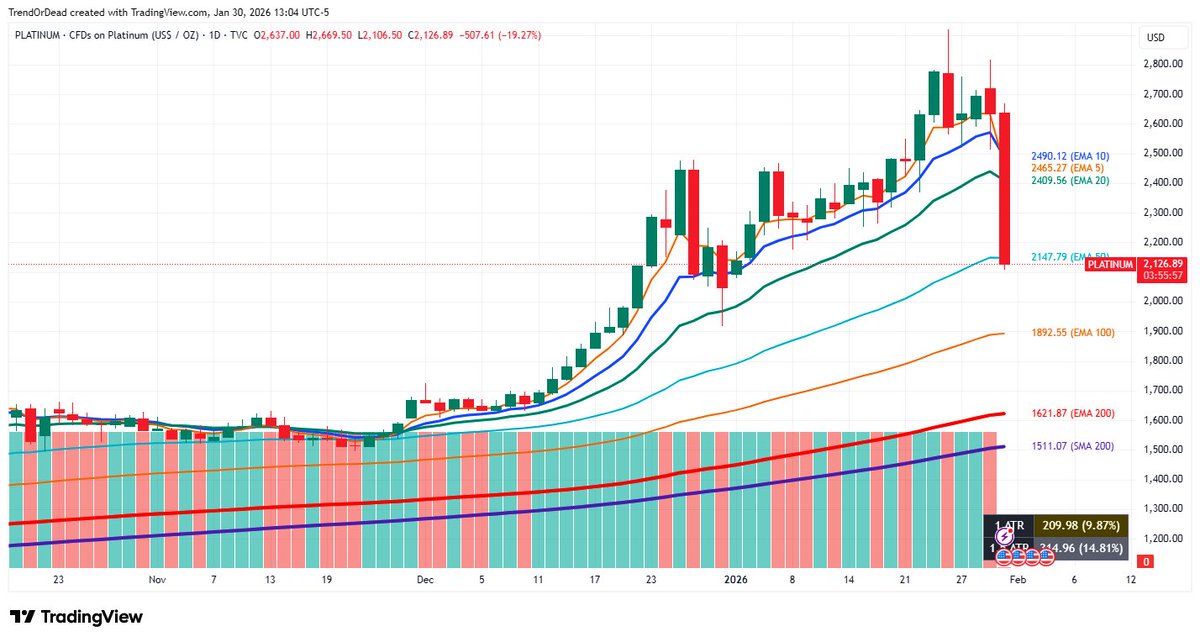
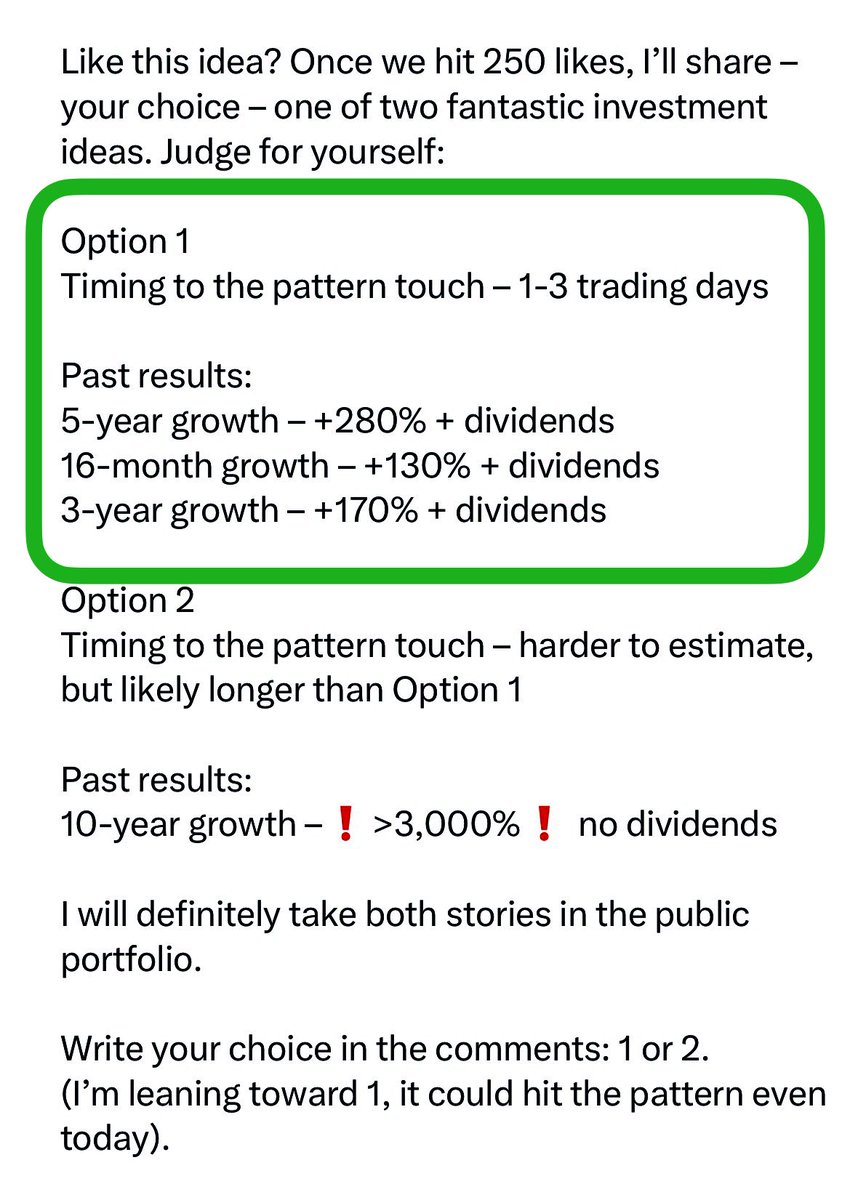
Like this idea? Once we hit 250 likes, I’ll share – your choice – one of two fantastic investment ideas. Judge for yourself:
Option 1
Timing to the pattern touch – 1-3 trading days
Past results:
5-year growth – +280% + dividends
16-month growth – +130% + dividends
3-year growth – +170% + dividends
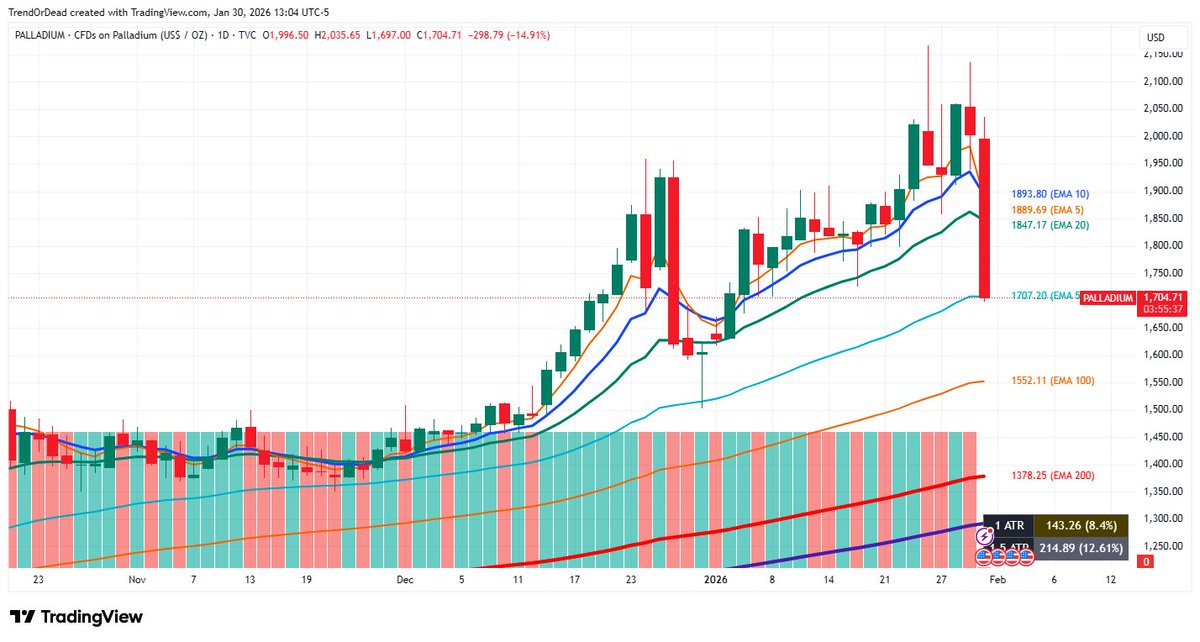
Option 2
Timing to the pattern touch – harder to estimate, but likely longer than Option 1
Past results:
10-year growth –❗️>3,000%❗️ no dividends
I will definitely take both stories in the public portfolio.
Write your choice in the comments: 1 or 2.
(I’m leaning toward 1, it could hit the pattern even today).
p.s. No one in the comments, including @Mindset4Money_X and @meeijer, guessed the company correctly, except @TacticzH. Applause to him 👏🏻👏🏻
A repost would be appreciated – it helps reach the likes faster and speeds up the process.

Denistratos@SoJustFollowMe
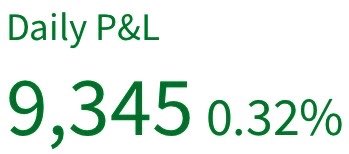
Portfolio ended up $9,300 today. How did your portfolio perform? Trades: • Bought –❗️Secret Stock❗️Want it? If this post hits 100 likes, I’ll not only reveal the name but also show visually why it could confidently see 200%+ upside. Hint: Andy @Mindset4Money_X writes about it a lot and I’ve seen @TacticzH and @meeijer mention it too. • Sold $CRWV – reducing low-cap / high-beta exposure Why? See point 4 of Deliberate Aggression → Absolute Control, linked in the pinned post on my profile. Open Positions: • $MSFT, $AMZN, $ORCL, $NFLX, $PLTR, $ANET, $HOOD, $NBIS, $SOFI – all LEAPS calls exp Jan 15, 2027 • $UPRO (3x $SPY), $TQQQ (3x $QQQ) • $AAPL, $AVGO, $RACE, $NKE, $PG, Secret Stock • $IEF & $TLT (US Treasury 7-10 & 20+) – all LEAPS calls exp Jan 15, 2027
English
@SoJustFollowMe @Mindset4Money_X Looking at the two stocks you revealed last night I am not seeing why their is a possibility of a 200 percent increase in one of them
English
Portfolio ended up $9,300 today.
How did your portfolio perform?
Trades:
• Bought –❗️Secret Stock❗️Want it? If this post hits 100 likes, I’ll not only reveal the name but also show visually why it could confidently see 200%+ upside.
Hint: Andy @Mindset4Money_X writes about it a lot and I’ve seen @TacticzH and @meeijer mention it too.
• Sold $CRWV – reducing low-cap / high-beta exposure
Why? See point 4 of Deliberate Aggression → Absolute Control, linked in the pinned post on my profile.
Open Positions:
• $MSFT, $AMZN, $ORCL, $NFLX, $PLTR, $ANET, $HOOD, $NBIS, $SOFI – all LEAPS calls exp Jan 15, 2027
• $UPRO (3x $SPY), $TQQQ (3x $QQQ)
• $AAPL, $AVGO, $RACE, $NKE, $PG, Secret Stock
• $IEF & $TLT (US Treasury 7-10 & 20+) – all LEAPS calls exp Jan 15, 2027
English
@SoJustFollowMe Thank you. Poetical when entering is once profitable you set stop to break even after end of day ?
English
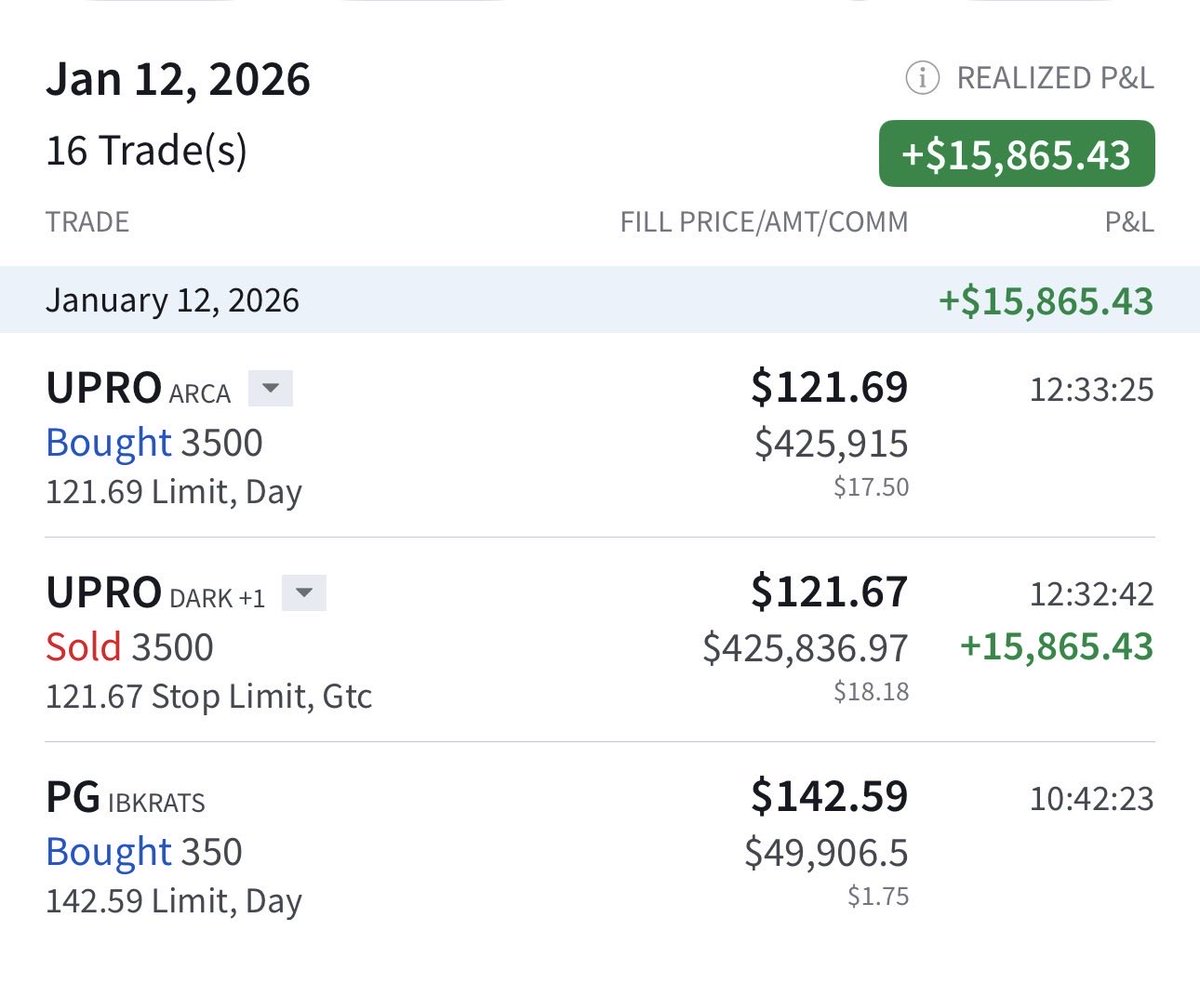
Today I booked a $15,800 profit…
but there won’t be a “Today, I took another bite” post…
because this one happened… by accident.
The $UPRO position I sold was immediately put back on.
Oops… even I have my “oops” moments 😅
English