Bullish

495 posts

Bullish banner
Bullish

Bullish

@Bullish530184

cautiously optimistic, complete with pessimism

United States Katılım Ağustos 2024
358 Takip Edilen75 Takipçiler
Bullish retweetledi
Elliott Wave Strategy
Elliott Wave Strategy@ewstrategy·
#XAGUSD 🥈 Silver is about to hand us a gift. 🎁 After that crazy ride from $122 → $61, price has climbed back up and parked itself just below our invalidation at $83.05. This is where the chop ends and the next move begins. 📉 The Setup: Below $83.05 → the bearish count is alive. Be careful if price continues to go higher! Expected path: a small push higher, then rejection. Downside target: ~$68 zone. That's roughly 1000+ pips of potential. 🎯 This is the kind of "coiled spring" most traders will miss. They'll see the bounce and rush to buy the "recovery." We'll be waiting for the rejection candle instead. 📌 The setup isn't 100%! No setup ever is. What matters is knowing exactly where it fails ($83.05) and exactly where it pays ($68). That's the entire game. Don't guess. Plan then trade. 🏄‍♂️
Elliott Wave Strategy tweet media
English
12
19
180
36.3K
Bullish retweetledi
Economic Office
Economic Office@Economic_Office·
Silver has reached the red descending trend. My first expectation: a pullback toward the $56–59 range. If this zone holds, wave 4 completes and the attempt for an upside breakout strengthens. Critical scenario: • Holding above the $56–59 range → $80 and then the $120+ zone. • Sustained move below $56 → the count extends, the rally is delayed. We are currently in the decision zone. Do you think we’ll see a liquidity sweep first, or a direct breakout? #XAGUSD #SILVER
Economic Office tweet media
Economic Office@Economic_Office

Silver is at $70.49. Wave 4 correction is in its final stage. Wave W dropped to $63, Wave X rose to $96. Now Wave Y is in play , expecting a final drop to the $55–56 range by mid-April. The red trendline is still not broken. Without a break of this line, no upward move begins. When Wave Y completes, Wave 4 ends. Then Wave 5 begins. Wave 5 target: $150. #XAGUSD #SILVER

English
15
13
148
42.4K
Bullish retweetledi
DeepValue Signals
DeepValue Signals@DVSignals·
$SILVER Conceptual roadmap...
DeepValue Signals tweet media
English
23
12
158
10.8K
Bullish
Bullish@Bullish530184·
@nikutaberuru Browning Citori, Manufactured by Miroku corporation are fine shotguns
Bullish tweet media
English
0
0
1
24
shiro@焼肉たべさせて下さい。
親愛なるアメリカ兄貴たち 日本ではアメリカ製の楽器が 熱狂的に愛されています。 アメリカには日本製の楽器を 愛している人達はいるでしょうか?
日本語
930
32
2.2K
87.4K
Bullish
Bullish@Bullish530184·
@Fintech03 Never give a scientist or engineer the spotlight, they should endure eternal obscurity.
English
0
0
0
490
Parimal
Parimal@Fintech03·
The tank on that truck is the emptiest place in the Solar System :) To keep 100 antiprotons alive for the journey, the vacuum inside the transportable trap has to be 10-100x better than the vacuum of space around the International Space Station. If a single stray molecule of regular H2 leaked into that trap during the drive, the resulting gamma-ray flash would have triggered the sensors instantly. They were literally transporting a portable void.
English
123
434
7.4K
533.3K
Bullish retweetledi
Stoic Silver Bear
Stoic Silver Bear@StoicSilverBear·
#Silver 4hour: Looking like yesterday was a dead-cat bounce at the moment, as the metals continue to trade like risk-on assets until further notice. No definitive breakdown just yet, but I would have liked to have seen a test of the 200dayMA before considering a bottom and we didn't get that yesterday. Bigger picture, it still has to clear the main downtrend (red) to confidently predict the beginning of the next leg up. I don't bearsonally see this war ending so quickly, so until we see silver and gold move with oil and not inversely, it seems most likely that the bottom is not in yet.
Stoic Silver Bear tweet media
Stoic Silver Bear@StoicSilverBear

Thoughts after a brutal week for the metals: #Silver closes the week below the 100-day MA after a bloody Friday but sits just above the series of pivots that held Thursday. While these pivots could hold, it’s impossible to call the bottom with conviction until the red downtrend is cleared. Still a long way to go. If it falls below this week’s low next week, it is likely headed for the rising blue/200-day MA support in the high $50s. I would describe that as highly likely to hold for a weekly close (allowing for a panic washout wick below). So, either this was the bottom, or the next downside target is the high 50s. Complicating the picture now is the distance from weekly cloud support. Having reached these depths, it is hard to imagine price not at least trading sideways for several weeks until it comes closer to the weekly cloud. So, at best, I see extended sideways consolidation before an eventual recovery, even if the initial downtrend is broken. Meanwhile, two interesting ratio charts remain at resistance and might help determine whether this is the bottom of not. I will post those next.

English
4
4
58
17.6K
Bullish retweetledi
DeepValue Signals
DeepValue Signals@DVSignals·
$SILVER That monthly wick / reversal look is not something I would dismiss lightly, especially with MACD still extremely stretched on the higher timeframe... Even after this drop, the market is still only starting to unwind a very extended move... I am still seeing a lot of hopium charts out there getting 200–500 likes... very much #CRYPTO vibes, and that is coming from me as a silver bull. But from a structural point of view, that kind of reaction still looks far too casual to me... A bounce can happen, sure. But a big monthly wick after a vertical move, with momentum that overextended, is not the kind of setup that makes me think “all clear, buy the dip.” It makes me think damage has been done, and lower after the bounce remains the (much) higher-probability path.
DeepValue Signals tweet media
DeepValue Signals@DVSignals

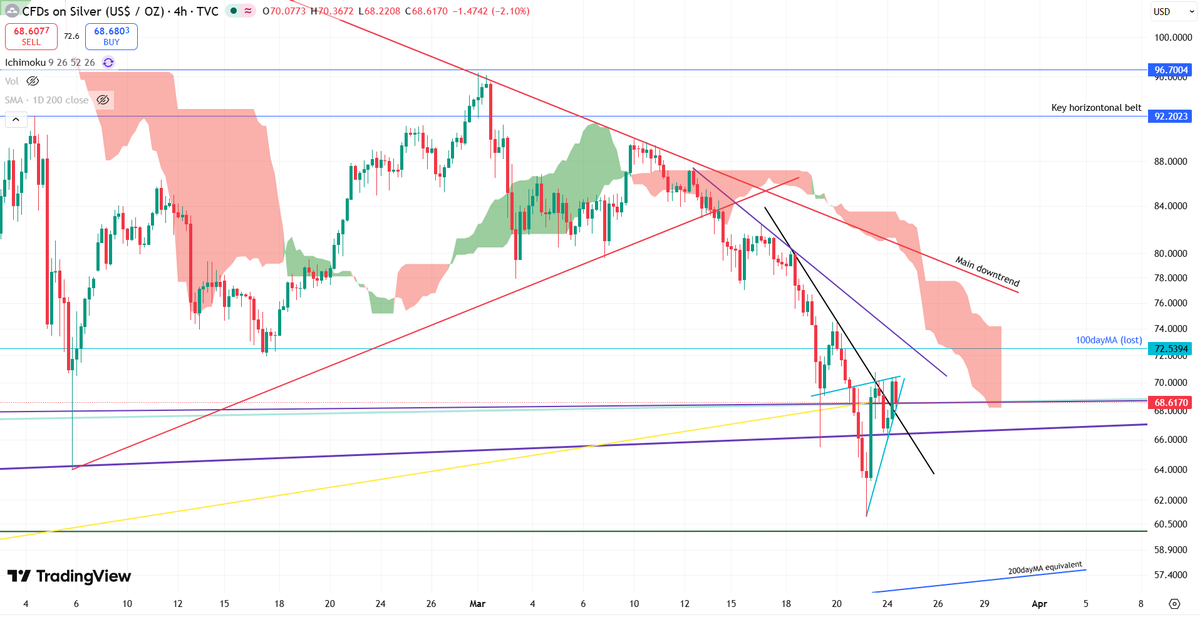
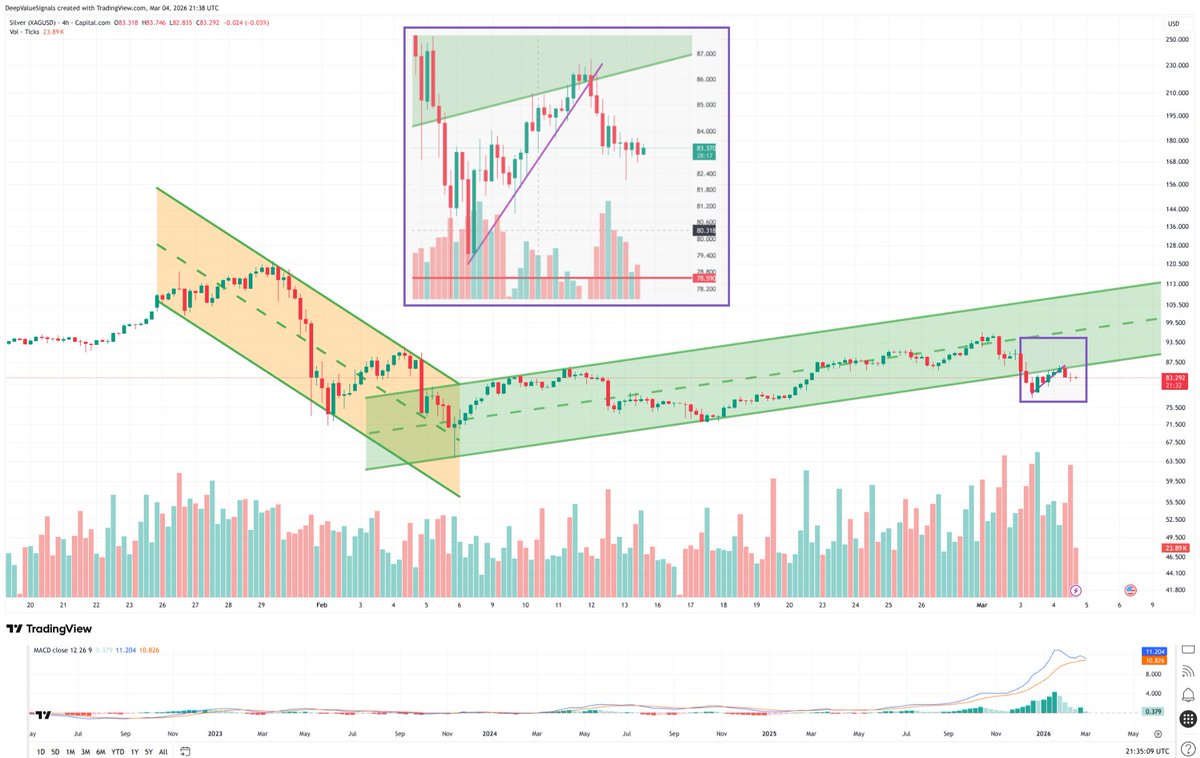
$SILVER I think the key point people are still missing is that just because silver is a long-term bull market, that does not mean every drawdown is a buy-the-dip opportunity. Structural damage has now been done, and once a market loses that kind of key level and momentum, the burden of proof shifts materially.... 
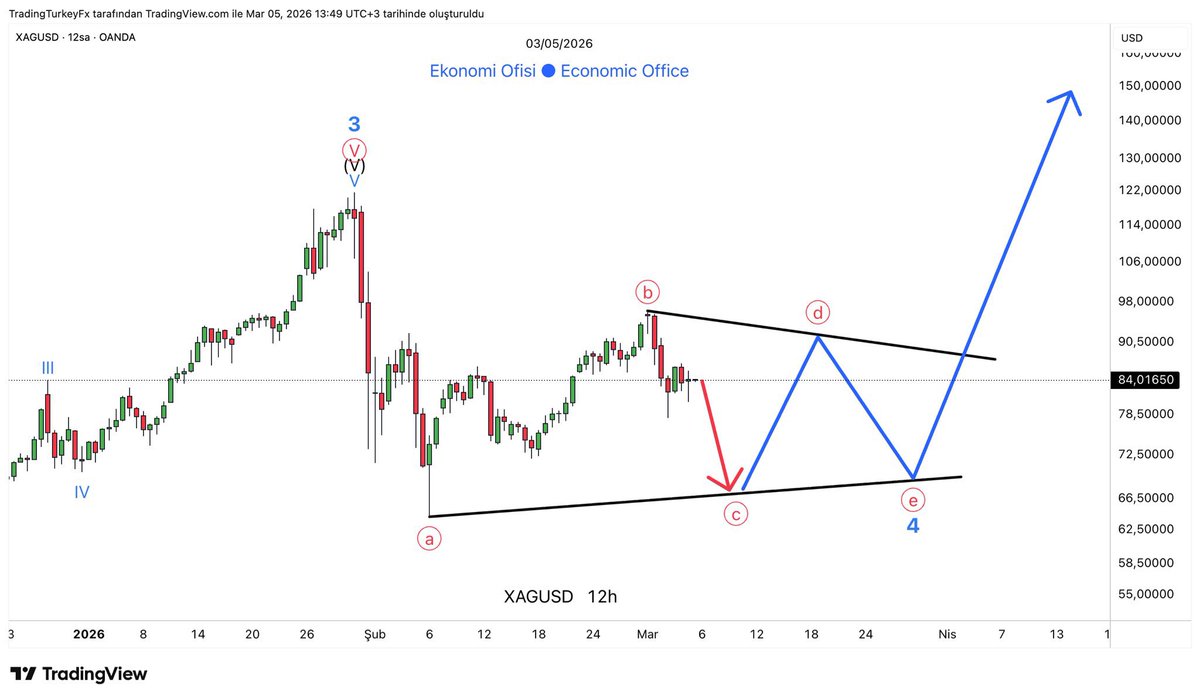
As I mentioned yesterday to subscribers, my updated silver risk roadmap does not actually deviate that much from the one from two-three weeks ago 👇 But there is one additional scenario that, while not my primary, is absolutely still viable and should not be dismissed out of hand... 
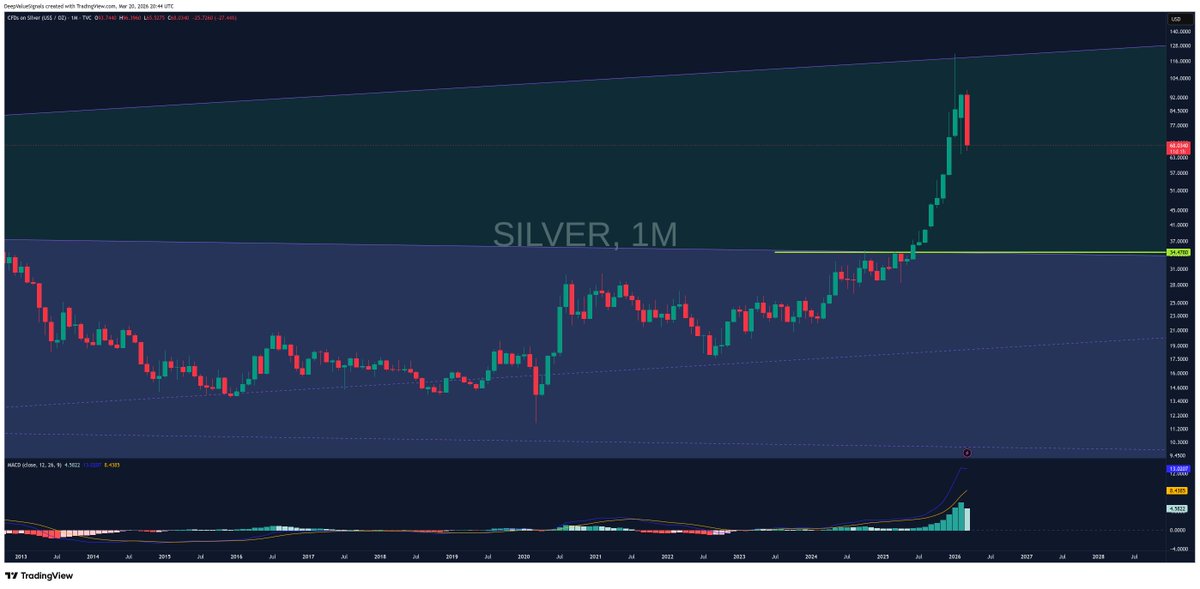
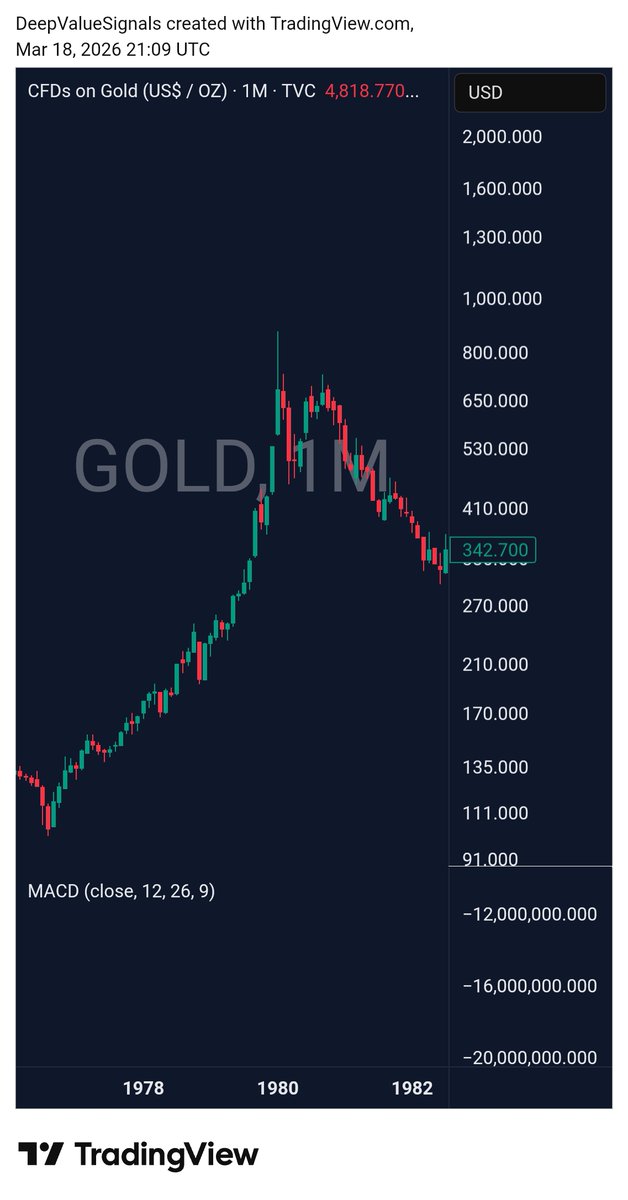
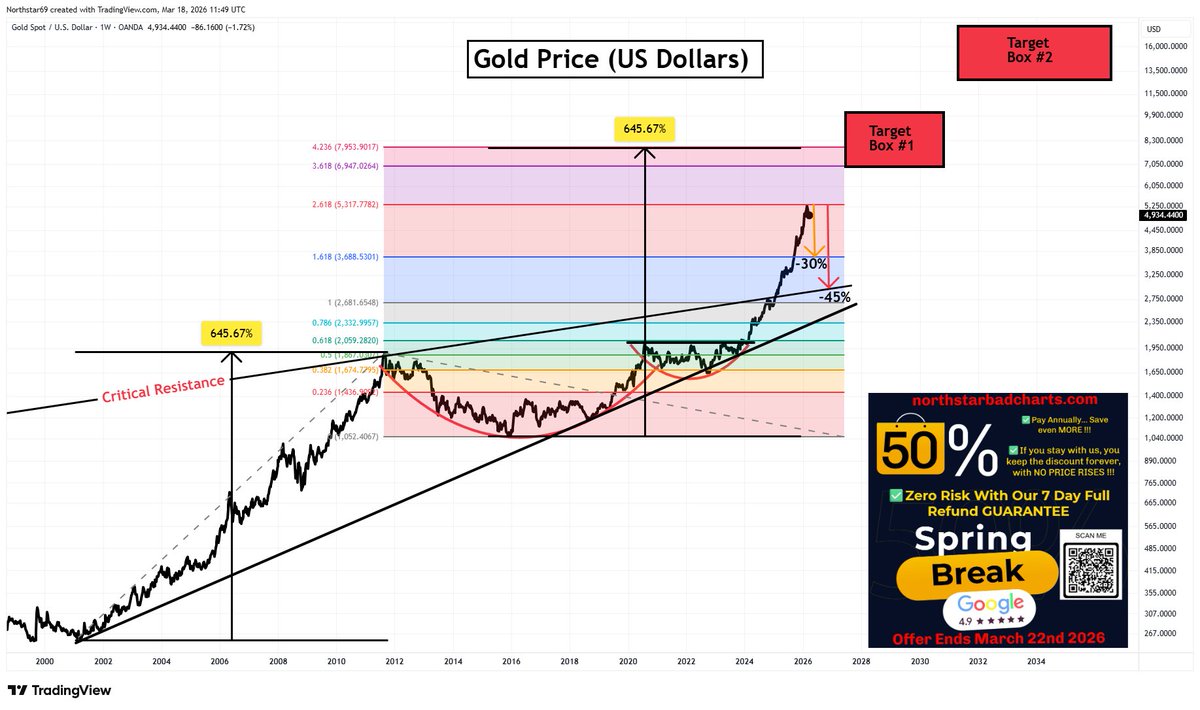
If you take the 2020 low to the 2026 outer high, a perfectly normal Fibonacci retracement points you into roughly the 35 area. And when you combine that with the broader structural backdrop - the 1980 outer wick, the 2011 quarterly/monthly closing zone, and the fact that the real breakout only happened in mid-2025, which is very recent in macro terms - then that 35-ish silver scenario becomes entirely defensible from a technical perspective. So no, I am not saying that is the base case I am betting everything on right here and now. But I am absolutely saying it is NOT a zero-percent scenario. Quite the contrary. It is a real possibility, and one that becomes easier to respect when you look beyond silver itself and study the miners and miner indices, which in many cases still look like they have a long way lower to go before any true reset is complete. That is also why I keep saying: do not confuse a bounce with a bottom.. Yes, after a move like this, we will probably get a bounce at some point; maybe even a sharp one. But a bounce inside a damaged structure is not the same thing as the start of a fresh bullish impulse. And that is where I would strongly disagree with some of the large accounts still presenting this as some kind of obvious dip-buying opportunity. In my opinion, that is far too casual, especially now that we have lost the 72 area and the broader trend has clearly rolled over. Calling that out is no crazier than me calling 72 by month-end a while ago; people laughed at that too.... I still like gold and silver longer term. That has not changed. But in the foreseeable future, I do not think silver’s time is here yet. The trend is down, the chart has taken structural damage, the miners are confirming weakness rather than strength, and while there will almost certainly be tradable bounces, I think the next meaningful move is still more likely lower before higher. deepvaluesignals.substack.com/p/dvs-weekly-u…

English
8
2
68
12.4K
Bullish retweetledi
cape
cape@capexbt·
Gold was the biggest IQ test of 2026 and most people failed it. - Everyone was a gold expert at $5,589. Silence at $4,557. - War in the Middle East and gold is crashing. The safe haven narrative just completely died. - The same people who said “gold to $10,000” can’t explain why it’s falling during a war. When inflation comes from oil and not money printing, gold doesn’t protect you. It punishes you.
English
362
97
1.5K
445.9K
Bullish retweetledi
DeepValue Signals
DeepValue Signals@DVSignals·
$GOLD I partly agree with the 1979/1980 analogy but people are oversimplifying it... 👇🏼 Yes, the geopolitical shock setup is comparable on the surface. No, the macro backdrop is not.... Back then, rates were far higher, policymakers had much more room to tighten, and the monetary regime was fundamentally different. Today, rates are still relatively low in historical terms, debt loads are far heavier, and the system is much less able to absorb that kind of Volcker-style shock. So I do not think a straight copy-paste 1980-style collapse is the base case... That said, dismissing the analogy entirely is also a mistake. If you actually map the 1979–1982 unwind properly, it does not argue for some harmless little dip. It argues that a much deeper retrace than most gold bulls are emotionally prepared for would still be perfectly normal in structural terms. And that is exactly the point people keep missing.... The chart floating around points to roughly $3,900–$4,000 as the first meaningful retrace zone. Fine. That is reasonable as an initial roadmap. But if you apply the historical Fib logic more consistently - using the 1980-style wick-to-wick retracement framework - you can absolutely justify something much closer to $3,000, which lines up very closely with the $2,800–$2,850 deeper retrace zone I posted earlier and which some people were laughing at.... They may not be laughing for long. So my view is simple: 1979 is useful as a roadmap, but dangerous as a lazy one-liner. I do not expect gold to replay the exact same path, with the same sideways churn and the same policy-driven collapse dynamics. The macro regime is too different for that. But I do think the historical analogy is a very useful reminder of one thing.. Parabolic moves can unwind a lot further than the crowd thinks, while still remaining completely normal within a secular bull market. So yes, $3,900–$4,000 makes sense as a first major retrace area. But no, that does not mean the downside automatically stops there. A flush toward $3,000 - even $2,800–$2,850 - would look insane to most participants right now, which is precisely why it remains plausible. History does not say it must happen. But it absolutely says people are far too complacent in assuming it cannot. Structure first. Narrative second.
DeepValue Signals tweet media
DANNY@Danny_Crypton

GOLD is repeating the 1979 setup, when there was a sharp DUMP!! Same chart, 50 years apart.. 1979: Iran war → oil 2x price → chaos and dump 2026: Iran war → oil 2x price → (we are here) I created a pre-dump GOLD trading guide using AI based on OpenClaw.. All you need: a phone + Claude + 1 hour a day (free) To join: • Comment "Gold" • Like and Retweet Same pattern. Same setup. History doesn't repeat but it rhymes. (Must follow me so I can send you a DM, good luck)

English
14
6
63
19K
Bullish retweetledi
Cynthia Holt
Cynthia Holt@Ghostofcynthia·
We’ve sunk so fucking low that getting our elections even remotely secure now means groveling and begging a bunch of corrupt, self serving pieces of shit in the Senate to do the absolute bare minimum. Like passing basic voter ID that a massive majority of Americans want. That pathetic reality alone should make your blood boil and prove just how rotten and bought off the whole goddamn system is. These assholes would rather protect their rigged game than protect the country and we’re the idiots still pretending they give a single fuck about the Republic or We the people.
English
1.9K
12.1K
45K
840.7K
Bullish retweetledi
Economic Office
Economic Office@Economic_Office·
From $121 to $84. What is happening in silver is not a coincidence. The structural correction is exactly where it should be. Wave 3 has finished, and the Wave 4 triangle correction is continuing. Wave (b) turned from $96, and now we are inside Wave (c). The price will remain compressed inside this triangle and move sideways for a while. Energy is building up. As long as the $64–67 range holds, the structure remains solid. Once the triangle is completed, Wave 5 begins and our target is clear — $150+. We do not recommend taking positions before the structure is completed. #XAGUSD #SILVER
Economic Office tweet media
Economic Office@Economic_Office

We mapped out silver’s roadmap to $150. We are now exactly at the point we planned. In the analysis we shared earlier, we said the price would move sideways for a while and rest. That is exactly what is happening. The price turned from $96 and is currently moving downward. The only level we need to pay attention to here is the $64–67 zone. As long as the price stays above this region, there is no problem — it is just resting. When this resting phase is over? The target is clear — $150+. But there is no rush. We do not take positions before the structure is completed. #XAGUSD #SILVER

English
28
53
416
138.1K
Bullish retweetledi
DeepValue Signals
DeepValue Signals@DVSignals·
$SILVER Following up on what was probably the most important silver chart you saw yesterday, this one might be the most important you’ll see all week... The 4h structure plus the 15-min inset and the weekly MACD (added at the bottom) all point the same way: this looks like a roll-over, not the start of the vertical moonshot that people like Michael Oliver or @garysavage1 keep talking about. My two big calls around Christmas and right before the late-Jan crash were spot on – this is my third, and it says we likely need one more low first. I already flagged this in last week’s Substack: I don’t do binary “$150 or bust” calls, I read structure, and right now the structure is arguing against an imminent blast-off... If this resonates, please share/RT so people at least have the chance to protect with some longer-dated hedges while keeping their core silver exposure.. after all, you carry health insurance too, right?
DeepValue Signals tweet media
English
24
32
219
27.7K
John
John@market_sleuth·
She arrived today from Tokyo. These are so rare it took awhile to find one. It’s an Onkyo Integra 508 stereo amp built in 1986. This one doesn’t have a scratch, as new. 200 watts per channel with virtually no detectable distortion. Weighs 60lbs! My speakers are going to love it.
John tweet media
English
632
301
8.3K
211.1K
Bullish retweetledi
The Great Martis
The Great Martis@great_martis·
S&P 500 This could get ugly real quick. Eyes on the 6800 level. Money flow was warning. Stay vigilant.
The Great Martis tweet media
English
65
137
1.1K
89.4K
Bullish retweetledi
The Great Martis
The Great Martis@great_martis·
Where is silver and gold heading?✨ The most populus question of them all. My answer to this conundrum : Below are the monthly charts of gold and silver, and beneath them are their monthly RSI levels. Even though gold and silver can head higher, the monthly RSI levels will need to cool off substantially before the next major leg higher begins. This coincides with the potential and somewhat severe market sell-off I am expecting. Your truly, The GREAT Martis ✨
The Great Martis tweet media
English
96
97
899
66.3K
Bullish retweetledi
Bullish retweetledi
Mike Investing
Mike Investing@MrMikeInvesting·
A generational short opportunity for $SPY is upcoming soon… All indicators have aligned for an upcoming 10-12% correction on $SPY to $620. The last time, I spotted a similar to this was February 2025 right before $SPY crashed -20%. Instead of panicking use this opportunity to hedge, & reposition your portfolio into strong, & stable picks. Save this to look back on later…
Mike Investing tweet media
English
91
115
831
106.8K
Bullish retweetledi
John
John@market_sleuth·
$SPY is at $686 ish AH. If it closes below $690 tomorrow the 50 / 20 dma death cross occurs. This is a very reliable (but not foolproof) signal of a likely significant corrective move in the near future. Chart from @MichaelPBento. 🚧
John tweet media
English
12
66
920
55K
Bullish retweetledi
Patrick Karim
Patrick Karim@badcharts1·
Silver reacting on a possible 45 year rising support line. I would be cautious until we get the quarterly close. $20000 Gold and $800 Silver end game targets of are likely to be found after that.
Patrick Karim tweet media
English
36
129
871
56.7K