

Connor Deitrich
75.3K posts
Connor Deitrich
@CDeitrich22
Mostly sports and politics. Opinions are my own, retweet =/= endorsement
Katılım Mart 2012
803 Takip Edilen1K Takipçiler

I'm actually in awe of how many great films came out in 1995 alone.
Might be the hardest year to sort your top 3.

LT Jonathan Kendrick@PlisskenPatriot
Best movies of the 1990s by year: 1990: Goodfellas 1991: Terminator 2: Judgement Day 1992: Scent of a Woman 1993: Tombstone 1994: Pulp Fiction 1995: Heat 1996: Primal Fear 1997: Boogie Nights 1998: American History X 1999: Fight Club Thoughts?
English
@RandomNBAFan27 @JoshEberley We sure he’s the best from that movie?
English

@JoshEberley But Russell Crowe is the best performance out of 4 movies
English

My hot take is that Collateral is the best overall movie here
Cinema Connoisseur@MovieEndorser
My Top 4 Michael Mann Films Heat Collateral The Insider Thief
English
@JonahLupton ONDS META RDDT V TMDX HIMS GOOG AMZN (prob soon selling those last two for AMBA and more HIMS)
English

I’m not logged into our OMS but I’m relatively confident our next 5+ largest holdings are $HYNIX $FPS $NU $DRAM $MP $ONDS $SE
What does everyone else have in their top 10-15 holdings?
Jonah Lupton@JonahLupton
Every couple of months I post our top positions at @FirstWaveFund and since we sent our May investor letter a few days ago I don’t mind sharing those positions... here are the top 12 in alphabetical order: AAOI, ALAB, APP, CRDO, HIMS, HROW, IREN, MELI, MU, NBIS, RDDT, TMDX All estimates are my own. Every company mentioned in this post has risks so please do your own research and form your own opinions, thesis and conviction. Please don't waste your time asking me where I'd be buying or trimming... because I won't answer. I spend alot of time building our models and thinking through all the possible variables and catalysts that will impact the reported financials but in reality trying to predict revenues, margins, dilution and earnings in CY2028 or FY2029 is not easy. $AAOI CY2025 revenues = $455M CY2028 revenues = $10.70B 3 year revenue CAGR = 186% CY2025 EPS = -$0.26 CY2026 EPS = $1.04 CY2028 EPS = $10.40 2 year EPS CAGR from CY2026 through CY2028 = 216% Currently trading at 15.6x CY2028 EPS (not including cash/debt) $ALAB CY2025 revenues = $852M CY2028 revenues = $3.88B 3 year revenue CAGR = 66% CY2025 EPS = 1.84 CY2028 EPS = $8.55 3 year EPS CAGR = 67% Currently trading at 48.7 CY2028 EPS (not including cash/debt) $APP CY2025 revenues = $5.48B CY2028 revenues = $16.67B 3 year revenue CAGR = 45% CY2025 EPS = $10.64 CY2028 EPS = $37.06 3 year EPS CAGR = 52% Currently trading at 12.6x CY2028 EPS (not including cash/debt) $CRDO FY2025 revenues = $436M FY2028 revenues = $4.11B 3 year revenue CAGR = 111% FY2025 EPS = $0.70 FY2028 EPS = $10.68 3 year EPS CAGR = 148% Currently trading at 25.5x FY2028 EPS (not including cash/debt) $HIMS CY2025 revenues = $2.35B CY2028 revenues = $5.81B 3 year revenue CAGR = 35% CY2025 EPS = $1.10 CY2028 EPS = $2.55 3 year EPS CAGR = 32% Currently trading at 13.9x CY2028 EPS (not including cash/debt) $HROW CY2025 revenues = $272M CY2028 revenues = $928B 3 year revenue CAGR = 50% CY2025 EPS = -$0.14 CY2026 EPS = $1.09 CY2028 EPS = $5.64 2 year EPS CAGR = 127% Currently trading at 7.6x CY2028 EPS (not including cash/debt) $IREN FY2025 revenues = $510M FY2028 revenues = $6.60B FY2029 revenues = $9.88B 4 year revenue CAGR = 110% FY2025 EPS = $0.35 FY2028 EPS = $0.68 FY2029 EPS = $1.33 4 year EPS CAGR = 40% Currently trading at 45.1x FY2028 EPS (not including cash/debt) $MELI CY2025 revenues = $28.89B CY2028 revenues = $65.81B 3 year revenue CAGR = 32% CY2025 EPS = $39.40 CY2028 EPS = $90.14 3 year EPS CAGR = 32% Currently trading at 18.1x CY2028 EPS (not including cash/debt) $MU FY2025 revenues = $37.38B FY2028 revenues = $274.18B 3 year revenue CAGR = 94% FY2025 EPS = $8.29 FY2028 EPS = $151.32 3 year EPS CAGR = 163% Currently trading at 7.5x FY2028 EPS (not including cash/debt) $NBIS CY2025 revenues = $530M CY2028 revenues = $22.83B 3 year revenue CAGR = 250% CY2028 EPS = $5.42 CY2031 EPS = $23.96 Currently trading at 47.8x CY2028 EPS (not including cash/debt) 3 year EPS CAGR from CY2028 through CY2031 = 64% $RDDT CY2025 revenues = $2.20B CY2028 revenues = $6.24B 3 year revenue CAGR = 42% CY2025 EPS = $4.54 CY2028 EPS = $14.15 3 year EPS CAGR = 46% Currently trading at 12.3x CY2028 EPS (not including cash/debt) $TMDX CY2025 revenues = $605M CY2028 revenues = $1.34B 3 year revenue CAGR = 30% CY2025 EPS = $2.63 CY2028 EPS = $6.33 3 year EPS CAGR = 34% Currently trading at 12.4x CY2028 EPS (not including cash/debt) NFA. DYOR. *I own all of these stocks personally and so does @FirstWaveFund **If you see any glaring mistakes in my numbers feel free to comment below and I'll double check my work/models. ENJOY THE LONG WEEKEND. GO SOCCER!!!!!
English
@JonahLupton @FirstWaveFund Now new to finance. Have a finance degree, passed two levels of CFA, understand the different metrics and things to look at. Just don’t know how to start from square 1
English
@JonahLupton @FirstWaveFund How do you recommend getting into research for someone new to it? Pick a company, read recent reports/listen to earnings calls?
English
Every couple of months I post our top positions at @FirstWaveFund and since we sent our May investor letter a few days ago I don’t mind sharing those positions... here are the top 12 in alphabetical order:
AAOI, ALAB, APP, CRDO, HIMS, HROW, IREN, MELI, MU, NBIS, RDDT, TMDX
All estimates are my own. Every company mentioned in this post has risks so please do your own research and form your own opinions, thesis and conviction. Please don't waste your time asking me where I'd be buying or trimming... because I won't answer.
I spend alot of time building our models and thinking through all the possible variables and catalysts that will impact the reported financials but in reality trying to predict revenues, margins, dilution and earnings in CY2028 or FY2029 is not easy.
$AAOI
CY2025 revenues = $455M
CY2028 revenues = $10.70B
3 year revenue CAGR = 186%
CY2025 EPS = -$0.26
CY2026 EPS = $1.04
CY2028 EPS = $10.40
2 year EPS CAGR from CY2026 through CY2028 = 216%
Currently trading at 15.6x CY2028 EPS (not including cash/debt)
$ALAB
CY2025 revenues = $852M
CY2028 revenues = $3.88B
3 year revenue CAGR = 66%
CY2025 EPS = 1.84
CY2028 EPS = $8.55
3 year EPS CAGR = 67%
Currently trading at 48.7 CY2028 EPS (not including cash/debt)
$APP
CY2025 revenues = $5.48B
CY2028 revenues = $16.67B
3 year revenue CAGR = 45%
CY2025 EPS = $10.64
CY2028 EPS = $37.06
3 year EPS CAGR = 52%
Currently trading at 12.6x CY2028 EPS (not including cash/debt)
$CRDO
FY2025 revenues = $436M
FY2028 revenues = $4.11B
3 year revenue CAGR = 111%
FY2025 EPS = $0.70
FY2028 EPS = $10.68
3 year EPS CAGR = 148%
Currently trading at 25.5x FY2028 EPS (not including cash/debt)
$HIMS
CY2025 revenues = $2.35B
CY2028 revenues = $5.81B
3 year revenue CAGR = 35%
CY2025 EPS = $1.10
CY2028 EPS = $2.55
3 year EPS CAGR = 32%
Currently trading at 13.9x CY2028 EPS (not including cash/debt)
$HROW
CY2025 revenues = $272M
CY2028 revenues = $928B
3 year revenue CAGR = 50%
CY2025 EPS = -$0.14
CY2026 EPS = $1.09
CY2028 EPS = $5.64
2 year EPS CAGR = 127%
Currently trading at 7.6x CY2028 EPS (not including cash/debt)
$IREN
FY2025 revenues = $510M
FY2028 revenues = $6.60B
FY2029 revenues = $9.88B
4 year revenue CAGR = 110%
FY2025 EPS = $0.35
FY2028 EPS = $0.68
FY2029 EPS = $1.33
4 year EPS CAGR = 40%
Currently trading at 45.1x FY2028 EPS (not including cash/debt)
$MELI
CY2025 revenues = $28.89B
CY2028 revenues = $65.81B
3 year revenue CAGR = 32%
CY2025 EPS = $39.40
CY2028 EPS = $90.14
3 year EPS CAGR = 32%
Currently trading at 18.1x CY2028 EPS (not including cash/debt)
$MU
FY2025 revenues = $37.38B
FY2028 revenues = $274.18B
3 year revenue CAGR = 94%
FY2025 EPS = $8.29
FY2028 EPS = $151.32
3 year EPS CAGR = 163%
Currently trading at 7.5x FY2028 EPS (not including cash/debt)
$NBIS
CY2025 revenues = $530M
CY2028 revenues = $22.83B
3 year revenue CAGR = 250%
CY2028 EPS = $5.42
CY2031 EPS = $23.96
Currently trading at 47.8x CY2028 EPS (not including cash/debt)
3 year EPS CAGR from CY2028 through CY2031 = 64%
$RDDT
CY2025 revenues = $2.20B
CY2028 revenues = $6.24B
3 year revenue CAGR = 42%
CY2025 EPS = $4.54
CY2028 EPS = $14.15
3 year EPS CAGR = 46%
Currently trading at 12.3x CY2028 EPS (not including cash/debt)
$TMDX
CY2025 revenues = $605M
CY2028 revenues = $1.34B
3 year revenue CAGR = 30%
CY2025 EPS = $2.63
CY2028 EPS = $6.33
3 year EPS CAGR = 34%
Currently trading at 12.4x CY2028 EPS (not including cash/debt)
NFA.
DYOR.
*I own all of these stocks personally and so does @FirstWaveFund
**If you see any glaring mistakes in my numbers feel free to comment below and I'll double check my work/models.
ENJOY THE LONG WEEKEND.
GO SOCCER!!!!!
Jonah Lupton@JonahLupton
Some of you know that I launched a hedge fund several months ago (early November). We run a long/short strategy, focused on owning the 20-40 growth stocks that we believe have the most upside over the next 2-3 years... this means they need to have great fundamentals, strong management teams, compelling valuations, and multiple catalysts that we can identify and track accordingly. It's been a rough few months for many growth investors (we also took some pain)... thankfully we were averaging down into our core positions but we've still seen some red months and it has not been enjoyable. I'm not a fan of losing money. Stepping back... I've never had more conviction in my process or my portfolio than I do right now... especially with some of my favorite stocks down 20-40% from their September/October/November highs despite strong Q4 earnings reports, strong CY2026 guidance and extremely compelling valuations. With that said, here are our top 10 positions in alphabetical order: $APP $CPNG $CRDO $HIMS $HROW $SKHYNIX $IREN $NBIS $RDDT $TMDX I believe all of these stocks are trading at meaningfully higher prices in 2-3 years which remains my focus for generating outsized long-term returns. Enjoy the rest of your day 😊 NFA. DYOR. ** @FirstWaveFund owns all of the stocks mentioned in this post.
English
@JonahLupton @TheShortBear Curious your thoughts. I don’t understand tech very well but trying to do some digging/learning myself
English

@JonahLupton @TheShortBear Figured the growth numbers wouldn’t interest you but thought the company/industry might
English
$NBIS is still our favorite neocloud / ai data center name but some of the other ones definitely look interesting… the fun part is trying to figure out who will announce the next big deal, capturing the pop then debating whether to sell before the eventual dilution announcement in hopes of buying it back cheaper.
…. after $NBIS we own $IREN $CIFR $APLD $KEEL $SHAZ $DGXX $BRUN
Still digging into $CLSK $GLXY $RIOT and several others.
We’re obviously bullish on power and compute… and if you are then you also need exposure to chips, memory and optics
English
@MBajc23 @JonahLupton And we know Elon would never over promise and under deliver
English

@CDeitrich22 @JonahLupton While assuming 58% annualized top line growth for the next 4 years lol
English
As everyone knows, $SPCX (SpaceX) went public today in a $1.75 trillion IPO... with the stock up ~20% it puts the market cap above $2 trillion.
Sell side estimates are starting to post and this is what we have so far for the next 4+ years...
2026:
Revenues = $33.3B
Ebitda = $561M
2027:
Revenues = $59.6B
Ebitda = $8.8B
2028:
Revenues = $81.9B
Ebitda = $18.6B
2029:
Revenues = $139.3B
Ebitda = $73.7B
2030:
Revenues = $207.6B
Ebitda = $116.6B
That's some crazy growth if it happens.
English

@CDeitrich22 It’s a cheat code brother !
Hope you’re doing good my man
English
Yall just making up lies when it comes to fitness and diet on here lol
Luka@nivholls
Maturing is realising these mf's do more harm than good.
English
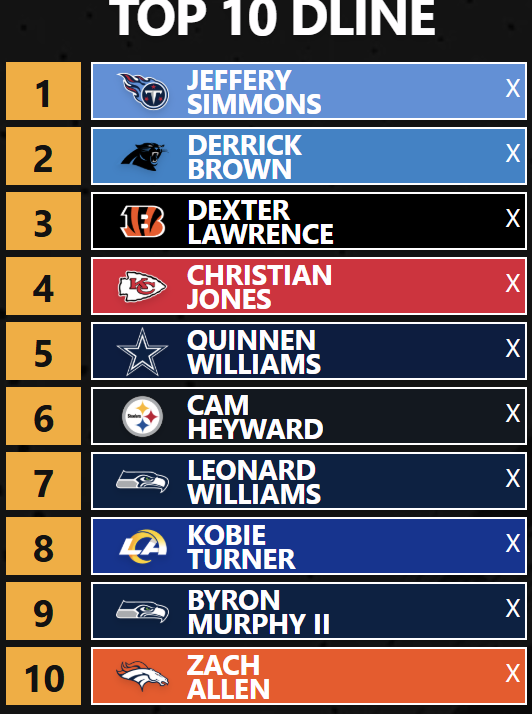
Linemen (Guards and centers combined for this list)


English
I'm bored so here's the best player's in the nfl by position in my opinion
Offensive Skill


English
Certainly one of the quotes of all time
Mike J. Asti@MikeAsti11
What Steelers reporter @FarabaughFB told me on "Mike Drop" about the noticeable differences in how Mike McCarthy is running things compared to Mike Tomlin: "Totally different vibe. It's a very different style of practice. It's a very different thing. The personalities at coach, obviously very different. Mike T [Tomlin], obviously a very different person than Mike McCarthy. It's totally different.
English

Name a movie everyone loves but you just couldn’t connect with.
English


@cperruna Thoughts on Google valuation? Thoughts on Waymo as a threat to Uber?
English

TTM Net Income in Long Portfolio:
Google $GOOGL: $160 Billion
Nvidia $NVDA: $159 Billion
Microsoft $MSFT: $125 Billion
Apple $AAPL: $123 Billion
Amazon $AMZN: $91 Billion
Meta $META: $71 Billion
Visa $V: $22 Billion
Uber $UBER: $9 Billion
One Year Stock Performance:

English

10 Movies That Made 2007 a Great Year For Cinema according to Movieweb.

English