CambridgeIntel

3.9K posts

CambridgeIntel banner
CambridgeIntel

CambridgeIntel

@CambridgeIntel

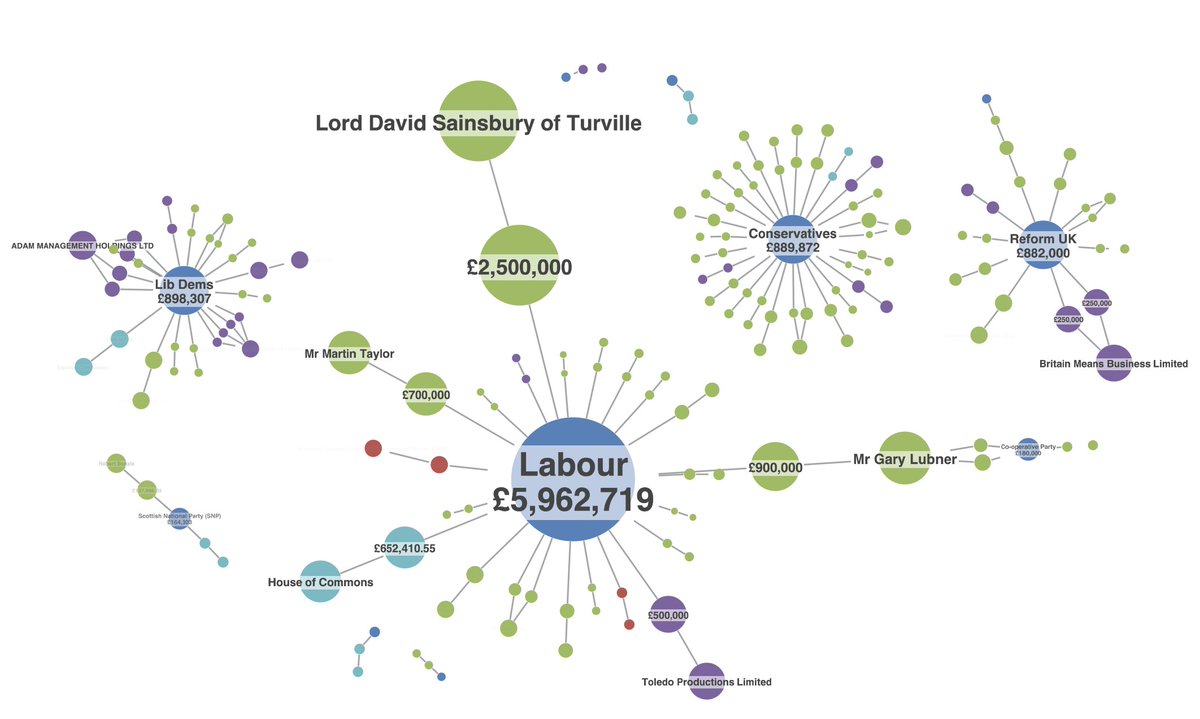
Cambridge Intelligence builds data visualization toolkits that make the world a safer place.

Cambridge, UK & Boston, USA Katılım Nisan 2011
619 Takip Edilen1.2K Takipçiler
Sabitlenmiş Tweet
CambridgeIntel
CambridgeIntel@CambridgeIntel·
Thanks for stopping by! We're no longer active here. Connect with us on LinkedIn for our latest company news and #DataViz insights, or visit our website using the link in our bio. hubs.li/Q02LrtrY0
English
0
0
0
186
CambridgeIntel
CambridgeIntel@CambridgeIntel·
We’ve built KronoGraph’s timeline visualization software development kit to work in any environment, as part of any tech stack. Fancy a free trial? hubs.li/Q02KNrFN0
English
0
0
0
99
CambridgeIntel
CambridgeIntel@CambridgeIntel·
Let's look at the #LinkAnalysis techniques successful organizations use to: 👥 Find hidden social connections in a criminal investigation 🔎 Uncover illegal activity in complex money flows 🤖 Communicate AI-driven insights to human decision-makers hubs.li/Q02KNrST0
CambridgeIntel tweet media
English
0
0
0
69
CambridgeIntel
CambridgeIntel@CambridgeIntel·
Looking to get your career in tech off to a flying start? hubs.li/Q02JSRpq0 Our graduate roles give STEM grads an accelerated route into the software industry. You’ll get to skip the corporate scrum, and experience all aspects of life in a growing technology company.
English
0
0
0
43
CambridgeIntel
CambridgeIntel@CambridgeIntel·
A good layout can make or break a graph visualization: hubs.li/Q02HMsrZ0 Take a tour of the automatic graph layouts available in KeyLines and ReGraph, including a deeper dive into our organic layout - specially designed to help you make sense of the largest graph datasets.
English
0
0
2
46
CambridgeIntel
CambridgeIntel@CambridgeIntel·
#LinkAnalysis has applications across countless industries, but there are six reliable techniques we come across time and again. hubs.li/Q02JlD-Z0 From follow the money to social network analysis, is your use case covered?
CambridgeIntel tweet media
English
0
0
1
46
CambridgeIntel
CambridgeIntel@CambridgeIntel·
The 2018 poisoning of Sergei and Yulia Skripal in Salisbury UK resulted in the tragic death of one person and left four people critically injured. We analyze a visual timeline of connections between suspects, victims and police officers: hubs.li/Q02HB6qj0
GIF
English
3
0
0
137
CambridgeIntel
CambridgeIntel@CambridgeIntel·
We hope you're enjoying #TrustCon2024 as much as our representative, Paige Hollier. She's had many interesting conversations about platform safety and the importance of making #DataVisualization part of the solution. Do say hi if you see her!
CambridgeIntel tweet media
English
0
0
0
54
CambridgeIntel
CambridgeIntel@CambridgeIntel·
With our latest #GraphVisualization SDK versions, you can add images to node labels to make them more meaningful, instantly recognizable and unique. We've also updated our getting started tutorials to use open-source build tool Vite. Find out more: hubs.li/Q02GVMPJ0
CambridgeIntel tweet media
English
0
0
0
43
CambridgeIntel
CambridgeIntel@CambridgeIntel·
🎉 KronoGraph 3.0 has landed! 🎉 It’s time to dig into the major new version, which brings smart new ways to present complex timeline data. Take a look here 👉 hubs.li/Q02GHWZ80
English
0
0
2
121
CambridgeIntel
CambridgeIntel@CambridgeIntel·
We’ve been carbon neutral since June 2019, and over-compensated for our 2022/23 emissions by almost 30%. We're still focused on our goal to be net zero by 2030 - read more about our journey: hubs.li/Q02Gn6bw0
English
0
0
0
52
CambridgeIntel
CambridgeIntel@CambridgeIntel·
Back in 2021, we made some big climate commitments. Key among them was to be #NetZero by 2030. Like many organizations on the road to net zero, we’ve encountered some bumps, but we're working hard to reach our goal. Read our 2023 update over here: hubs.li/Q02DGvFb0
CambridgeIntel tweet media
English
0
0
0
52
CambridgeIntel
CambridgeIntel@CambridgeIntel·
Are you an SEO pro, ready to take the lead on your own strategy? As our in-house expert, you’ll get freedom to experiment with new CMS and PPC tactics, while immersing yourself in the constantly evolving world of #DataVisualization. hubs.li/Q02DmRhQ0 #CambridgeJobs
CambridgeIntel tweet media
English
0
0
0
38
CambridgeIntel retweetledi
Phil Rodgers
Phil Rodgers@PhilRodgers·
Donations reported by political parties in the first two weeks of the campaign (30 May to 12 June) - week 2's data has just been published. Green = individual donations, purple = companies, red = trade unions, light blue = public money. Labour streets ahead of the others.
Phil Rodgers tweet media
English
3
6
11
2.4K
CambridgeIntel
CambridgeIntel@CambridgeIntel·
With ReGraph, visualizing Neo4j graph data as easy as 1, 2, 3: hubs.li/Q02CbFFG0 Our updated tutorial, authored by graph expert and commercial developer Kavita, guides you through a three-step process to visualize your #Neo4j graph data with ReGraph.
CambridgeIntel tweet media
English
0
0
1
61