Kevin Steel

88 posts

Kevin Steel banner
Kevin Steel

Kevin Steel

@Cardio11

Cardiopixel artist, heart doc on the side

Texas Katılım Ağustos 2010
119 Takip Edilen81 Takipçiler
Kevin Steel
Kevin Steel@Cardio11·
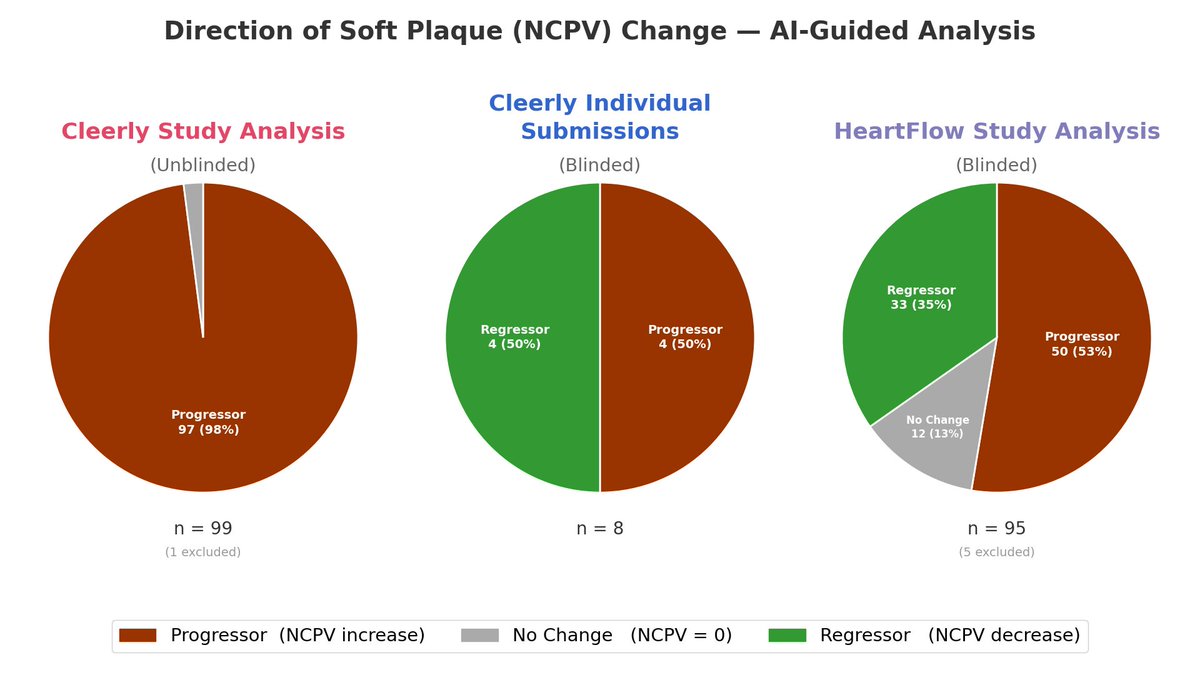
@realDaveFeldman There is a third vendor for AI plaque analysis which is FDA approved besides Heartflow and Cleerly which could add another layer of confidence (CVQuant, Circle CVI). The human in the loop who validates the plaque data matters, their skill set and background.
English
0
0
0
154
Dave Feldman
Dave Feldman@realDaveFeldman·
I want to share a crucial update on our study, KETO-CTA. (The video for this article is in the next tweet) Our study recruited 100 participants, each undergoing two high-resolution heart scans, known as CT angiograms, one year apart. (For more background on this study design, see preprint in the following tweet) There are now four analyses of those same 200 scans. But one of those analyses stands out — and I have some new developments to report. For a quick background, the first quantitative analysis was from an AI company, Cleerly. We published their analysis of our scans last year. After the paper was published, the Citizen Science Foundation was free to look at the raw Cleerly data, and we found a number of patterns that appeared different from what is typically seen in other coronary plaque studies. For example, in Cleerly's analysis, not one of the participants showed lower plaque levels at follow-up — even though CTA scans typically show some natural variation in both directions, especially in people who start with very little plaque. For another example within their data, people with no detectable calcium in their scans appeared to have several times more plaque progression than those who already had some calcium present. This runs counter to what many in cardiology call the "power of zero" — the well-established finding that having no coronary calcium is typically associated with lower risk and slower disease progression. Another major development: shortly after publication, we learned that the scans Cleerly was analyzing were not fully blinded. In studies like this, the order of scans is typically kept unknown to the analyst to help prevent any potential for bias. But in this case, the chronological order was available in the scans. We therefore asked Cleerly to repeat their analysis using a properly blinded set of scans, which is standard practice in longitudinal studies. Cleerly declined to perform a blinded reanalysis. Because of this, we commissioned an additional, independent analysis from Heartflow. Heartflow has been a leader in this space and is the most extensively validated AI platform for coronary CTA analysis. The Heartflow analysis was conducted with full operational blinding and completed right before the prespecified third, and final quantitative analysis, which uses Medis QAngio. These two independent platforms were consistent with each other, yet both differed substantially from the Cleerly results. As these independent results became available, we shared them privately with Cleerly and again requested a blinded reanalysis of their original work. We offered to cover any costs involved just in case this was the barrier to reanalysis. Cleerly again declined. However, a new development emerged. Several participants requested their scans from the study and submitted them directly through their own, personal cardiologist. Any cardiologist with a proper Cleerly account can appropriately submit scans on their patient's behalf. So in a sense, our participants themselves were able to provide a portion of the blinded analysis we were originally requesting. This was then shared with me on behalf of the Citizen Science Foundation. In total, there are 19 of these individual submissions — about 10% of the total scans in our study so far. Individual Submissions vs. Study Data We focused on the 8 participants who have both a baseline and a follow-up individual submission of their scans (the other 3 submissions are unpaired). [Please Note: These data are preliminary] Figure 1 compares the change in soft plaque (Non-Calcified Plaque Volume or NCPV) reported by the original Cleerly study analysis against the results from each participant's individual submission. [See Figure 1] Of the 8 participants, four showed an increase in soft plaque in both datasets — but in three of those four cases, the individual submissions reported substantially less progression than the study data. The remaining four participants all showed progression in the study data, yet every one of their individual submissions showed a decrease — a complete reversal of direction. The largest discrepancy was a single participant whose study data reported an increase of 32 mm³, while their individual submission showed a decrease of 48 mm³ — a reversal of approximately 80 mm³. The median change in soft plaque for these 8 participants was +20.6 mm³ (a 31% increase) in the original study data, compared to just +0.7 mm³ (about a 2% increase) from their individual submissions (Figure 2). The mean average is even more pronounced: the study data shows an average increase of +20.9 mm³ (42% from baseline), while the individual submissions show an average decrease of 5.1 mm³ (an 8% decline). In other words, the study data says plaque went up; the individual submissions say it went down (Figure 3). Direction of Change Across Platforms To put these individual submissions in broader context, Figure 4 compares the direction of soft plaque change across three analyses of these same scans. On the left is the original Cleerly study analysis — 99 participants after excluding one who had a procedure between scans. 98% showed an increase in soft plaque. Only 2 showed no change. Zero showed regression. In the middle are the 8 individual submissions, split right down the middle: 50% showing progression and 50% showing regression. On the right is the full Heartflow analysis across 95 participants. While 8 is a small sample size, the direction-of-change in these individual submissions is far closer to the Heartflow analysis than the original Cleerly analysis. It is worth emphasizing: 4 out of the 8 participants — fully half — received individual submission results showing less plaque in their second scan than their first. But after accounting for the single exclusion mentioned above, not one of the 99 participants in the original Cleerly study analysis showed plaque regression. We are not sure what happened with the original Cleerly analysis. We just know the other analyses are largely consistent with each other — and now, that includes these individual submissions to Cleerly as well. Next Steps We have already taken steps regarding last year's paper that contained the original Cleerly analysis. We are working with the journal on that now, and we expect news on this very soon. In the meantime, the preprint of our current paper with both Heartflow and QAngio results is available at the link below. Importantly, the two principal findings reported in the original paper have been reproduced in both the Heartflow and QAngio analyses: (1) baseline plaque strongly predicts future plaque progression, and (2) ApoB was not associated with plaque progression I want to once again thank Dr. Budoff and the Lundquist team for providing these scans to study participants who request them. If you are a participant in our study and interested in sending in your scans through your cardiologist, we now have a budget to help cover the cost of that submission. You can contact us at info@citizensciencefoundation.org for more details. Thank you again to everyone for your support. 🙏 cc @nicknorwitz @AdrianSotoMota
Dave Feldman tweet mediaDave Feldman tweet mediaDave Feldman tweet mediaDave Feldman tweet media
English
70
121
607
279.5K
Kevin Steel
Kevin Steel@Cardio11·
@KarlSteel Perhaps this image has been published more than you have!
English
0
0
0
188
Kevin Steel
Kevin Steel@Cardio11·
@KarlSteel ...and the career advice he gave us as impressionable teens "Be alert, the world needs more Lerts." - Dad Steel. I think I achieved that, not really sure.
Bellingham, WA 🇺🇸 English
0
0
3
0
CV Imaging - Juliano Lara Fernandes, CFA, MD
Today we celebrated our 50,000 CMR/CCT patient! I can still remember our first exam performed on a Saturday morning as we did not have a slot in our single MRI scanner at that time. Many thanks to our great staff that have been serving our community for all these years.
CV Imaging - Juliano Lara Fernandes, CFA, MD tweet mediaCV Imaging - Juliano Lara Fernandes, CFA, MD tweet mediaCV Imaging - Juliano Lara Fernandes, CFA, MD tweet mediaCV Imaging - Juliano Lara Fernandes, CFA, MD tweet media
English
6
1
21
0
Kevin Steel
Kevin Steel@Cardio11·
Who says stress MRI costs more than SPECT? According to my hospital's EMR (Epic), stress MRI is the financially wise choice in the functional evaluation of stable chest pain. #WhyCMR
Kevin Steel tweet media
Bellingham, WA 🇺🇸 English
0
0
0
0
Kevin Steel
Kevin Steel@Cardio11·
Respect the scout images, they may have the non-cardiac answer. #WhyCMR
Kevin Steel tweet media
English
0
1
3
0
Kevin Steel
Kevin Steel@Cardio11·
@KarlSteel @jmatzify Wow, great memories playing that with you. I recall you being ruthless during the auctions for critical resources.
English
0
0
0
0
Afshin Farzaneh-Far, MD PhD
Afshin Farzaneh-Far, MD PhD@afshinfarzan·
9) CMR perfusion mapping shows great promise in providing an alternative to PET for non-invasive measurement of myocardial blood flows It will allow CMR to become an important tool for assessing coronary microvascular function which is emerging as a major cause of CV morbidity
English
3
1
3
0