Sabitlenmiş Tweet

Numbers lied 42M in Revenue ❌ 29M in Revenue ✅
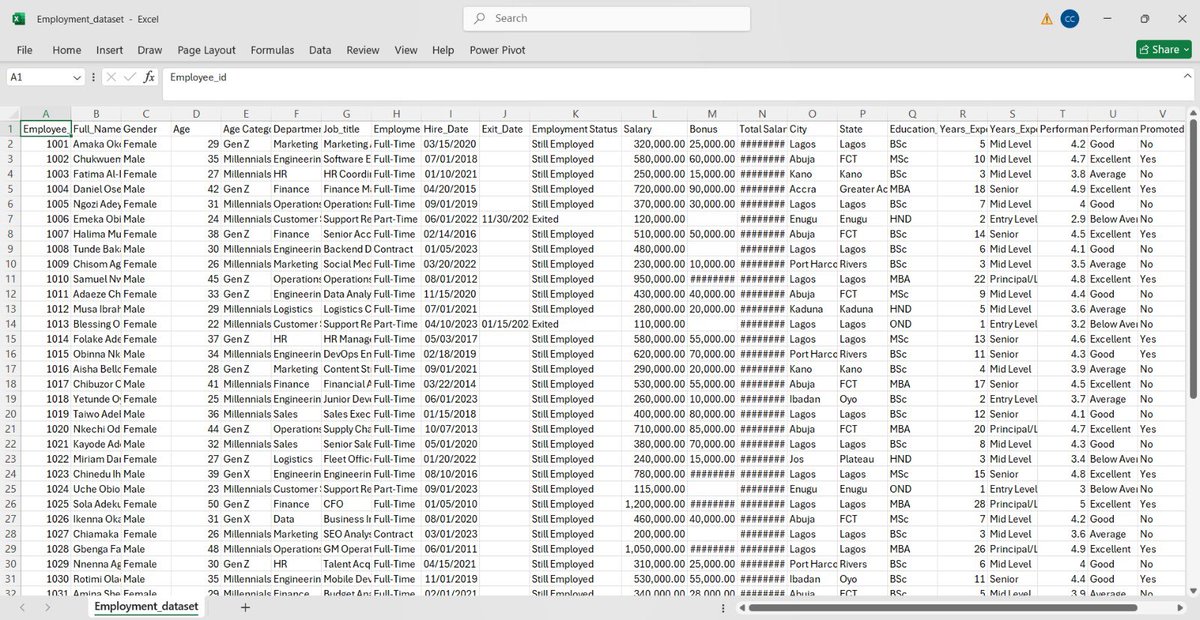
A clothing business recorded two years of sales data across 2023 and 2024. On the surface, the numbers looked promising 500 orders placed, products moving, customers buying. So when management sat down to review performance, they expected the revenue figure to reflect that activity. They expected a number that matched the energy of 500 orders.
What they got instead was confusion.
The revenue was lower than anticipated, and nobody could explain why. They had sold more or at least it felt that way but the money did not add up. The business was making decisions based on total order volume without understanding that a significant portion of those orders never actually converted into real income. Returned goods were quietly eroding revenue. Cancelled orders were inflating their order count without contributing a single naira. Pending transactions were sitting unresolved, neither confirmed nor lost. And nobody was separating these outcomes from the genuine completed sales.
The numbers were not wrong. They were just being read without context.
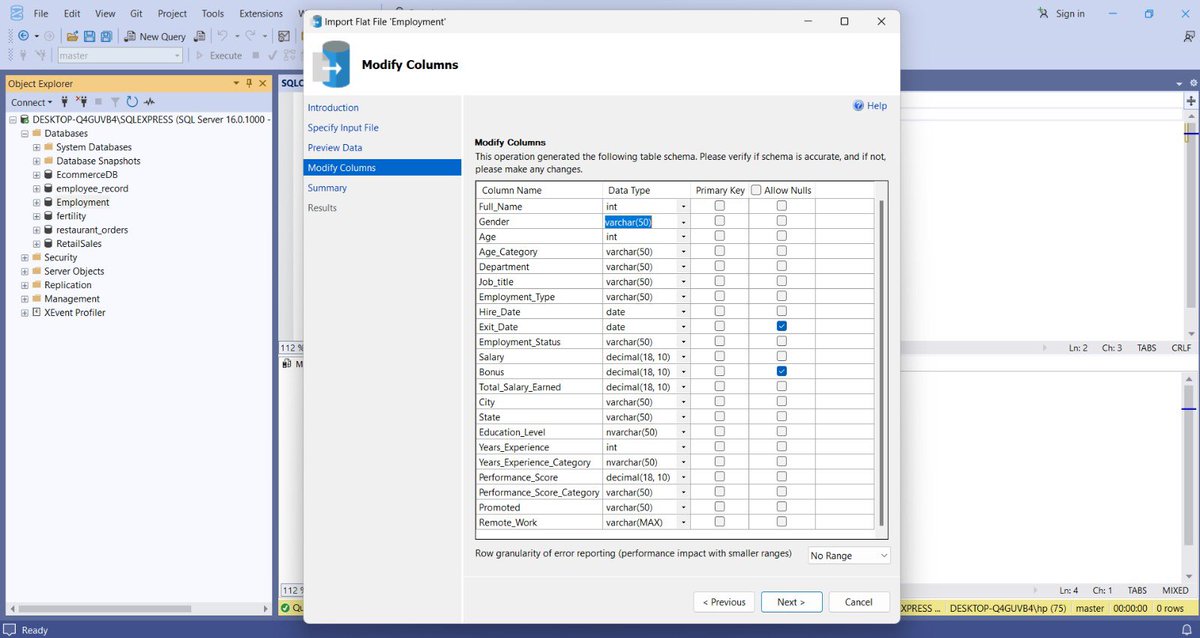
That is where the data analyst came in not just to organise the data, but to translate it. To answer the question the business had been asking without realising it: we sold a lot, so where is the money?
Here’s what the data actually showed:
→ Real revenue: ₦29.4M from completed orders only
→ Denim Jacket was the #1 product in both sales and revenue
→ Outerwear alone generated ₦12.1M
→ Abuja was the strongest city at ₦7.3M
→ 40% of sales came from online
→ 90% of 341 customers never came back
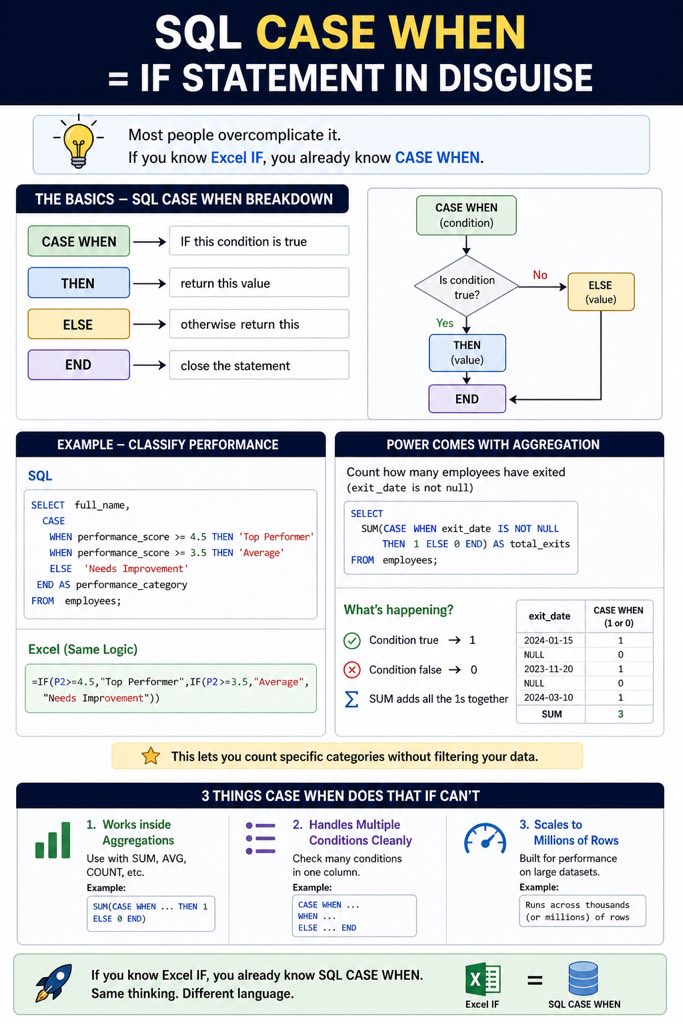
→ 2024 made more money without selling more that’s the smart pricing strategy.
Here’s what I told them to fix:
1. Find out WHY customers are returning goods ₦3.4M is recoverable
2. Follow up on 54 pending orders before they become cancellations
3. Build a retention system losing 90% of customers after one purchase is a leaking bucket
4. Push harder online lowest cost, highest return channel
5. Never let the Denim Jacket go out of stock
The numbers were never the problem. Reading them without context was.
What other insight or recommendations can you make out of this?

Charles | Data Analyst@CasmirCodesData
Wrapped up, will be sharing in few minutes.
English