ChainStats

1.9K posts

ChainStats banner
ChainStats

ChainStats

@ChainStatsPro

Unlocking Web3 Data Like an oil refinery for blockchain, we turn raw data into valuable, data-driven insights, helping users thrive in the Web3 economy

Katılım Ağustos 2021
167 Takip Edilen5.4K Takipçiler
ChainStats
ChainStats@ChainStatsPro·
From visualizing where the market is trending to crystallizing that vision… full video drops tomorrow.
Dagnum²@Dagnum_PI

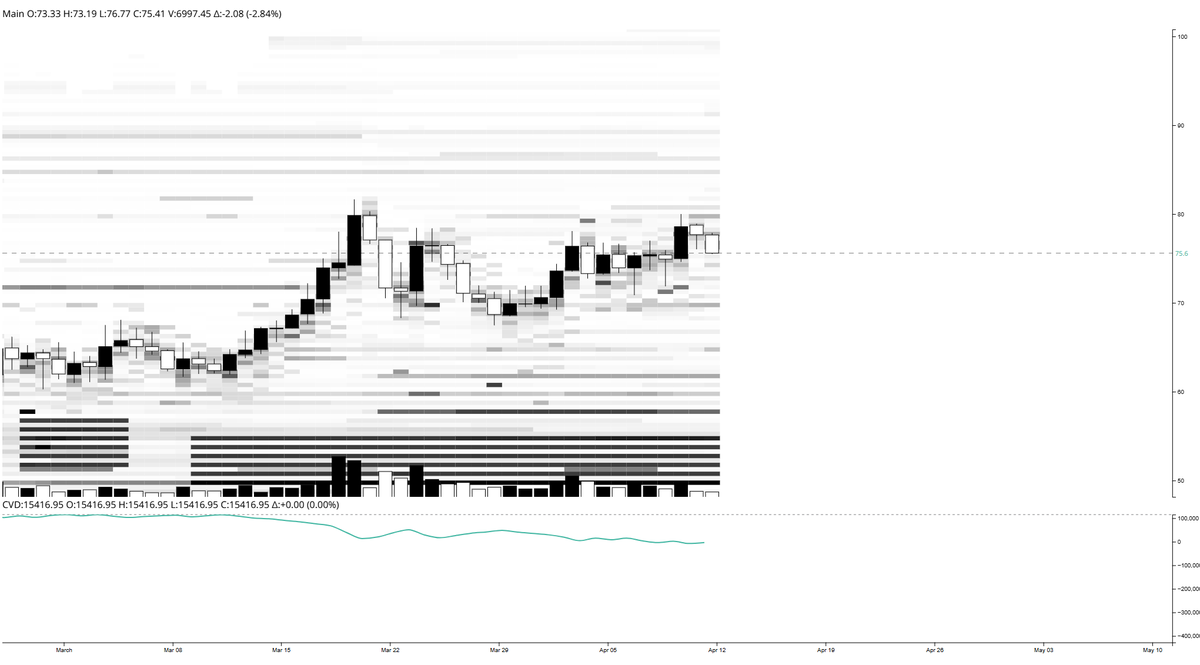
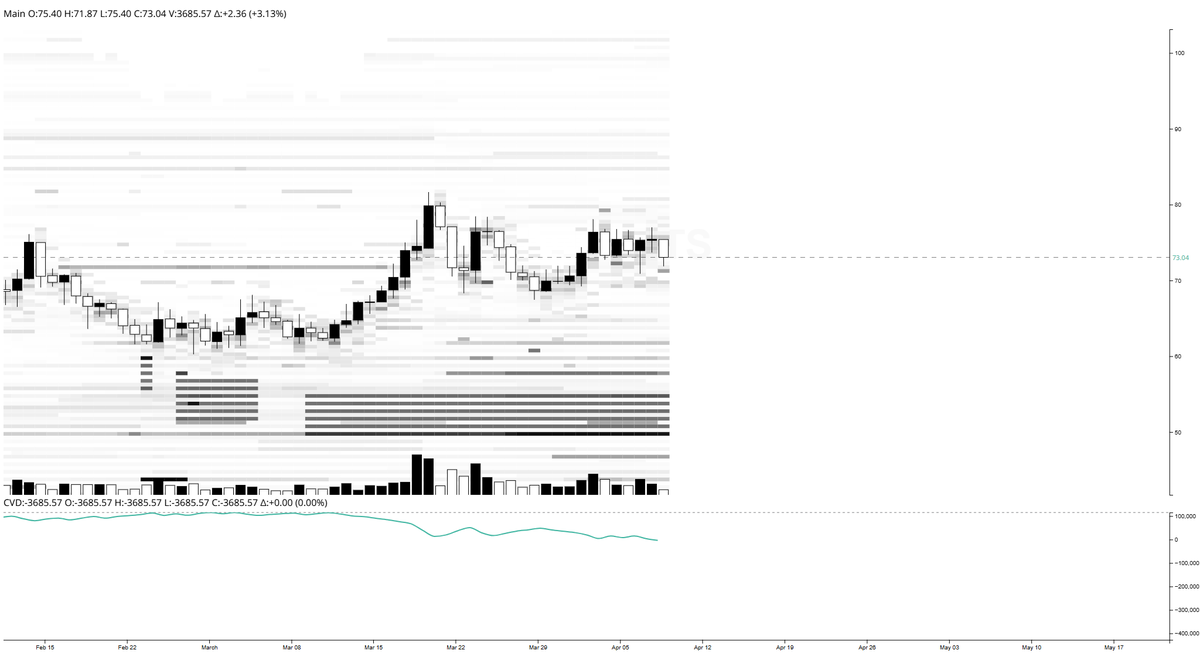
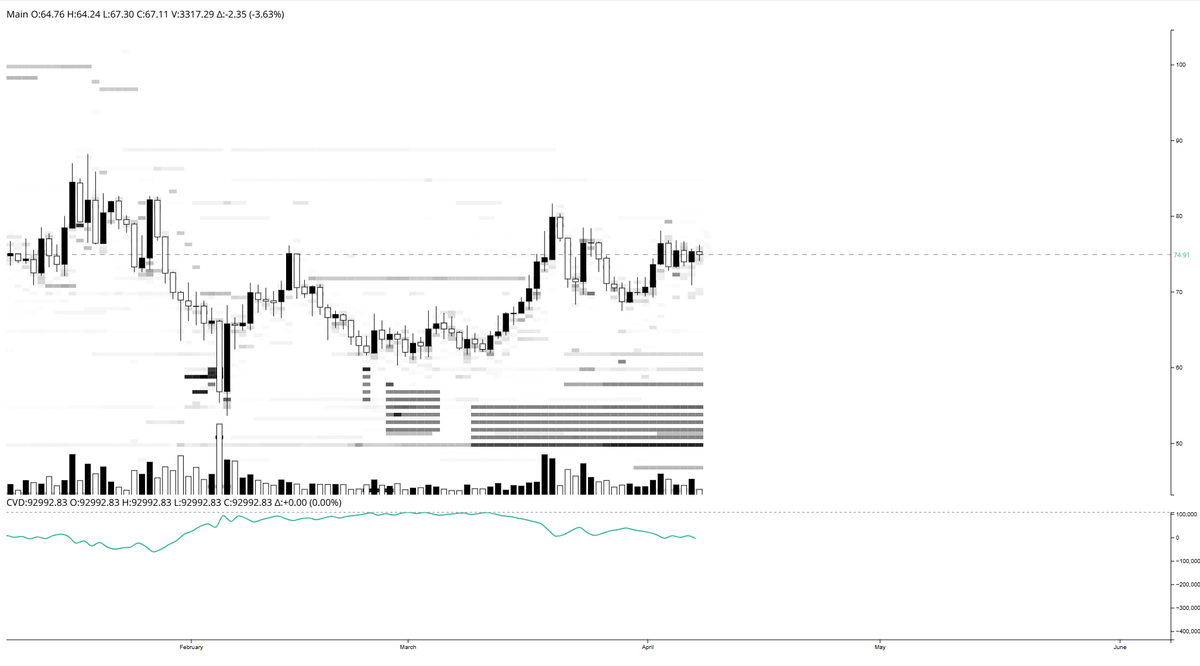
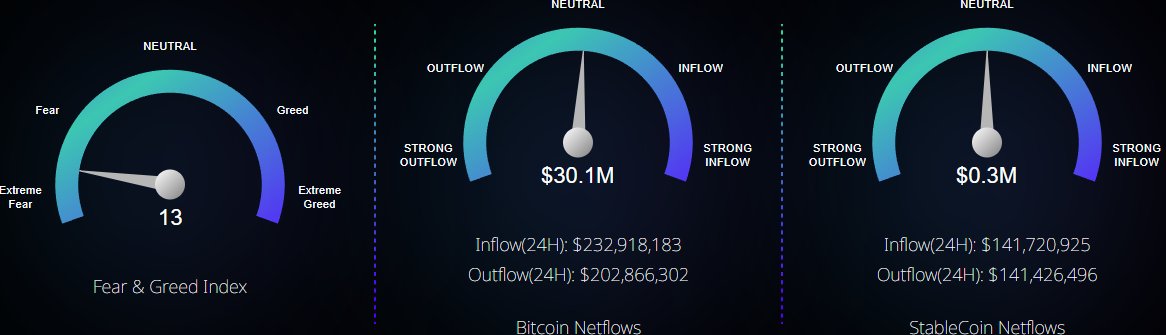
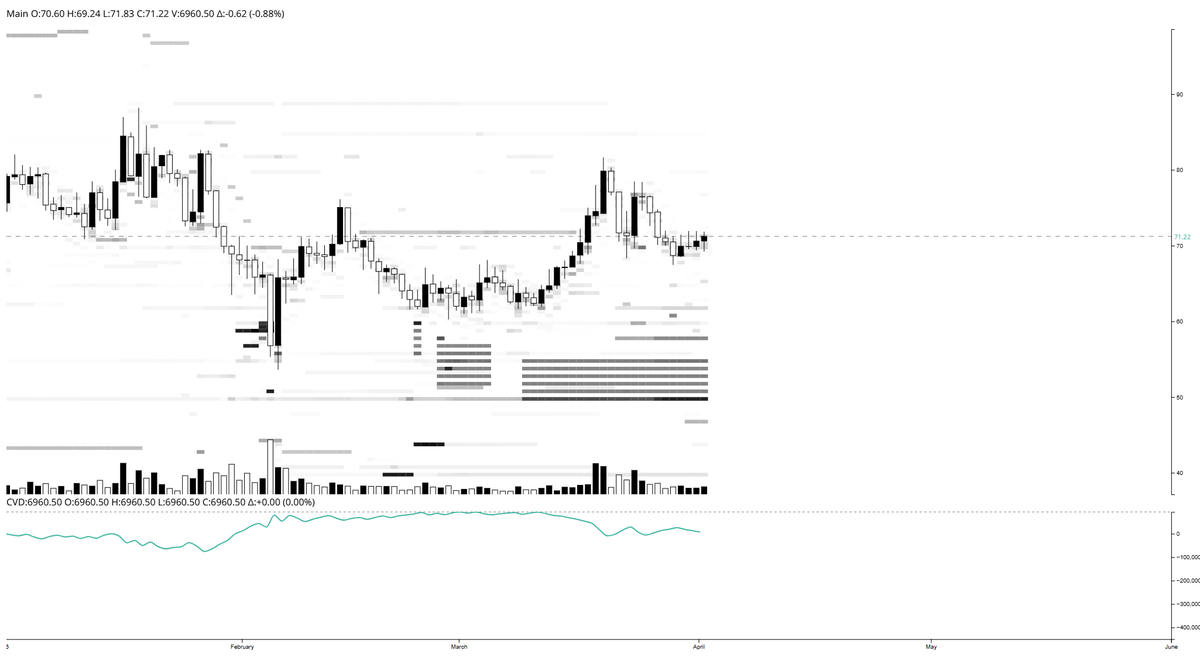
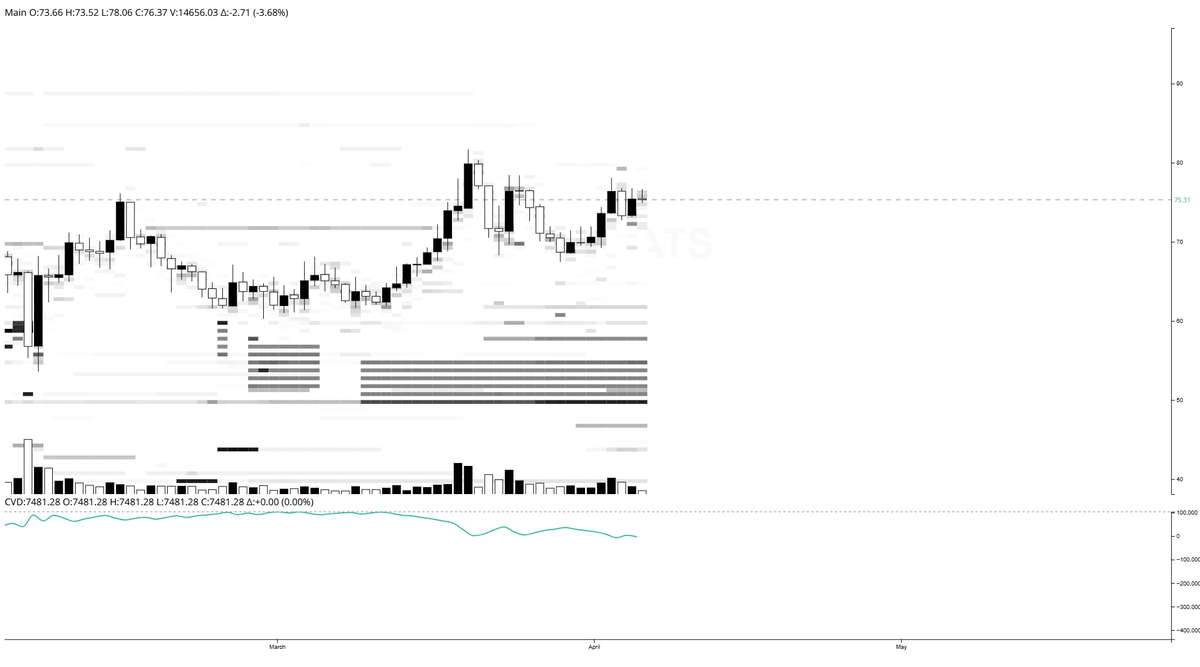
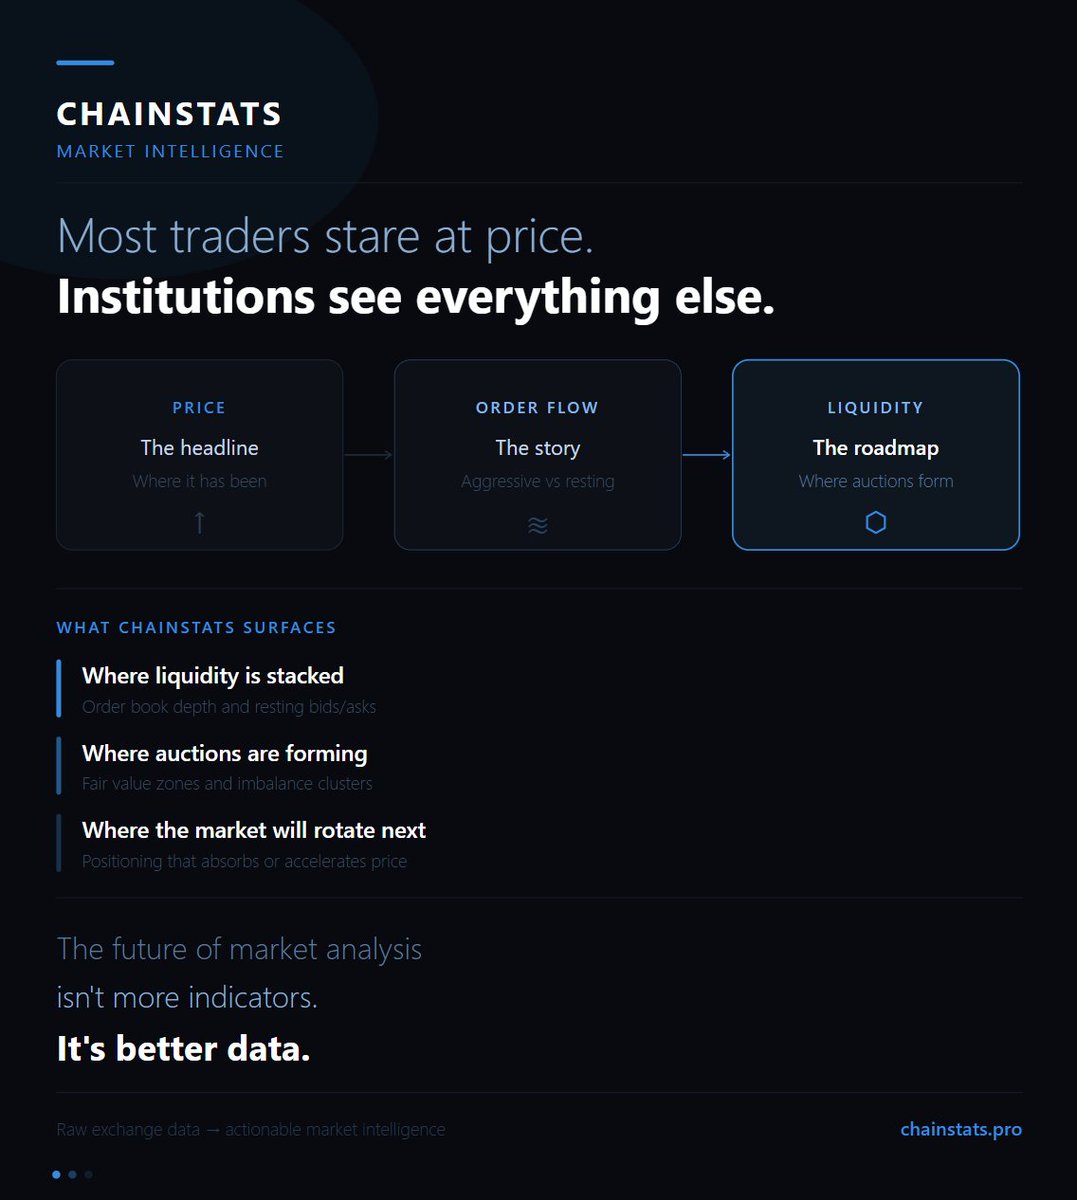
$STATS @ChainStatsPro aims to be the accessible "Bloomberg Terminal for Web3," leveraging blockchain data for transaction analysis and providing real-time on-chain insights Full video drops tomorrow

English
0
3
12
1K
ChainStats
ChainStats@ChainStatsPro·
$QNT holding in a tight range this morning. Looks like chop on the surface but underneath it’s a clean liquidity battle. Current Auctions • Sellers defending 78–80 • Price struggling to accept above • Bids present, not aggressive CVD still flat to slightly down → buyers not stepping in with urgency Liquidity tells the real story: • Heavier demand sits lower, not directly under price • Supply keeps refreshing on every push up • Market hovering, not committing This is compression. Not trend. Not breakout. Just positioning. Move comes when one side stops showing up. Candles won’t tell you that orderflow will
ChainStats tweet media
English
0
3
50
1.3K
ChainStats
ChainStats@ChainStatsPro·
$QNT holding structure above prior expansion, but the story right now is positioning, not price. We pushed into the mid-$70s and stalled right into visible sell-side liquidity. Since then, price is compressing while orderflow softens. CVD trending down = passive sellers in control Price holding steady = bids still absorbing That’s the divergence to watch. Current Auction • Bids layered below in the high $60s to low $70s • Overhead supply sitting around $76–$80 • Range tightening with lower participation If buyers step back in and CVD flips, this range resolves higher quickly If not, liquidity below gets tested This is where legacy charts lag Orderflow shows you intent before the move Follow the liquidity, not the candles. stats.
ChainStats tweet media
English
0
0
61
1.4K
ChainStats
ChainStats@ChainStatsPro·
$QNT sitting right where it matters. Price is compressing into a tight range around the low $70s while liquidity continues to stack both above and below. What we’re seeing: • Heavy bid support holding below price • Clear sell side liquidity stacked overhead • Range bound price action = market waiting for a decision • CVD trending down → passive sellers still active Current Auction: Bids: $68–$70 (defensive positioning) Asks: $75–$78 (primary resistance / liquidity target) Right now this is a classic compression phase. Price isn’t leading here… liquidity is. The longer this range builds, the more fuel gets loaded for the next move. Break above that $78 supply and things can move fast. Lose the $68 bids and you’ll see where real demand actually sits. Most people are staring at candles. We’re watching where the market is positioned. Signal > noise.
ChainStats tweet media
English
0
4
70
1.6K
ChainStats
ChainStats@ChainStatsPro·
We’re excited to partner with @Conste11ation A Layer 0 built for data Not just transactions Constellation is focused on validating and securing real world data at scale Powering enterprise and government grade systems We bring visibility to that data Turning raw activity into actionable intelligence Together, this is about one thing. Making data usable From infrastructure → to insight From raw signals → to market understanding Visibility before velocity isn’t just a tagline It’s the direction we’re building toward
ChainStats tweet media
English
16
58
153
9K
ChainStats
ChainStats@ChainStatsPro·
$QNT is pressing back into the mid $70s, but the bigger story is where liquidity is stacked. We’re seeing heavier resting bids still sitting lower on the book, which suggests downside demand remains parked beneath price while upside liquidity looks thinner near current levels. That usually means this range is still searching for conviction, not resolution. Spot CVD also isn’t screaming strength here. Price pushed, but participation looks more measured than aggressive. Legacy charts show candles. Orderbooks show intent. Watch how liquidity gets repositioned around this zone. That’s where the real signal is.
ChainStats tweet media
English
1
1
62
1.8K
ChainStats retweetledi
🥖Tokenicer✲⥃⬢
🥖Tokenicer✲⥃⬢@Tokenicer·
Trendlines show cool patterns Orderflow shows actual liquidity & depth of market Only one is displaying where real market executions happen And right now $QNT orderbooks show buys stacking below current prices. This is perfectly confluent with Quant’s fundamental development. From Dentsu Soken in Japan to GBTD & Sync Lab in UK. And we can’t forget the advancement in ISO TC 307 standards. Fundamentals are showing that Quant is continuing to become a preferred choice for Enterprise DLT integration. Orderflows showing buys stacking below current prices & weak sellside liquidity. Crypto across the market is also beginning to show some recovery. Liking how confluences are stacking✅
ChainStats@ChainStatsPro

$QNT is holding steady while liquidity builds underneath. • Bids stacked below current price → support showing intent • Sell side present near recent highs, but not expanding • CVD flattening → activity cooling, not rolling over Markets don’t move on candles They move on positioning Watch where liquidity sits. stats.

English
2
18
138
8.3K
ChainStats
ChainStats@ChainStatsPro·
Fear & Greed Index at 13 Extreme fear is back in control Macro uncertainty, tighter liquidity conditions, risk off sentiment That’s the headline narrative But headlines don’t show positioning Data does When fear spikes like this, participants pull back Liquidity gets thinner, reactions get sharper This is where orderbooks matter Where resting bids and asks show real intent Where liquidity maps highlight where markets are likely to move next Add netflows into the picture You start to see where capital is actually moving, not where sentiment says it should Extreme fear doesn’t tell you what happens next Positioning does Follow the liquidity Track the flows That’s where the signal is
ChainStats tweet media
English
0
0
6
248
ChainStats
ChainStats@ChainStatsPro·
Actionable intelligence is the edge Market intelligence means nothing until you can see how capital is actually positioning through orderflow We turn raw data into real time insight Where liquidity is building Where it’s shifting Where it’s getting taken That’s the difference between watching price and understanding intent Appreciate you 🤝
StardustCollective²@stardustco11ect

Data = Power This is where actionable intelligence provides remarkable outcomes. @ChainStatsPro is proving it in real time. $STATS x $DAG

English
1
2
13
875
ChainStats
ChainStats@ChainStatsPro·
$QNT Market Update Price is chopping around the low $70s, but the real story is under the surface. Orderflow shows a clear build of resting bids below current price, with liquidity stacked in the high $60s. That’s your near-term demand zone where buyers have been willing to step in consistently. On the flip side, sell side liquidity is still sitting overhead, capping expansion and keeping price in a range. Until that gets lifted or pulled, expect continued rotation rather than clean breakout behavior. CVD has flattened after a recent push higher, signaling buy side momentum has cooled, not disappeared. This is typically where the market decides whether to reload or fade. Current structure: • Bids building below → passive demand intact • Overhead asks → supply still present • CVD leveling → momentum pause, not reversal Right now this is a liquidity-driven range, not a trend. The takeaway isn’t direction… it’s positioning. Legacy charts show you where price has been. Orderflow shows you where participants are positioned next. That’s the edge.
ChainStats tweet media
English
0
6
61
3K
ChainStats
ChainStats@ChainStatsPro·
$QNT is holding steady while liquidity builds underneath. • Bids stacked below current price → support showing intent • Sell side present near recent highs, but not expanding • CVD flattening → activity cooling, not rolling over Markets don’t move on candles They move on positioning Watch where liquidity sits. stats.
ChainStats tweet media
English
1
6
103
10.6K
ChainStats
ChainStats@ChainStatsPro·
This is the direction we’re building toward. Compute moves to the edge closer to the people actually using the platform We’re exploring a model where infrastructure isn’t confined to centralized servers, but can be supported by the community itself The objective is alignment between usage, participation, and how systems are powered at scale ChainGuardians are expected to play a role in that evolution, with a focus on accessibility and thoughtful design Appreciate the partnership and shared direction more to come as we continue building
Reality@RealityNetw0rk

We’re excited to partner with @ChainStatsPro They’re saving AWS spend by sourcing compute through their own userswith their rApp . This is a fundamental shift in how crypto analytics infrastructure gets built. 🧵👇

English
3
6
24
2.6K
ChainStats retweetledi
Dagnum²
Dagnum²@Dagnum_PI·
People are finally waking up to what the best traders have known for years Order books + liquidation charts are far more powerful than candlesticks alone. @ChainStatsPro has been delivering these tools longer than almost anyone long before they became trendy on TikTok. Now they’re taking it to the next level building a full @Conste11ation Metagraph that functions like a Bloomberg Terminal for crypto. Real-time order book data, liquidation heatmaps, and on-chain metrics across multiple networks. Want to know exactly how many active wallets are on $ICP, $QNT, $XRP, or $HBAR right now? ChainStats can tell you in seconds. This is what a purpose-built Metagraph looks like in action. $STATS x $DAG
English
5
9
41
4.5K
ChainStats
ChainStats@ChainStatsPro·
Extreme fear is back in the market. When sentiment hits these levels, most participants are reacting… not positioning. While headlines amplify uncertainty, liquidity quietly starts to build underneath price. Weak hands exit. Stronger players step in where conviction is highest. This is where orderflow matters. Not what people say Not what price did yesterday But where capital is actually sitting right now Extreme fear doesn’t signal direction It signals opportunity for those watching positioning, not emotion We follow the liquidity We track the intent We stay grounded in data Signal > noise
ChainStats tweet media
English
0
0
3
138
ChainStats
ChainStats@ChainStatsPro·
$HBAR Orderflow Update Most traders are still staring at trendlines Meanwhile the real story is sitting in the orderbook Price has been drifting lower, but this isn’t aggressive selling It’s controlled pressure into liquidity What we’re seeing under the surface • Resting bids continue to stack below current price, especially in the lower range • Sell-side liquidity is layered above, capping upside attempts • No meaningful expansion in aggressive market selling • CVD is relatively stable, not confirming panic or forced exits What that means This looks less like a breakdown and more like a slow auction into deeper liquidity Sellers are present, but they’re not in control They’re leaning, not pressing At the same time, buyers aren’t stepping up aggressively yet They’re waiting lower Current auction dynamics • Price compressing inside a defined range • Liquidity building both sides, with heavier interest below • No displacement move yet, just positioning The takeaway This is a positioning phase, not a decision point Until one side pulls liquidity or steps in aggressively, expect continued chop with slight downside drift into demand The move doesn’t come from candles It comes when liquidity shifts Follow the positioning, not the noise
ChainStats tweet media
English
0
0
3
186
ChainStats
ChainStats@ChainStatsPro·
🧠$QNT is trading in the $70–$78 range with strong recent upside momentum (TradingView) Weekly trend flipped bullish with ~15–20% move off the lows (FXStreet) Market structure is range-bound but tightening under resistance 📊 What the Orderflow Is Actually Saying This isn’t a trendline game. This is positioning. 1. Liquidity Map Heavy resting bids stacked below (~$60–$65 zone) That’s your real support, not a line on a chart Price already swept that area once and got a reaction → buyers showed up 2. Current Price Behavior (~$70) You’re sitting right under a low conviction zone Not a strong bid wall, not strong resistance either This is auction territory, not direction yet 3. Sell-Side Above Clear liquidity clusters building above ~$75–$80 That aligns perfectly with macro resistance everyone’s watching (Traders Union) Translation: Price is being magnetized upward, but hasn’t accepted above yet. 📉 CVD (Orderflow Insight) CVD has been grinding up slowly No aggressive buyer dominance More like passive accumulation, not breakout energy That matters. This isn’t euphoric buying This is positioning before a move ⚖️ Current Auction (This Is the Game) Bids (Demand): Strong: $60–$65 Moderate: just below current price Asks (Supply): Stacked: $75–$80 Thin above if that breaks 🎯 What Matters Next Scenario 1: Acceptance above ~$80 Liquidity gets cleared Price likely moves fast into higher vacuum That’s where acceleration happens Scenario 2: Rejection here No strong bids at current level = weak footing Likely rotation back to high $60s / low $60s liquidity 🧭 Bottom Line It’s coiling between liquidity pools. The move doesn’t come from candles It comes from which side of the book gets cleared first
ChainStats tweet media
English
3
4
54
1.6K
ChainStats
ChainStats@ChainStatsPro·
stats.
ChainStats tweet media
English
0
0
6
155