Coin Post@CoinPostMedia
Tesla + SpaceX merger is back on the table!
During the earnings call he didn’t shut down the idea, and analysts are now saying the operational overlap (AI, manufacturing, Terafab, shared talent) is already huge.
Market reaction:
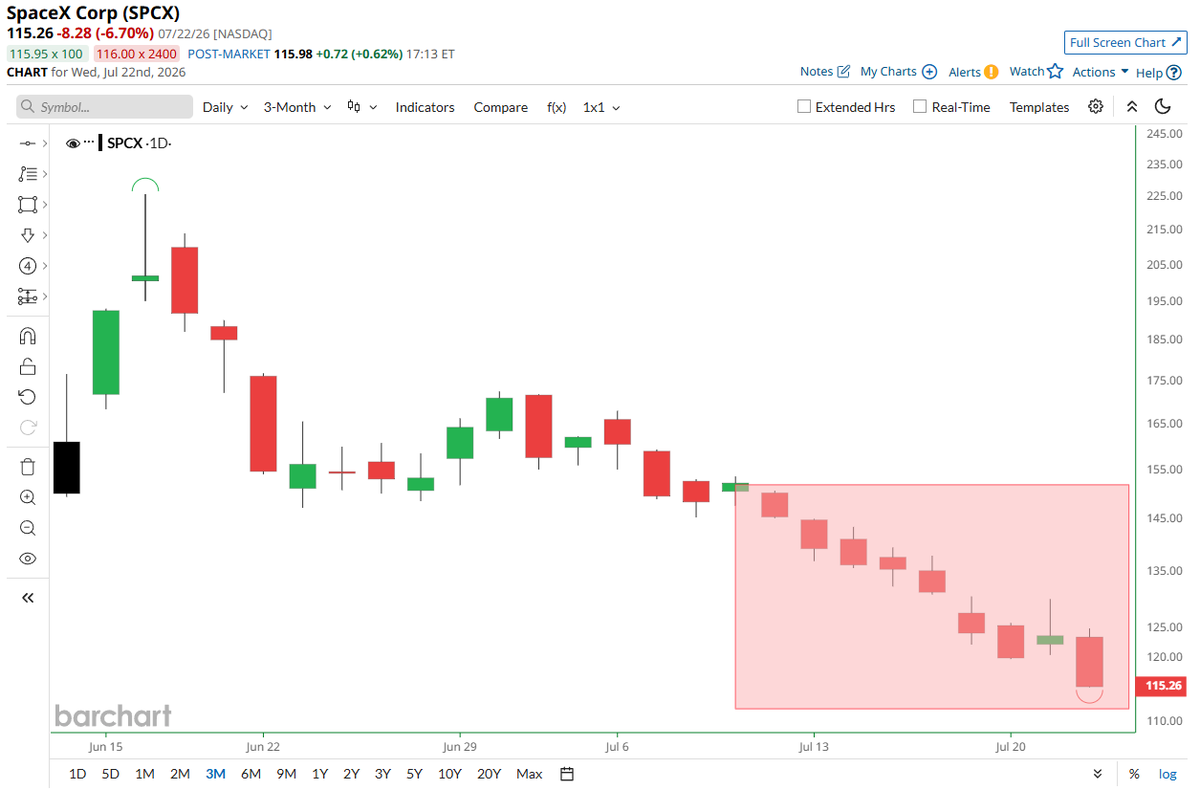
$SPCX 0%
$TSLA -9%
The logic behind a merger:
Tesla brings manufacturing, batteries, robotics and AI ambitions. SpaceX brings Starlink, launch infrastructure, orbital computing and massive engineering capabilities.
The overlap is already real. Tesla supplies technologies for SpaceX projects, both companies are connected through AI infrastructure, and they are working together on Terafab, a semiconductor manufacturing project.
A combined company would basically become a bet on the future of AI, energy, robotics and space infrastructure under one umbrella.
But there are huge questions too.
Musk has much stronger control over SpaceX, meaning governance and shareholder approval would be complicated. Regulatory issues, especially around China, could become a major obstacle.
Still, if it happens, it could be one of the most consequential corporate moves of the decade.
What do you think - Tesla + SpaceX = unstoppable or too much risk in one basket?