Awesome and majestic: a NASA/ESA @HUBBLE_space image of the #aurora on #Saturn, a composite of optical images of the ringed planet taken in 2018 and ultraviolet observations of the northern aurora taken over seven months in 2017.
Details: sci.esa.int/hubble/60570-h…
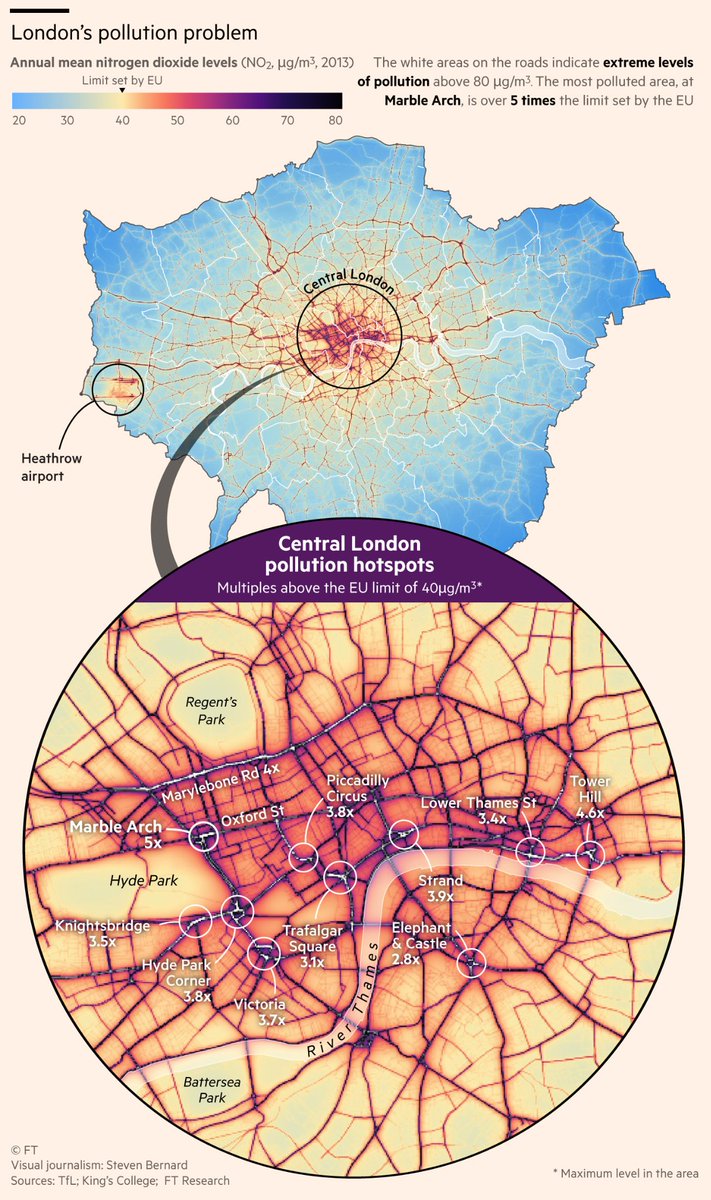
This is a fantastic #map by @sdbernard demonstrating:
(A) diverging palettes don't need to be centered on zero;
(B) the divergence doesn't have to happen halfway;
(C) existing palettes serve as great starting points for new palettes
Coral City Update! Following the release of the 2018 @TheEIU Liveability Index, here are the top 10 most liveable #cities as corals. Representing 30 min catchments (no traffic) using @openstreetmap. 4k version to follow #dataviz#map
Water + time = a continuous evolution of meanders and braids that fade in and out of a landscape. Here, the Padma River in Bangladesh carves a changing course over 14 years: earthobservatory.nasa.gov/images/92529/t…
#Aeolus is at the launch pad🚀🛰️! Sealed in its fairing it is eagerly awaiting liftoff on 21 August: the next @esa#EarthExplorer will unveil the mysteries of our planet's winds from space. fal.cn/VrQ1
Your #Manchester#python#rstats#data community is growing every day! Join our slack channel bit.ly/2v60ieu so you can meet your fellow members, join the conversation, ask questions, post links to blogs, podcasts, talks, discuss issues, and tell us what you want!
What is the value of #greenspace in your area? Use our interactive map to explore air pollution removed by area, and the amount saved in health costs ow.ly/pPQQ30laVm1
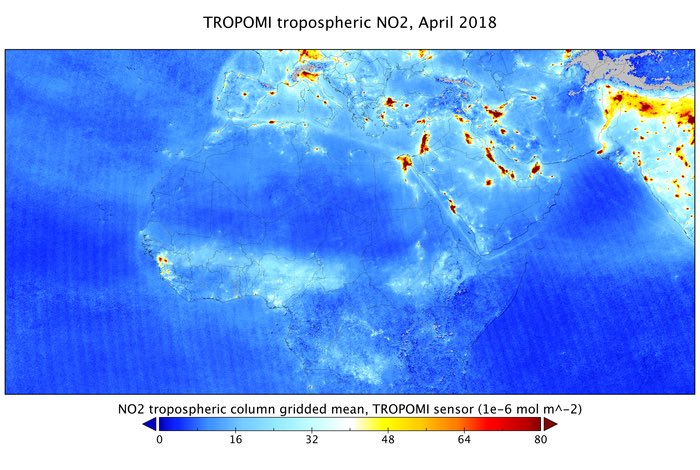
#Breaking
Since yesterday #Sentinel5P#opendata is available for download
With a resolution of up to 7x3.5 km, it enables detection of air pollution over individual cities.
This high spatial resolution is key to locate the origin of pollutants and identifying #pollution hotspots