Quicksilver

4.2K posts

Quicksilver banner
Quicksilver

Quicksilver

@CuedTrader

A leap of faith Learner | Trader | Curious

Mumbai Katılım Mart 2021
409 Takip Edilen244 Takipçiler
Quicksilver
Quicksilver@CuedTrader·
@PriteshOnCharts @TheTradeScout ha, main watchlist ko shortlist kr hi nahi paya how did you decide to skip trades today? I'm sure Ratnaveer would have been your big winner as well if you had traded
English
1
0
1
62
Quicksilver retweetledi
Quicksilver
Quicksilver@CuedTrader·
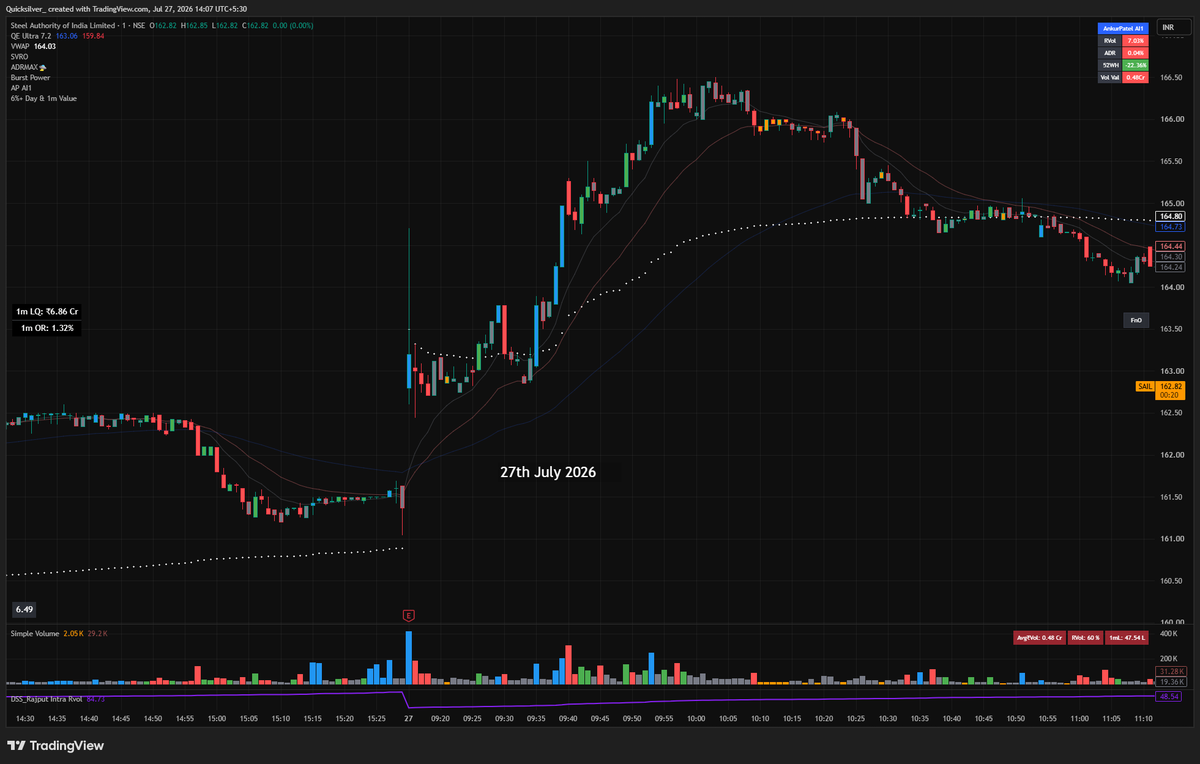
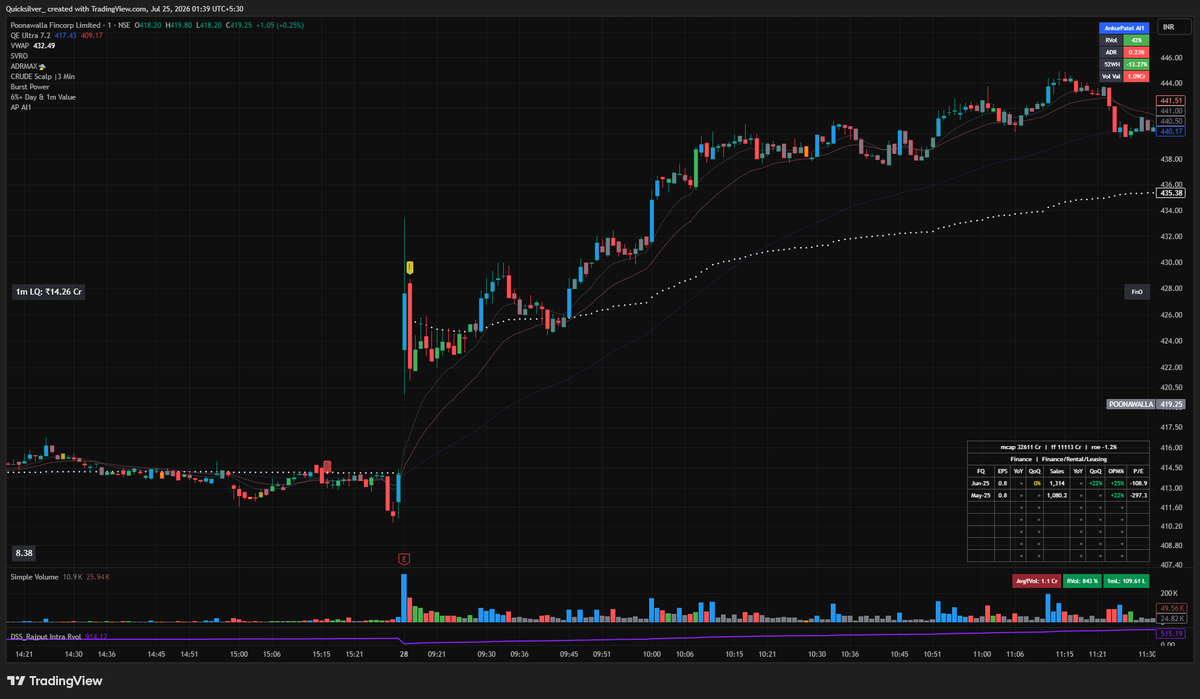
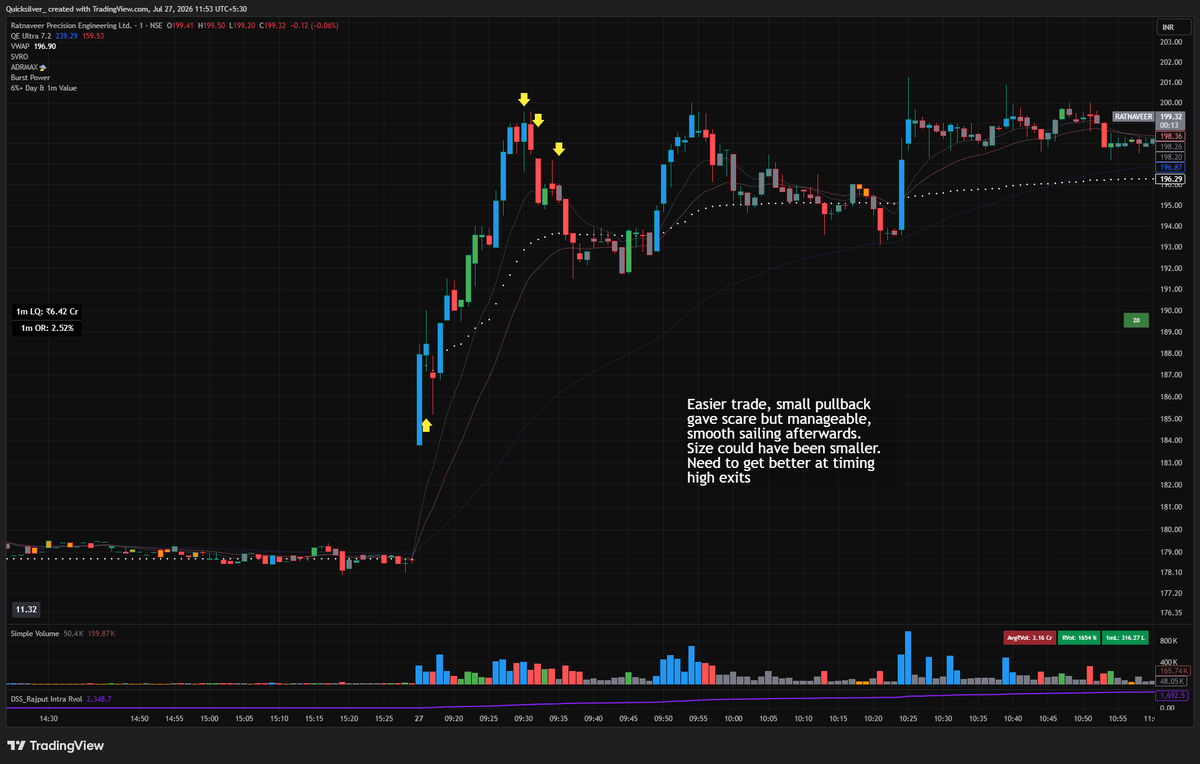
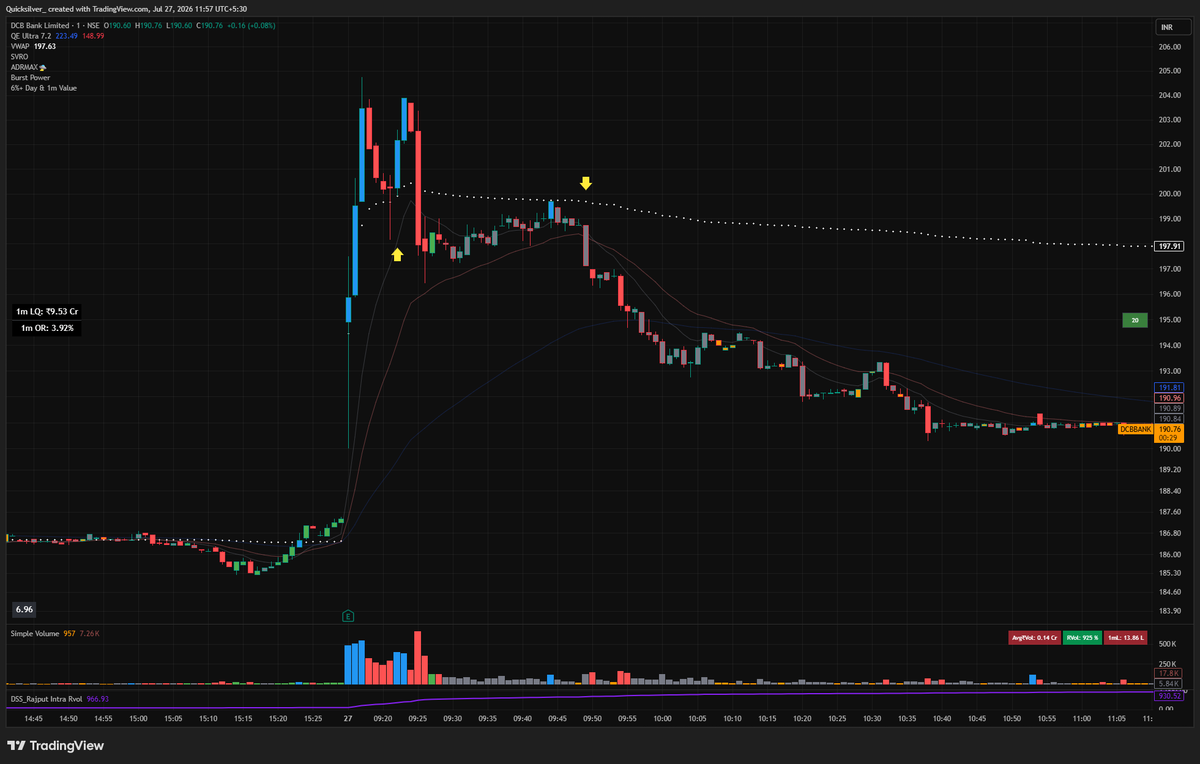
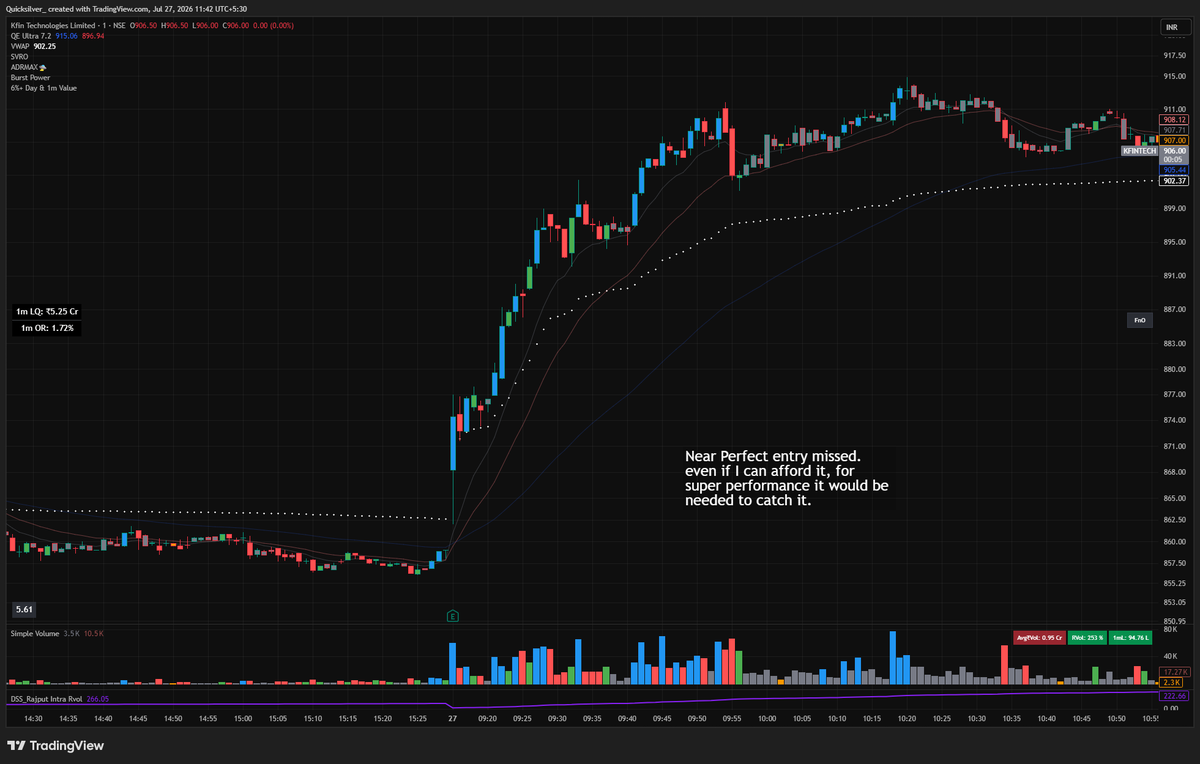
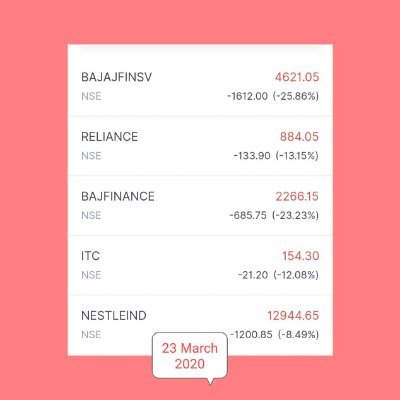
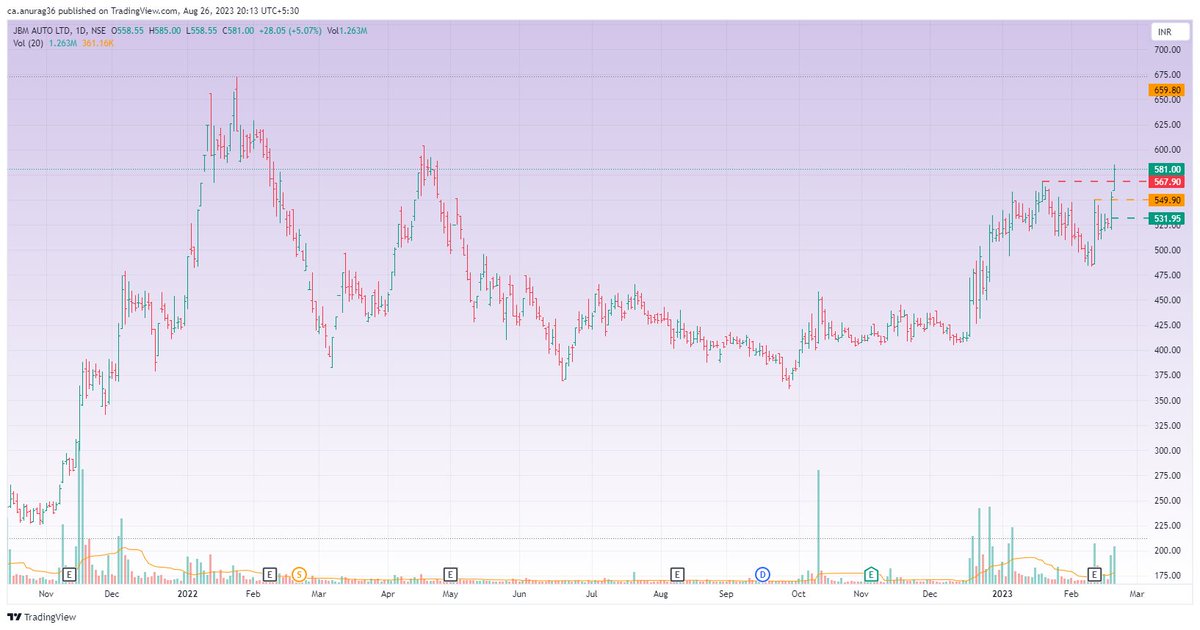
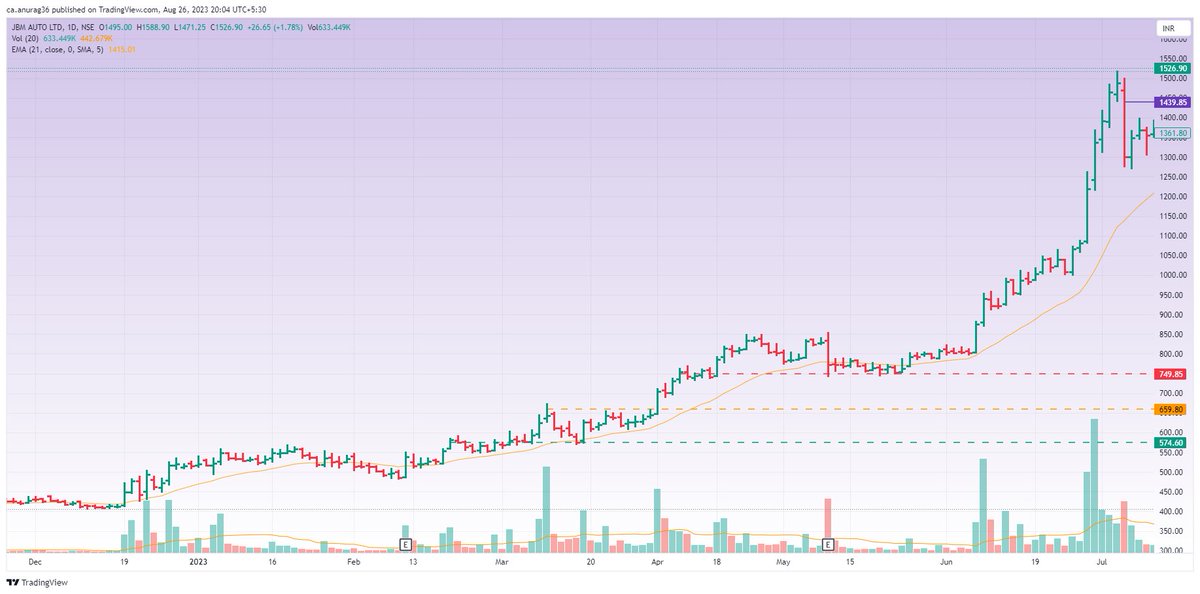
Messy day for EP Intraday play #RATNAVEER 3.15% gains #CREDITACC 0.2% gains #NEOGEN 0.3% gains #DCBBANK broker order issue kept me in an already poorly executed trade; lost 1.3% 2.2% pf impact for the day (In all the mess of a watchlist, missed near-perfect trade of #KFINTECH)
Quicksilver tweet mediaQuicksilver tweet mediaQuicksilver tweet mediaQuicksilver tweet media
English
1
1
2
217
Quicksilver retweetledi
Vivek Gautam
Vivek Gautam@TheTradeScout·
BALAMINES is now 44% up from my entry point without touching 20EMA once. I knew what was happening in this company and why its share price might jump 50-70%, but I just couldn't hold it and got out for little gains. The earlier version of me sat through all pullbacks to ride 10/20MAs. I have captured 50-150% moves in the past, and I will once again whenever the market is in giving mood. Transitioning back to proper swing trading from intraday (1 & 3mins) has been challenging for me till now. Working on the same and preparing for bullrun whenever it comes. Intraday is almost negligible for me now.
Vivek Gautam tweet media
Vivek Gautam@TheTradeScout

BALAMINES booked completely at 15% gains. PF impact : 4% Trade duration: 5 days

English
5
2
56
5.7K
Quicksilver
Quicksilver@CuedTrader·
@TheTradeScout What about EP trades? Earnings pulse and some basic checks should fetch the shortlist very quick I've been trying to do the same
English
1
0
0
277
Vivek Gautam
Vivek Gautam@TheTradeScout·
Won’t be trading tomorrow as I couldn’t find the time to prepare. Busy weekend. Hence no watchlist. I personally want the mid/smallcap indices to fall another 1.5-3% atleast and then form a base for a few days. The base breakout after such a fall of 6-8% from top will ensure a higher probability of sustained moves on the upside.
English
8
0
32
6.5K
Quicksilver retweetledi
Shyam Sekhar
Shyam Sekhar@shyamsek·
A personal anecdote on this view. It is not new to me. My mentor who brought me to investing took my assurance on this. That i will never do full time investing and will always be into entrepreneurship. There is a Naren story also in my journey. Three years after I gave my word to my mentor, i met Naren in 1993. He was a stock broker. I was the client. In 1994, @NSEIndia had just begun screen based trading. I went to the brokers office, and was watching the screen one day for hours. NAREN came in around 230pm and asked my " When did you come? Why are you sitting here? You should not hang out here. Else you will become a trader and lose everything you make in investing." He wasn't interested in growing his brokerage at the cost of my losing money. I had to literally convince him that it was a very hot may afternoon and I was just enjoying the air-conditioned comfort with friends. After market, he again pulled me into his room and took my assurance that i wont sit there before the screen during trading. It was a one hour conversation. That was how Pro-investor Naren was even as a stock broker. Seeing this, it struck me that a good investor always believes in the same value system no matter how times change and how much he grows. That is what has brought so many good investors this far in investing.
English
7
18
199
19.9K
Quicksilver retweetledi
Christian Flanders
Christian Flanders@CFlanders7·
Traders ask me how can you just sit out and do nothing or trade super small for months on end!? Lose 70%+ of your capital twice over a few years after promising yourself you’d never lose it again.
Ameet Rai@AmeetRai

The concept a lot of people struggle with is the ability to do nothing for weeks or months at a time. To sit there and know a better wave or market cycle maybe around the corner. Most of that comes from learning it through pain and drawdowns. Honestly that’s the best type of learning there is. You trade a topping market, you get burned and there’s a lesson on the other end of it. Folks screaming into a keyboard telling you don’t do this, don’t do that. That’s fine and peer knowledge is good wisdom. But the real learning comes from actually messing up. Feeling the pain, feeling the disappointment, going through the low yourself. Others can mask it or reduce it for you, sure. The best traders out there, the ones whose word you actually respect, were all at some point trading this same chop. Trading a mess. Sitting in a drawdown. Giving back gains in a year that was going well. Taking a big gap down. Those emotional experiences harden how you approach the markets. You end up battle-tested because you’ve been through situation A, B, and C yourself instead of someone telling you to avoid them. You can avoid some of it. But the best traders have always been through it. They know how it feels to be down and out and they know how it feels to be sky high, and those extremes build your emotional, psychological, and systematic ability to handle future cycles. If you’re going through it right now, it’s not the end of the world. It’s making you a better trader. Better to learn in choppy water than in a market that only goes up, because that’s what breeds nonsensical risk management long term.

English
35
35
556
46.2K
Quicksilver retweetledi
Ameet Rai
Ameet Rai@AmeetRai·
The concept a lot of people struggle with is the ability to do nothing for weeks or months at a time. To sit there and know a better wave or market cycle maybe around the corner. Most of that comes from learning it through pain and drawdowns. Honestly that’s the best type of learning there is. You trade a topping market, you get burned and there’s a lesson on the other end of it. Folks screaming into a keyboard telling you don’t do this, don’t do that. That’s fine and peer knowledge is good wisdom. But the real learning comes from actually messing up. Feeling the pain, feeling the disappointment, going through the low yourself. Others can mask it or reduce it for you, sure. The best traders out there, the ones whose word you actually respect, were all at some point trading this same chop. Trading a mess. Sitting in a drawdown. Giving back gains in a year that was going well. Taking a big gap down. Those emotional experiences harden how you approach the markets. You end up battle-tested because you’ve been through situation A, B, and C yourself instead of someone telling you to avoid them. You can avoid some of it. But the best traders have always been through it. They know how it feels to be down and out and they know how it feels to be sky high, and those extremes build your emotional, psychological, and systematic ability to handle future cycles. If you’re going through it right now, it’s not the end of the world. It’s making you a better trader. Better to learn in choppy water than in a market that only goes up, because that’s what breeds nonsensical risk management long term.
English
33
104
782
161.6K
Quicksilver retweetledi
Equity Insights Elite
Equity Insights Elite@EquityInsightss·
Every sector has few key metrics that actually matters the most 1️⃣ Real Estate: Pre-sales | Collections | BD pipeline | Net debt | Operating surplus | Deliveries | Embedded margins Valuations : EV/Pre-Sales, EV/Operating Surplus 2️⃣ Retail: SSSG | Store expansion CAGR | Volume growth | Sales / sq ft | Pre-Ind AS EBITDA margins | Inventory turns | Store level payback Valuations : EV/Pre-Ind AS EBITDA 3️⃣ Hospitals: Occupancy | ARPOB | Bed additions CAGR | Specialty mix | ALOS | Payor mix Valuations : EV/EBITDA 4️⃣ Lenders: AUM/Disb growth | NIM | Credit costs | GNPA / NNPA | PCR | ROA | ROE | CRAR Valuations : P/B 5️⃣ Hotels: Occupancy | ARR | RevPAR | Room additions | Management fee income Valuations : EV/EBITDA 6️⃣ Life Insurance: APE growth | VNB growth | VNB margin | Embedded value | Persistency | Product mix | Solvency ratio Valuations : Mcap/EV 7️⃣ Asset Management: QAAUM growth | Equity AUM share | Net inflow market share | SIP market share | Yield on AUM Valuations : P/E 8️⃣ QSR : SSSG | Average daily sales | Store additions | Dine in/delivery mix | Gross margins | Restaurant EBITDA | Store payback | Store closures Valuations : EV/Sales, EV/EBITDA 9️⃣ Capital Goods: Order inflow | Order book | Book to bill | Execution growth | Capacity utilisation | Working capital | Valuations : P/E, EV/EBITDA 🔟 Internet Platforms: GMV | Orders | Transacting users | Take rate | Repeat rate | CAC | Contribution margins | EBITDA | Cash burn Valuations : EV/Sales, EV/GMV, EV/EBITDA after profitability 1️⃣1️⃣ Data Centres: Operational MW | Under construction MW | Capacity utilisation | Contracted capacity | PUE | Revenue/MW | EBITDA margins | Capex/MW | Net debt Valuations : EV/MW, EV/EBITDA 1️⃣2️⃣ Electronics Manufacturing: Order book | Customer additions | Wallet share | Value addition | Capacity utilisation | Working capital | Capex Valuations : P/E, EV/EBITDA 1️⃣3️⃣ SaaS/Enterprise Software: ARR growth | Net revenue retention | Billings | RPO | Customer additions | CAC payback | FCF margins Valuations : EV/Sales, EV/FCF 1️⃣4️⃣ Cement: Volume growth | Capacity additions | Capacity utilisation | Realisation/tonne | EBITDA/tonne | Fuel costs | Freight costs | Clinker ratio | Net debt Valuations : EV/tonne, EV/EBITDA 1️⃣5️⃣ IT Services: CC revenue growth | Deal wins/TCV | Attrition | Utilisation | EBIT margins | Headcount additions | DSO Valuations : P/E, EV/FCF 1️⃣6️⃣ Managed Workspaces: Operational area | Secured area | Seat additions | Occupancy | Enterprise/GCC mix | Rental REV | Ancillary REV | Capex/seat | Cash conversion Valuations : EV/Pre-Ind AS EBITDA | EV/Sales 1️⃣7️⃣ Auto Ancillary: Content per vehicle | Order wins | EV/ICE exposure | Export mix | Order book | Client concentration Valuations : P/E, EV/EBITDA These are not the only metrics to track Every sector has many moving parts & a lot of other factors that matter But these are few of the most important sector specific metrics which help in understanding the core performance of a business
English
6
50
239
20.6K
Quicksilver retweetledi
Umang
Umang@stocksgeeks·
I used to answer every DM I got, but the no. is off the charts now. Sorry if I have not been able to respond to you all. I was helped by a lot of other traders on Facebook during my early days when I used to hop in their DMs and ask them questions, so I just want to do the same for others. Also, try to send the entire detailed query instead of a simple Hi or Hello, I do not know how to respond to that.
English
4
1
83
6.7K
Quicksilver retweetledi
Anuragg Venkatakrishnan
Anuragg Venkatakrishnan@Anuragg_CA·
There are two anchor biases that have caused significant losses or opportunity costs for market participants. The first is the investor bias that charts are irrelevant and that buying good value is sufficient for the long term. The second is the trader bias that all solutions can be found in charts. ✉️+🧵 Market participants with the first bias are often willing to learn how to optimize their timing and risk using charts, particularly after bear markets when reality sets in. However, I have noticed that chartists are more resistant to study the fundamental catalysts that trigger the actions of institutions behind the chart patterns. Why? The institutions whom we are trying to follow by their clues on the charts, often take a fundamental view first and then may be a technical one to get a timing confirmation. Just because the potential fundamental catalysts are visible to them and not to you, does it make them lagging? And, if not, would you consider the chart to be lagging? Traders rely on charts because they provide an early opportunity to make decisions by optimizing time and risk. However, for the institution that is “creating” the charts, their informational edge about cashflows, growth and its risk will be leading indicators, not the charts themselves. Furthermore, all informational edges have an expiration date. Over the last 25 years, this edge has significantly reduced between institutional investors and retail traders. Although efficient, relying solely on charts means following the shadows and breadcrumb trails of institutions. Your FAITH in buying and holding a stock will increase exponentially if you have a better understanding of the decisions made by institutions through their fundamental and sector catalysts. In Selling - When starting to learn how to trade, most of our energy is spent on learning how and when to buy. This is natural, as capital is at risk and our first instinct is to protect it. We figure that once we make a “decent” profit in the stock, we’d just sell it. If you have been trading for the last three years (and especially in the last six months), you have likely faced more confusion and emotional pressure when selling at a profit than selling when your stop loss has been hit. The regret of selling a stock at a profit and seeing it move 2x from your selling point is probably greater than the regret of not having the stock on your buy list at all. Every trader has faced the thought, "I bought the stock at 100 and sold at 140, and now it's at 200. If I had still held the position, my portfolio would have increased by x%.” Cash traders usually buy Stage 2 momentum stocks that exhibit range contraction as it reduces time and stop loss risks. However, reward maximisation depends on your selling strategy. When you are in a profitable position, the first decision you need to make is HOW MUCH of the position should you sell in strength and at what risk multiple (R). This decision is often not based on the charts, but on various factors such as your trade objective, recent performance, or the theory of using the profits to finance your next trade. Every sell in strength decision which compensates for your mental game gaps or process deficiencies, reduces the impact your home run winners will have on your portfolio. Furthermore, it cancels out the opportunity of pyramiding by leveraging on unrealized profits. Your decision on HOW MUCH to hold or sell a stock will also be influenced by your FAITH in its upmove potential, and this must be determined before taking the trade. Let’s take an example - Setup The stock is breaking out of a long base and showing range contraction on the right side of the base. On August 25th 2022, the stock formed a tight day (NR7) on low volumes. Trade Objective Will look to buy and hold the stock for a longer positional play as (a) it is breaking out of a year-long base (b) Relatively new listing yet to pick up momentum Risk on Trade 0.5% of portfolio Selling Rule Sell 50% of the position in strength at 4R and trail the balance position with 21ema. If there is a parabolic move, sell the entire position if the low of the previous day within the parabolic move is broken. Entry 26th August 2022 Entry 316, Stop Loss 1.5% - 311.2 (~Day low), Size - 28% Sells 50% Sell at 338.5 (4R) + 50% Sell at 821.258 - (105R) =54.5R Impact on Portfolio - ~27.3% Although this stock was a big winner for me last year, the initial sell-in strength at 4R came with a high confirmation cost of ~25% on my portfolio. It can be argued that this is a case of hindsight bias but I had erred in not looking beyond the charts. My process deficiency was in not having a method to develop a stronger stock bias and aligning my pyramid and selling rules accordingly. Mismanagement of potential magnitude trades often incurs a bigger opportunity costs than missing out on many velocity trades. Not every trade should be treated equally based on probability theory. Not every coin toss is the same. My risk in this trade was capped by a stop-loss, trailing stop-loss for unrealized profits, low percentage risk on my portfolio, and verifying that there is sufficient liquidity to avoid slippages. To optimize rewards, I could have developed FAITH by delving deeper into the fundamental catalysts, sector, and situational awareness of the breakout, and avoiding over-management of risks. It would have made me trail or pyramid a much larger position, since it had not shown any weakness to warrant selling for a large part of the upmove. In Buying In a bull market, when a plethora of setups are breaking out, one of the challenging and subjective decisions is to prioritize which setups to enter. Your effort-to-reward ratio will always be more accretive when you size up in stocks that are more likely to give magnitude moves and multiple pyramiding opportunities, rather than taking multiple short momentum bursts. In scaling up portfolio As you scale up your portfolio, you will realize the limitations of trading solely based on charts in the Indian markets. On my portfolio size, I rarely get more than 500 stocks in my liquidity filter (compared to ~2000 in the US). Therefore, you cannot use the same buy and sell rules which you learnt from the US market traders, as you won't get as many trades without compromising on their quality. You will need to a trail bigger sizes in your homerun trades to achieve super performance. Furthermore, relying solely on traditional bookish pivot points or obvious trendlines connecting 3-4 swing highs to buy will result in poor fills and slippages. Instead, taking a stock-first approach and prioritizing trend quality over setup quality is a much better way to scale up. What can be improved? Identification of Themes or Sectors - Themes and sectors are actually different, but I am using them interchangeably here. There are normally two methods which are used by traders for this- Top Down - In this method, you start by taking a bird’s-eye view of the sectoral chart and drill down to the stocks within the sector. If you use Relative Strength (RS) for sectoral charts, you are essentially deducing that the top stocks will lie in the top groups. This is very similar to the O’Neil method, and @MarketSmithIND provides you with sectoral charts. However, I personally do not use MSI because, although many of their sector groupings though theoretically sound, are practically useless. (Eg.- the Auto Manufacturers chart includes Maruti, Bajaj Auto, Olectra, and a 40 Lakh MCap India Radiators). However, there are many good fintwits who have made useful tools for this which you can test out. Bottoms Up - Identify stocks in your watchlist that are setting up or currently in momentum within a common sector. This is often observed in commoditized sectors or when companies have common stock catalysts, such as sugar, metal, cement, insurance, lending or same ownership (e.g. Adani). The bottoms-up approach anticipates that stocks of a feather will flock together. It is typically used by more experienced traders who scan on a daily or weekly basis and, over time, develop a feel for the patterns that emerge across stocks. Although it may require more time and effort to develop, I find it to be the more effective method. Once the sector has broken out, it is easy to spot by looking at the top movers of the day. However, most people find the need to accurately identify the next sector move beforehand. It is a valuable and expert skill to develop, but not a mandatory one for most traders. Qullamaggie, Dan Zanger, and Mark Boucher, the most successful theme traders identified what's moving and then waited for favourable entry points, rather than the other way around. They were willing to pay a higher cost for this buy confirmation, as these trends typically persist for many months. They used a "Bottoms Up" approach in top movers list to shortlist common sectors and themes, created a separate watchlist and prioritized those top movers for buying when they gave a favourable entry point. Although they were late, they were still early enough to capture the bulk of the upswing. Identification of Fundamental Catalysts The market functions as a future discounting mechanism, which implies that the expected future earnings hold greater significance rather than its present or past performance. Positive past earnings are often priced into a stock by default, and can act often as a deterrent against favourable surprises which trigger significant movements in the stock price. This is where it differs from the principles of CANSLIM and most TechnoFunda fintwits. The most important initial step in analysis is determining the triggers that will cause a particular stock to rise or fall from the present moment, rather than solely relying on past trends. The specifics of these triggers will vary for each sector, and sometimes even within each sector. Earning catalysts, such as the example of Mazgaon earlier, are easier to identify. These can be traded through episodic pivots (see post on August 15th), which typically indicate a significant increase from the previous lacklustre earnings. If a great earnings report is followed by a gap up and range contraction, there is a high probability of a magnitude move. Non-earning catalysts are more nuanced. While it's not necessary to become an equity research analyst, it is important over time to observe the catalysts that are relevant to the stock and sector, as well as their importance to market participants. For instance, the agricultural sector is affected by both monsoons and government policies; infrastructure stocks can emerge from debt restructuring (such as Suzlon) or receipt of overdue debtors; Chemical stocks often move when there is low unutilized manufacturing capacity and there is a catalyst to increase demand; When considering new startup listings, sustained profit metrics may be a more relevant measure now than mere user and transaction counts, which were previously the primary pricing metric; When the Fed turns on its printers, putting even drunk sailors to shame like in 2020, nearly every company with an ISIN number will move. Takeaway Super performance requires two key elements: capital preservation and home runs. The first principle is quite well-publicized, but the second one is far less appreciated. From a portfolio perspective, when you are in favourable markets and have a hot hand, it's imperative that you press and maximize the opportunity, especially this year when most of you will be in profits. Wealth is not made by only avoiding losing years but also need a few high double digit or triple digit years. When you develop FAITH in your positions and the market confirms that view, you can't own enough. Super performance requires FAITH to risk large unrealized profits for larger future realised profits, and for that you often need to look beyond charts. It takes FAITH to let go of your logic and allow the magic to happen.
Anuragg Venkatakrishnan tweet mediaAnuragg Venkatakrishnan tweet media
English
34
79
297
94.9K
Quicksilver retweetledi
Anuragg Venkatakrishnan
Anuragg Venkatakrishnan@Anuragg_CA·
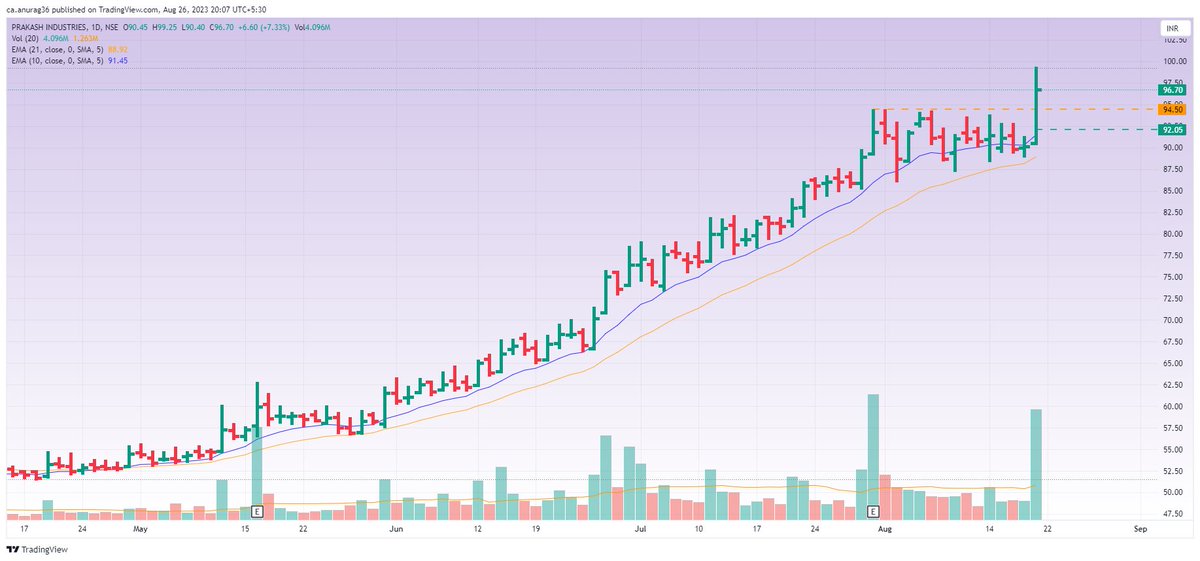
Much of our day-to-day trading effort is spent on finding good setups and entering them. However, the most significant factor and differentiator in trading performance is the position size you enter and trail with in a trade. Size Matters : ✉️ Position size for most traders is not a static percentage of the portfolio (e.g. 10% size in every trade). Rather, it is a derivative of the % risk taken on the trade and stop loss. The placement of the stop loss in-turn depends on the following - Setup type - Certain setups, such as EPs or IPO bases, are inherently more volatile and may require a wider stop loss, compared to range contraction setups. Trade Objective - Trades that have a strong reason (WHY) to break out and are held for longer positional plays can afford a wider stop loss. In my opinion, setting an initial stop loss above 4% can reduce the trade's expectancy. Instead, I prefer to wait for a better pivot and use a tighter stop loss. Entry - Identifying and entering a breakout early provides a significant edge with a tight stop loss and a more favourable risk-reward ratio. Let's take some examples with basic math - Case Study 1 - JBMA - February 2023 Setup - The stock is breaking out of a well-constructed, year-long base and forming a Volatility Contraction Pattern (VCP) on the right side of the base. On February 16th, the stock formed a very tight day on low volumes. Trade Objective - Will look to buy and hold the stock for a longer positional play due to (a) Breaking out of a year-long constructive base after a strong stage 2 upmove in 2021. (b) Strong relative strength (c) Strong sector news (d) Multiple pocket pivots - signs of big accumulation Risk on Trade - 0.5% of portfolio Selling Rule - Sell 30% of the position in strength at 4R getting stoploss to cost (the markets were bearish and portfolio was flat in Q1 CY2023), and trail the balance position with 21ema. If there is a parabolic move, sell the entire position if the low of the previous day within the parabolic move is broken. Entry - 17th February 2023 Tight (Green) - Entry 532, Stop Loss 2% - 521.35 (~Day low), Size - 25% Moderate (Orange) - Entry - 550, Stop loss 5% - 522.5, Size - 10% Wide (Red) - Entry 568, Stop Loss 8%, - 522.5, Size - 6.25% (triggered on 20th February) Sells - Tight (Green) - 30% Sell at 574.6 (4R) + 70% Sell at 1440 - (85R) =60.7R Impact on Portfolio - ~30.4% Moderate (Orange) - 30% Sell at 660 (4R) + 70% Sell at 1440 - (32R) =23.6R Impact on Portfolio - 11.8% Wide (Red) - 30% Sell at 750 (4R) + 70% Sell at 1440 - (19R) =14.5R Impact on Portfolio - ~7.25% Comments - The stock has moved over 150% from its base till July 7th, 2023. However, using a moderate or wide stop loss and selling into strength significantly reduced the trailing size, resulting in a much lower impact on the portfolio (11.8%, 7.3% vs 30.4%). This was despite the sell strategy capturing the majority of the move. To increase the size, you would have had to increase the risk per trade. - Increasing the percentage of selling into strength (from 30% to, say, 50%) would further reduce the percentage impact of the portfolio in a moderate or wide stop-loss position. - A tighter stop loss would increase the volatility of your equity curve, but in a magnitude move which is sold in weakness, it has a big impact on your portfolio. A pullback with a moderate and wider stop loss can wipe off a significant portion of gains. Case Study 2 - Prakash Industries- August 2023 Setup - This strong trending stock is currently moving alongside the 10ema and is now basing after decent results. Momentum Burst, Velocity trade, Flag, VCP - call it whatever you want. Trade Objective - This is a short-term or swing trade, as the stock's uptrend is not new. Risk on Trade - 0.5% of portfolio Selling Rule - Sell 50% of the position when the stock is strong at 4R, and trail the remaining position using either the 10EMA or 21EMA, depending on the stock's behaviour. Entry - 21st August 2023 Tight (Green) - Entry 92, Stop Loss 2% - 90.2 (~Day low), Size - 25% Moderate (Orange) - Entry - 94.4, Stop loss 4% - 90.6, Size - 12.5% Sells (Trailing position taken at unrealised profit as on Friday Close) - Tight (Green) - 50% Sell at 99.4 (4R) + 50% Open at 121.15 - (16R) = 10R Impact on Portfolio - ~5% Moderate (Orange) - 50% Sell at 109.5 (4R) + 50% Open at 121.15 - (7R) = 5.5R Impact on Portfolio - 2.75% Comments - The stop loss for a late entry at 94.4 (or any entry above this) has been set at the day low - the closest logical level. Tightening the stop loss did not make sense here because the breakout was clean on intraday charts and could have easily shaken the position out. A tight stop loss should be accompanied by a tight entry. Entering a trade late with a tight stop loss is an inefficient trade management strategy with a low probability of success. - The breakout (so far) is a dream come true for a swing trader. However, if you use a moderate stop loss or enter the trade late, your returns will be much lower compared to using a tighter stop loss. To increase size, you will have to increase the % risk per trade. - If timed well, the best trades are instantly profitable without ever dipping below cost. As Dan Zanger said, “winning horses don't back-up into the gate". Caveats - The objective of the cherry-picked examples is not to advocate for one trading style or person over another. Rather, it is to highlight that each confirmation required for execution comes with its own costs. These confirmations include expanding your stop losses, selling into strength in a positional move, or waiting for a trend line to break before entering. While you may not notice it on a trade-to-trade basis, over the long term, these costs compound significantly and hinder your performance. - One argument against entering a trade early with a tight stop loss is that you may get shaken out of winning trades. While this is partially true, it is a skill that can be improved through post-trade reviews and practice. For now, I suggest conducting a journal analysis to determine the R multiples lost due to adding a cushion to your execution. Then, compare this with the R multiple that would have been lost if you had been shaken out by a tighter stop loss and missed out on a winning trade. In most cases, the R multiples lost in the former case are far greater than those in the latter. - As a general rule, I cap my per-trade position size at 40% of my portfolio. Additionally, if I do not have an adequate profit cushion before results, I will reduce my position size. Takeaway Not every good setup or technical pattern is a trade, and not every trade is a technical pattern or a setup. As a trader, your task is to understand the language of charts and then refine the details of your executions to maximize the risk-to-reward ratio. Many of these refinements cannot be found in rule-bound technical books, but rather through first-principle observations and creativity. Don't replicate the rules of US traders, who have a 4x larger liquid stock universe than we have in India, with much lower margin restrictions. If you observe some of @Qullamaggie streams in bull markets, you will see him holding more than 15 positions often. There are primarily two ways to achieve super performance in the Indian markets: either size big and hold for a big move, or size big and make many small moves. Taking many small trades and churning for profits is not a great option. When it comes to trading, everyone has their own preferences and risk appetite. However, there are some ground rules that you need to follow if you want to achieve super performance. Don't make your approach so "comfortable" that it removes the possibility of achieving super performance.
Anuragg Venkatakrishnan tweet mediaAnuragg Venkatakrishnan tweet mediaAnuragg Venkatakrishnan tweet mediaAnuragg Venkatakrishnan tweet media
English
23
64
223
36.2K
Quicksilver retweetledi
Anuragg Venkatakrishnan
Anuragg Venkatakrishnan@Anuragg_CA·
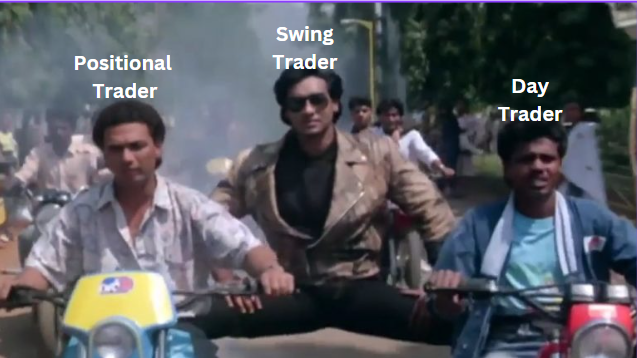
The Indian markets had been too good for too long. Such bull markets often hide systemic flaws—particularly the dangerous habit of remaining completely on the sidelines during corrections and passively waiting for easier conditions to return. Merely preserving capital in such periods isn't sufficient risk management. Here's why: ✉️ For momentum traders, avoiding a prolonged and deep market correction is straightforward—it simply requires the basic practice of setting a stoploss and adhering to it. During such corrections, purists often recommend staying in cash and waiting for favourable conditions, with the thesis that mastering a single setup during bull runs is sufficient for trading success. While it's a safe and noble stance to take, they're more wrong than right in the Indian context. In theory, there is no difference between theory and practice. In practice, there is. Here, market liquidity is shallow, the stock universe is relatively small, and SEBI swiftly places fast-moving stocks under its ASM framework. The risk of under trading is just as significant as, if not more than, the risk of getting chopped around by overtrading. The Swing Trader Fallacy The portfolio return equation for any stock market player can be broken down into a simple formula: Expectancy × Frequency, where Expectancy = (Average Winner % × Win Rate) - (Average Loss % × (1 - Win Rate)) = How much larger your winners are compared to your losers Frequency = Number of trades taken Within this equation, swing trading often ends up becoming a half-assed, confused technique. It lacks both the agility of day trading and resilience of positional trading. The typical cycle for a swing trader unfolds like this: You shift to full cash during a correction, then spend 5–15 days gradually redeploying your capital as stocks begin to set up. After a few days of upswing, another correction or pullback triggers stop losses, forcing a return to cash—and "The Cycle" repeats. Moreover, selling positions in strength while using progressive exposure restricts effective capital utilization—typically averaging ~50% annually—which restricts maximizing both expectancy and frequency. As a result, swing traders end up spending a large portion of bull markets only cycling in and out of positions—neither building large enough positions to capture magnitude moves, nor executing enough trades to effectively churn capital for super performance. While this approach may work in U.S. markets with no circuit filters and more opportunities and liquidity, blindly applying these strategies to Indian markets is like trying to chase a 50 over target in just 20 overs. Often in "The Cycle," one or more key parameters (expectancy, frequency, or capital utilization) becomes severely compromised with pure swing trading, making super performance statistically impossible. Thus many successful traders in India have ended up leaning towards one style more—they are either more day traders or more positional traders, than swing traders. Trying to find an equilibrium between both across different market cycles is a tricky, high-effort, low-reward game. Not Risk Avoidance There are two possible causes for inadequate returns— A) targeting a high return but getting thwarted by negative events B) targeting a low return and achieving it. The moment we decide to become a trader or active investor, we've already chosen option A—pursuing exceptional returns with manageable risks—rather than option B, the more conservative path of long-term SIP investing. Therefore, underperformance should only occur when we've taken appropriate risks but failed to generate asymmetrical returns—indicating a skill gap that needs improvement. Underperformance should never result from failing to take enough calculated risks. Going completely in cash at every market pullback, without expanding your skillset to new setups or exploring alternative asset classes and timeframes—isn't risk management; it's risk avoidance, which leads to return avoidance too. This is especially criminal if you're starting out with small capital, where aggressive capital compounding is crucial for making your efforts worthwhile. It requires being indifferent to small profits that don't materially change your life. The Adaptability I believe our primary challenge isn't a lack of exposure to the science of market principles, and trading setups built around them. Rather, it's our reluctance to venture beyond familiar patterns and adapt our execution based on each setup's objective, strength, and context. Here are the common setups used by momentum traders: There are two common mistakes that I made and have been correcting, and that I see many others continue to make: 1) Managing high-expectancy setups like IPOs and EPs too tightly as if they were frequency trades, resulting in shakeouts 2) Taking an all-or-nothing approach with high-frequency, lower-expectancy trades like momentum bursts, despite knowing that breakout success depends heavily on market sentiment—resulting in squats Using the same execution style across all setups, is where a lot of underperformance and frustration occurs, as it under-utilizes both expectancy and frequency. There is always a favourable time for some or the other setup in the market, either in a different asset class (equity, commodities, currency, crypto) or on different timeframes. A fantastic example of this was how Minervini adapted his execution methods in the USIC 2021. He noticed the lack of follow-through in breakouts and adjusted his strategy to focus on short-term trades lasting 1–5 days and scalps. He ended up winning the USIC with 334.8% in a difficult year (the runner-up was far behind at 100.4%). Even for the wizard, the setup is only as good as its execution. The Reality Check The truth is, regardless of your experience level, you can never predict with certainty which trades will succeed or how far they'll run. In any given set of trades, some will win and some will lose, and the magnitude of the winners often catches us by surprise. The key isn't knowing the outcome—it's positioning yourself for opportunity as many times as possible. And in the Indian markets, we don't have the leeway to miss many of these opportunities. Trade the market you are in, and not the market you wish you were in.
Anuragg Venkatakrishnan tweet mediaAnuragg Venkatakrishnan tweet mediaAnuragg Venkatakrishnan tweet media
English
34
85
404
64.4K
Quicksilver retweetledi
Nitin R
Nitin R@finallynitin·
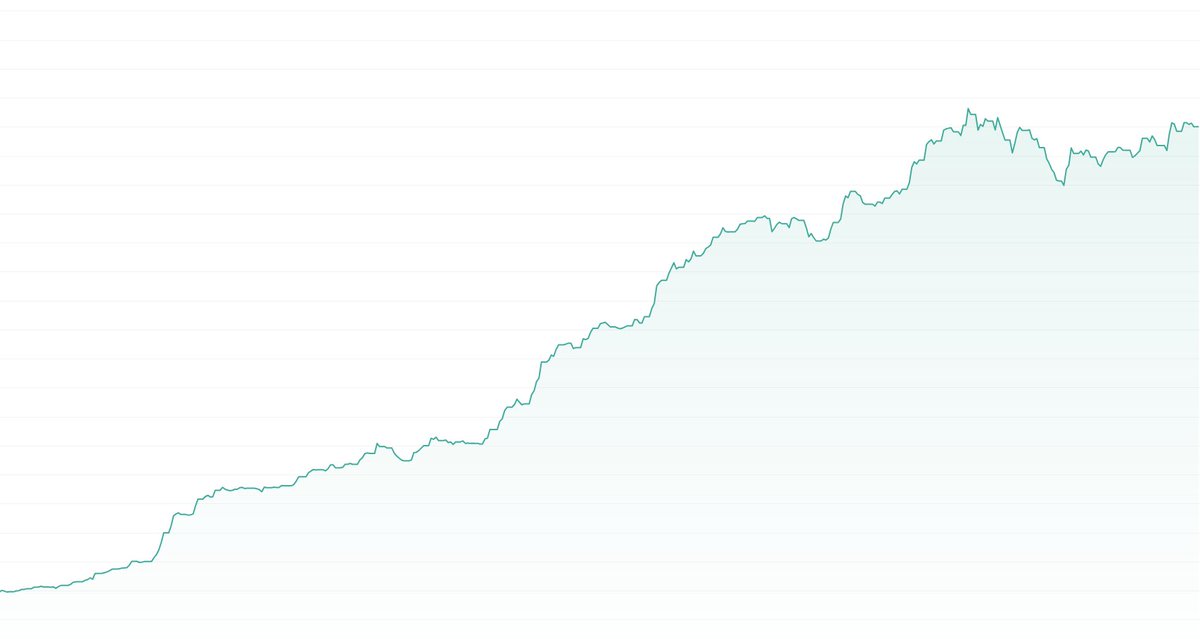
Sitting in #cash & looking back at this bull swing. In this financial year 2023-24, I made 100% on my portfolio, which, while it outperforms the Smallcap 250 by 40%, still falls short of the desired standard (2 x Smallcap 250). Interesting is that I last went in cash in November 2023, & was 40% up till then. I made the rest 60% in this second half (or rather 4.5 months). So what changed? Instead of booking partial profits, I kept holding till the TSL shook me out. "Doing nothing does wonders to the portfolio." Here is the #EquityCurve chart:
Nitin R tweet media
English
100
12
435
77.3K
Quicksilver retweetledi
Nitin R
Nitin R@finallynitin·
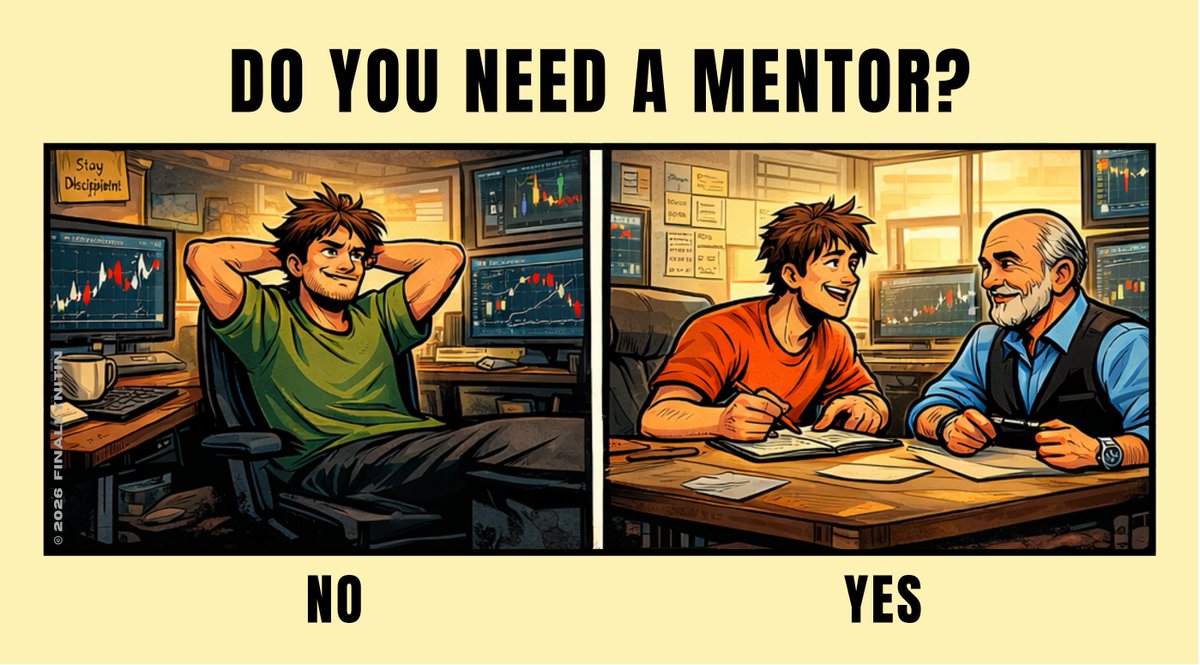
First, understand this clearly. There are two types of people: 1. People with a strong will & independent thought process, and 2. People who thrive on community & shared inspiration The first kind of people are those who, if at all, learn from their own mistakes, and no matter how hard someone tries, they cannot understand. They are poor students, but probably good teachers. The second kind are those who learn through connection, by absorbing wisdom from others, growing through collaboration, and refining their ideas in the collective. They can always shorten their learning curve with the guidance of others. 1. People who don't need mentorships Since I'm the first kind, here is some gyan for traders who might be of the same orientation: ⦿ Don't ever attend any mentorships or courses (not even mine, if I launch one some day, LOL). After being an off-and-on part of multiple such communities, all I can say is if you can learn even one or two concepts from another trader (‘mentor’), consider your time well spent. ⦿ Try to stay away from trading groups & webinars, as you might get influenced and might adopt borrowed convictions, which can consume your time and further lengthen your learning curve. ⦿ Listen to what your mind/heart says, and follow its direction. You are your best teacher, & no one but you can lead yourself to the path of clarity and conviction. 2. People who need mentorships For the second kind of people, congratulations, first of all. You have a relatively less tough trading journey ahead. You just need a mentor who suits your trading personality. I define a person as a 'mentor' if, and only if, the time & money you spend on him leads to the shortening of your learning curve. Based on my personal experience at various points of time during my trading journey, here are some genuine people that I think might be worth your time, as per the trading stage you are in: Beginner traders You need to be satisfied with becoming a profitable trader. Your first year in trading is best spent in this stage. ⦿ Milind Upasani (@Milind4profits) (SEBI Registered RA) - easy approach to the markets with dashboards & scanners. Will largely train your mind to follow the alerts & not take random decisions. ⦿ Rohit Musale (rohitmusale.com) (SEBI Registered RA) - identifying base formation in stage 2 stocks & buying breakouts. You learn a lot about price action & rating bases into healthy or faulty. Intermediate traders Now you're looking to accelerate and competing with your past profitable self, & trying for super-performance. ⦿ Hiren Gabani (@Hirengabani23) - Very simple & down-to-earth person. Swing trading only on conventional structures in stage-2 stocks & under healthy market conditions. Mastery in identifying '5-star' setups. You need to have the patience of sitting out for prolonged periods. ⦿ Manas Arora (@iManasArora) - One of the most respected Indian traders; the OG. Short to medium-term trend-following with a focus on building up size in winning names via razor-sharp execution. Will also trade reversals & oversold bounces. You need to have a lot of discipline to follow his process. Pro Traders Nothing but super-performance is your goal. You are now not satisfied by 'ordinary' returns. ⦿ Umang Tiwari (@stocksgeeks) - The walking encyclopedia. Strategy switching (swing, hybrid, intra) as per the market conditions. Multiple setups that are supposed to make money in whatever situation possible. You need to have speed, energy & motivation to be here. ———————————————— Disclaimer: - I'm not an affiliate of any of the mentioned persons. - I'm not to be held responsible by any of their past, present or future actions. - This list is neither exhaustive nor infallible.
Nitin R tweet media
English
31
28
198
22K
Harshit Bothra
Harshit Bothra@Breakout_trades·
A Beautiful FY25 Comes to an End by blessings of God and Family 👏 A year full of Mistakes, Corrections , Learnings and New friendships 😊 Closing at 664.98% Jan-March Period DD went till 14.4% and now stands shy of 3% #KeepGrinding #Motivation
Harshit Bothra tweet media
English
45
5
288
198.5K