Sabitlenmiş Tweet
Benaiah
2.4K posts


Benaiah
@benaiahwarrior
I'm here to provide service to others for free. There is no higher purpose.
In a galaxy far far away Katılım Mart 2021
34 Takip Edilen5.2K Takipçiler
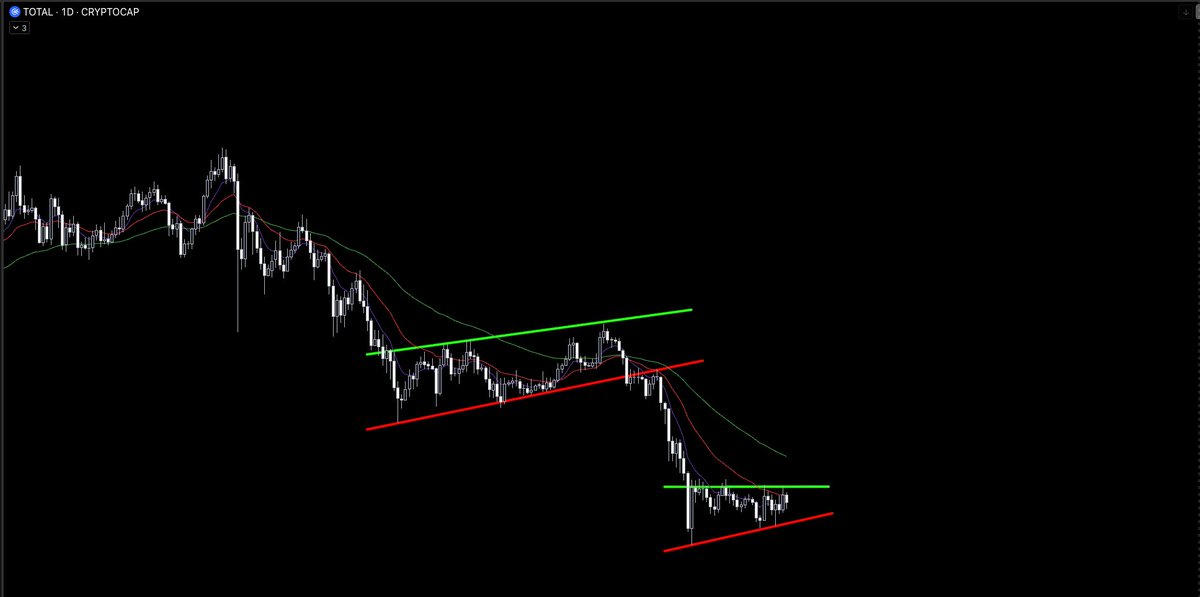
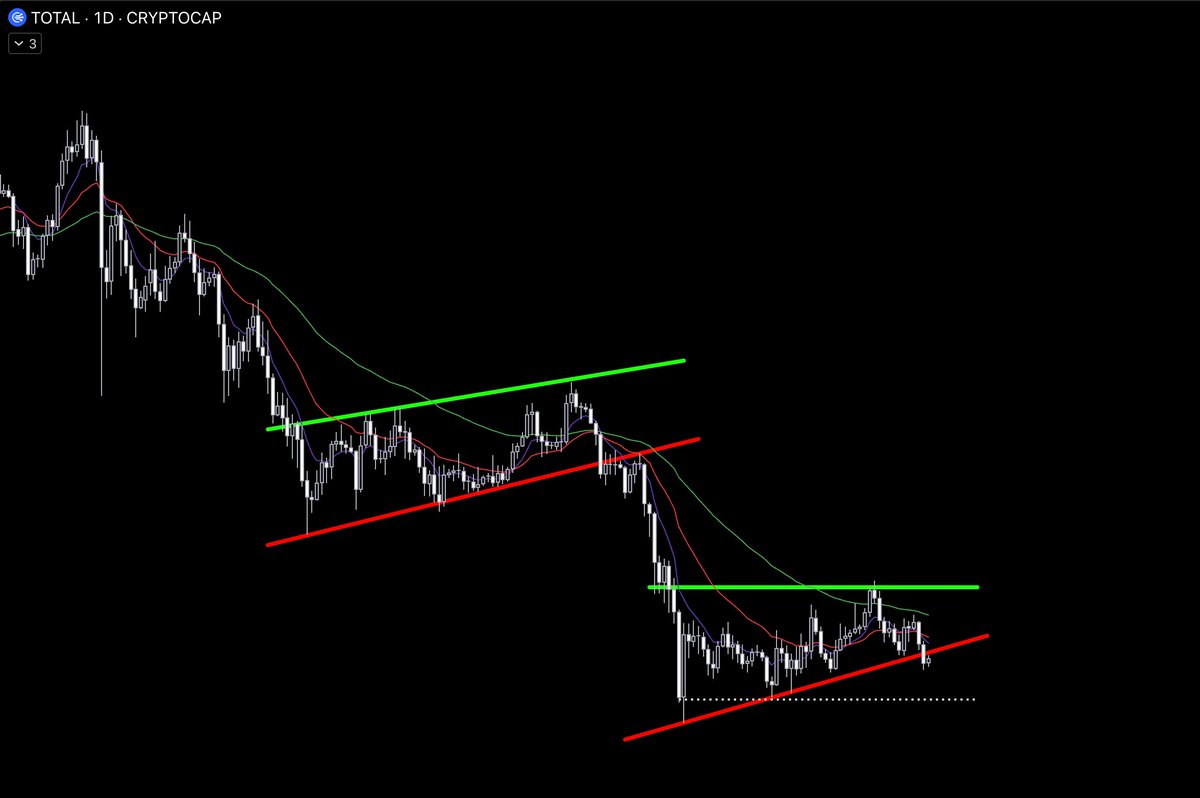
$TOTAL
I am still waiting.
Trading life for swing trader is boring at the moment.
We still have to wait.
Benaiah@benaiahwarrior
$TOTAL I know that things have been quiet on my channel. There's just nothing to do. I don't have the time or the desire to waste your time and energy by constantly posting something.
English

As prices go lower and lower it makes sense to start thinking about the next cycle. We aren't there yet, timing is still premature but you still need map out a plan.
For me I have in capitals in my notes: 'START BIDDING BTC LOW 50'S LIKE YOUR LIFE DEPENDS ON IT'.
This is when the real money is made, in the depths of a bear market.
In terms of alts there are only two that really grab my attention for a new cycle play. I will reiterate that we are still too early, I have not started buying anything yet.
$PUMP - It is the 'leader' when it comes to memcoin trading. It holds a huge monopoly over the market. I think out of the 2 it has higher % upside. Even to this day I have normie friends who talk about trading on pumpfun. The younger generation is addicted. This will not just disappear.
$HYPE - Too high of a valuation right now for me to think about comfortably buying. I think this will continue to do well next cycle by a long shot vs other alts. Onchain trading will only leech more and more marketshare from CEX's as time goes on.
For now, we watch and wait in cash and try not to lose money in between. There is a time to reap and a time to sow...
English

What TA style do you prefer?
Long, detailed analysis with a clear conclusion, or short and straight to the point? Let me know.
Daily Crypto Trading@DailyCryptoTrad
🚨 Urgent: $BTC Top Imminent – Brace for a Blow-Off Top! 🚨 We have accurately predicted every target since 2023, and I have been clear that after reaching $100k+, we would be approaching a top. Now, after more than a year, we are finally here. We have nailed BTC targets at $43k, $50k, $60k, $73k, $48k, $82k, $89k, and $99k🎯. Nothing has changed in my long-term TA, and just because we reached my goal from $30k to almost $100k, I am not going to change my TA due to shifting sentiment. I remain true to my analysis until it is invalidated. This TA will show you the invalidation points and some of the last targets before a final drop. I understand there will be people who will insult me or call me names, but I do not care about them. I care about my community. Remember, I do not get paid for sharing these free insights; they are my own opinions. Most so-called influencers are not traders and will brainwash you to have one bias while selling their VIP groups or shilling their tokens, which they get paid to do. In this channel, we never had one bias; we had different scenarios with different probabilities, and we have nailed every target as mentioned. Now, the final blow is nearing. Ask yourself why I went from super bullish to bearish now? While everyone else was calling for a $60k top, we were targeting $100k+. Everyone who followed me knew my target. I have not changed my stance; I always showed you the bullish target and the bearish scenario and was very clear that once we went from $30k to $100k+, we were nearing the top. This should not take you by surprise. See every TA I posted. Before diving in, I’d appreciate your support with likes, reposts, and comments to help grow the channel and keep this content coming. These analyses take time, and your appreciation fuels the drive to keep sharing! Macro Overview Recap: If you haven’t already, check out my macro analysis on the inevitable recession. Understanding this is essential before diving into the charts. Recession: x.com/DailyCryptoTra… Warren Buffet's Cash Pile: x.com/DailyCryptoTra… Bitcoin Charts Analysis: Elliott Wave Theory: My Elliott Wave (EW) analysis has been spot-on since late 2023 and hit all targets. However, I am recounting sub-wave 5 since the structure has changed. We have an impulsive wave 3 which is overextended and losing momentum. This does not mean we cannot reach $100k+, but we need to stay cautious. We need our pullback to sub-wave 4 around $75k-$81k to hold (Fibonacci level shows $84k-$80k). Once we complete wave 4, we have our last impulsive wave, meaning there is still some fuel left. We can sometimes form truncated waves, which means wave 4 won’t reach wave 5 or hit the old ATH and make a double top. But if we get a strong wave 5, we could see a 40-50% increase from the $80k level, reaching Fibonacci levels of 3.272 at $113k, 3.414 at $117k, and 3.618 at $121k. This would be the best-case scenario. The invalidation point is if we go over $130k; then, this gets invalidated, and a potential target at $170k can be reached, but we need structure to confirm this first. Once traditional markets, especially the Nasdaq and S&P 500 tech stocks, correct, Bitcoin is likely to follow, leading to a blow-off top as mentioned. At that point, BTC could drop to $17k-$30k, depending on the peak. This would form a massive ABC corrective pattern with Fibonacci targets at $52k and $31k before finding a bottom. This scenario aligns with a recession-driven market decline. Invalidation Points: This scenario could be invalidated if: 1. Markets reset/correct after 1-2 years. 2. Geopolitical tensions or wars are avoided. 3. A recession is avoided. 4. No black swan events occur. However, if even one of these factors plays out, a market crash becomes highly probable. Be open-minded about these possibilities; ultimately, it is YOUR job to protect your capital. Weekly Chart: • Volume: Low volume while price action is increasing – bearish signal. • RSI: Overbought, showing a bearish divergence since April. This is a high probability given the overbought zone but could be invalidated if RSI reaches 90. • RSI Stochastic: Overbought but can remain so for up to a month. • MACD: Bullish momentum but losing its momentum, bullish cross, and lines above 0 are also bullish. All indicators suggest BTC is gearing up for a blow-off top, but there is still some fuel left. Daily Chart: RSI: Consolidating and above 50 – bullish. RSI Stochastic: Oversold – bullish. MACD: Bearish momentum, bearish cross, lines above 0 bullish. Volume: Weak – bearish. The daily chart suggests a need for consolidation and finding solid support before another move up. A retracement is likely, aligning with our Elliott Wave (sub-Wave 4) expectation. We are getting overextended. Liquidity and Liquidation Heatmap Insights: Our liquidity and liquidation heatmaps on TradingView reinforce this outlook, showing significant liquidity pools aligning with our targets. Access the same tools at Daily Crypto Trading. Conclusion: Based on my analysis, I firmly believe that BTC is approaching a top, with a likely range of $100k-$120k, especially if the Nasdaq and S&P 500 also peak. This outlook has been consistent since late 2023 and is supported by our Elliott Wave analysis and broader market trends. However, several factors could disrupt this trajectory: • Recession: As previously discussed, an economic downturn could align with a traditional market correction, significantly impacting BTC. • Geopolitical Changes: Major shifts in global politics could introduce volatility, affecting market sentiment and BTC's price. • Black Swan Events: Unforeseen events can always change market outcomes, as seen in past sudden market shifts. • Market Shifts: Significant moves in traditional markets, such as those driven by geopolitical tensions or policy changes, could impact BTC. if we avoid these factors, BTC has the potential to reach as high as $170k, as indicated by our Elliott Wave projections. The strong correlation between BTC and the tech sector suggests that a blow-off top is likely, especially with the current market boost from the "Trump Pump" driven by election cycles. However, potential trade wars or rate cuts could complicate this scenario. In summary, while BTC could reach new highs, managing risk is crucial. The market is full of probabilities, not certainties. Although our targets have been accurate so far, future outcomes are never guaranteed. This analysis is meant to guide your understanding, but always verify and strategize based on your own judgment. #bitcoin #recession
English
CT went from “$1M $BTC” at $120K to doom and gloom at lows. Same cycle every time. 🤣
No discipline. No structure. Just noise.
English
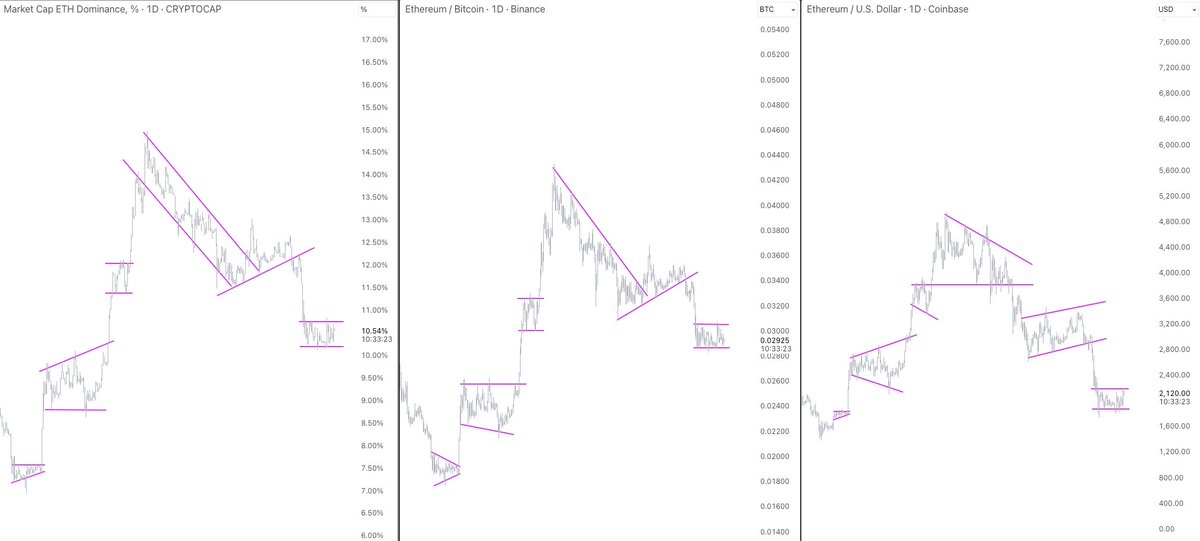
@IncomeSharks different pair on different exchanges lead to different OBV
English
$FET - OBV once again an incredible leading indicator. Usually my issue with OBV isn't it being wrong, it's not trusting it enough.
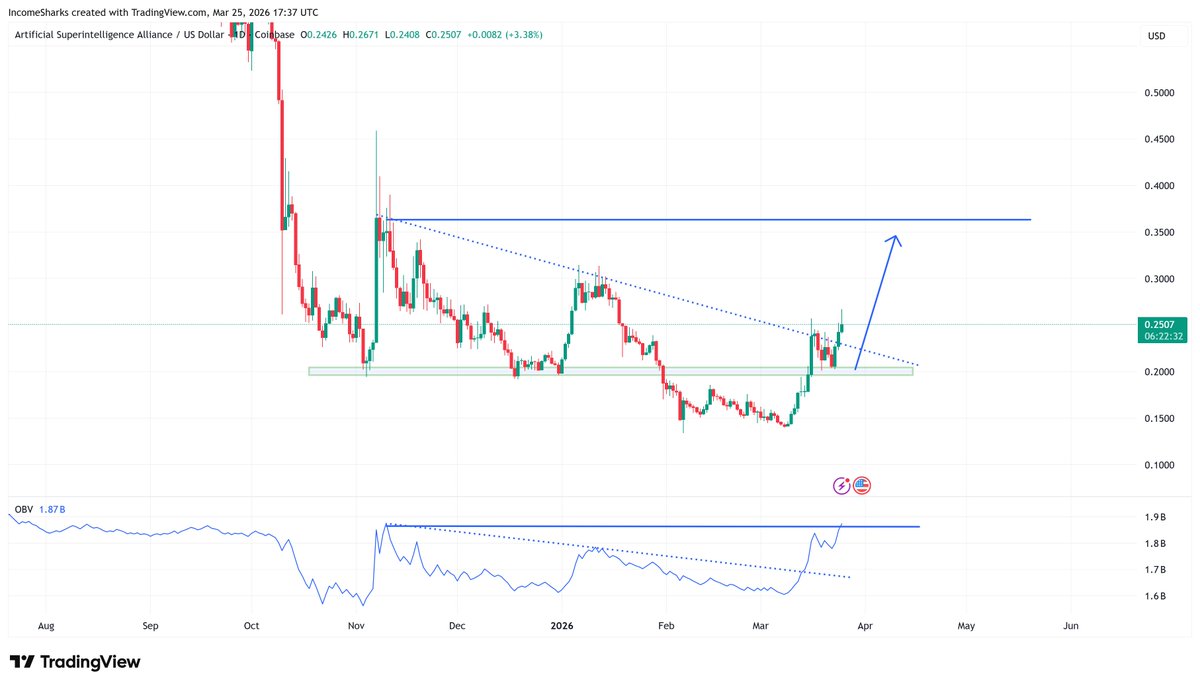
IncomeSharks@IncomeSharks
$FET - If you had been living under a rock for a year and saw this chart what would your thoughts be. If you like OBV it's been a leading indicator.
English
$HYPE outperformer
$TAO outperformer
$ASTER outperformer
Benaiah@benaiahwarrior
High conviction & High liquidity spot bag for different narratives. HODL timeframe: Years. So far ... AI $TAO DEX $ASTER $HYPE $APEX
English
@fgenstart @thedefivillain funding changes all the time ... not a usefull indicator
English

@thedefivillain the only crime here is looking at that chart and thinking its repeatable
funding says wait but we all get baited
we learn nothing, we just watch again next time
English

Absolutely gigantic round 2 on $SIREN, it went up +440% bottom to top in one day and 50x in total
Next-level crime once again
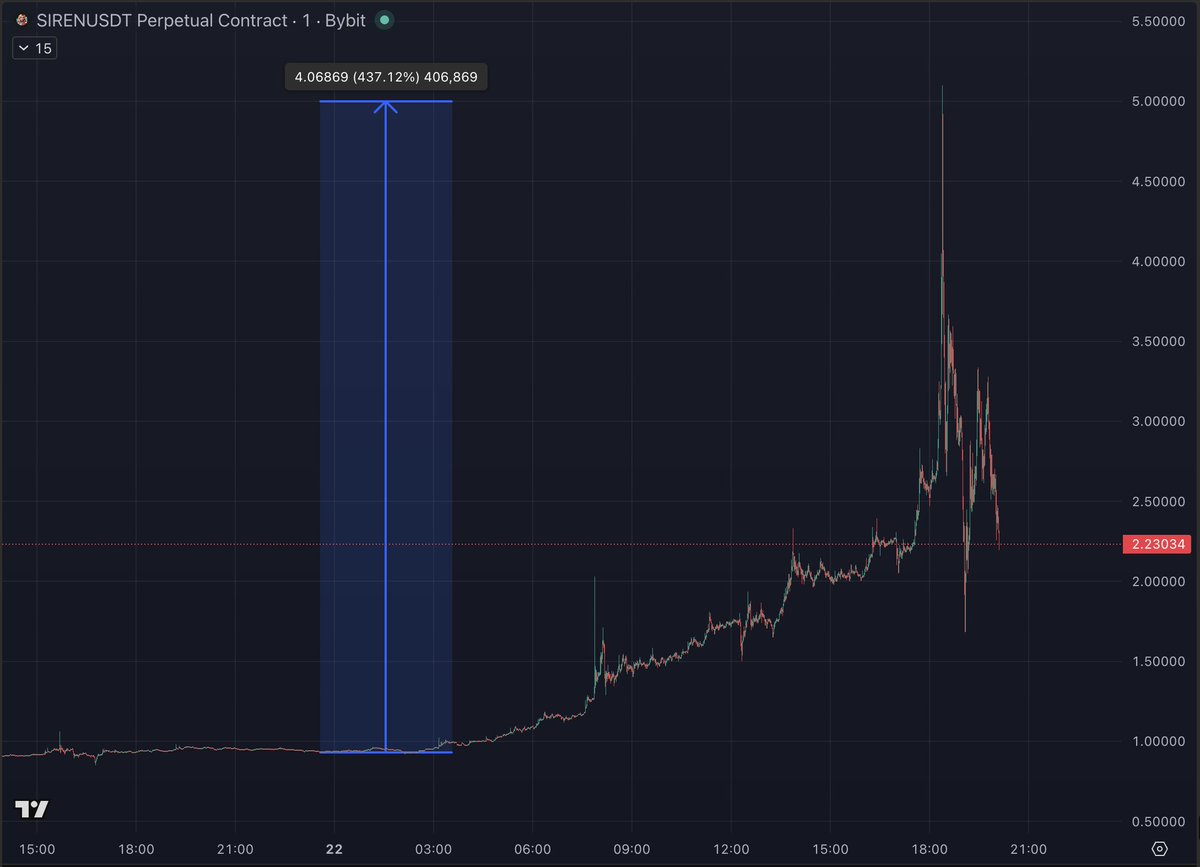
VIKTOR@thedefivillain
They launched round 2 with very negative funding which makes the short dangerous again And given the fact that it's not weak... it looks like they could squeeze it again to target another whale short Another insane crime
English
@Evol21x @Mithran80477729 @ChronosIntelX @iluminatibot Switch off the Wi-Fi router when you’re not using it. The device can be extremely harmful to your health.
English

@Mithran80477729 @benaiahwarrior @ChronosIntelX @iluminatibot I wish I knew anything about what both of you were talking about but for now I’m gonna have to agree with the wizard.
English

@Mithran80477729 @ChronosIntelX @iluminatibot Yes they are modulated but are transmitted in pulsed packets and the beacon signal is transmitted at 10 Hz.
English

English
@ChronosIntelX @iluminatibot Unlike microwave signals, Wi-Fi signals are digitally pulsed (often at a frequency of 10 Hz). These artificial rhythms can increase physical stress, trigger oxidative stress in cells and affect the blood-brain barrier – even if the energy is far too weak to heat the tissue.
English

📡 WiFi operates at 2.4GHz or 5GHz non ionizing radiation the same frequency range as microwave ovens but at roughly 100,000 times lower power. At these energy levels, photons cannot break chemical bonds or damage DNA.
The peer-reviewed evidence on WiFi and plant growth shows no consistent effect at standard exposure levels. A widely circulated Danish school experiment showing similar results was never peer-reviewed, had no controls for temperature, CO2, or soil variation, and has been repeatedly debunked by independent replication.
What this video likely shows is confirmation bias combined with uncontrolled variables. Seeds germinate at different rates based on soil moisture, light, and temperature differences invisible to the camera.
The question worth asking isn't whether WiFi affects plants. It's why we find it so easy to believe it does.

English
@DailyCryptoTrad not now ... first one more correction down ... check also the ETH OI on Binance ... the masses feel to confident to go long atm
English
DCT Alpha liquidation chart shows a major $74M $BTC short liquidation cluster at $100K on Hyperliquid.
Is this the relief rally target we waiting for?
$100K also acting as key resistance

English
@thedefivillain ETH OI on its all time high while the price has been steadily in the green for 7 days?
First an ugly dump is coming, and it's going to be brutal.
This will be the last dump and then "up only".
English

what phase are you in on your health awakening?
1. mark hyman
2. andrew huberman
3. bryan johnson
4. paul saladino
5. ray peat
6. carnivore aurelius
7. aajonus vonderplanitz
8. old italian man
English

Lit was the generational bottom, hype still higher.
Burgerflipper@trmachine888
Equity perps are where crypto perps were before basis arb matured. Today: high carry, thin books, messy execution. Tomorrow: deeper liquidity, tighter spreads, lower funding, once spot access and arb capital show up. I am in both (hl/lighter)
English
@DailyCryptoTrad Social media thrives on emotion. Only hope or hatred work here.
English
I get very little credit for the work I put into my free TA. That’s honestly why I’ve been less motivated to share it lately and mostly keep it to myself.
When I posted my long-term call for a 120k–130k cycle top, with a EW projection in 2023 I got insulted, mocked and called every name you can imagine. Just for sharing something most people didn’t want to hear at the time.
Now months/years have passed and the move played out almost exactly as the TA suggested. Not many people were even close to that call. Not Dr.profit, capo pr any of the big CT gurus.
But I guess hitting every major top/bottom target in this cycle since 2023 is just “luck”.
Daily Crypto Trading@DailyCryptoTrad
🚨 Bitcoin Blow-Off Top Incoming – Final Exit or $170K Moon?🚨 $BTC has been following our long-term plan since 2023 beautifully, and we are nearing my final blow-off top of Fib 1.618 price at 120-130k or extreme euphoria to 2.618 at 170k. However, invalidation is above 170k. The blow-off top, which I believe could happen this year, but timing is very hard, and we do not try to predict the next move. We try to read the charts and give us probabilities. If you have been following me for some time, we have been very accurate, and your probability has made tons of money. So if you enjoy these long-term and short-term analyses, save this as a bookmark, like, and comment to keep my channel alive. It's free, and I appreciate it! Macro Overview Recap If you haven’t already, check out my macro analysis on the inevitable recession. It’s essential before diving into the charts: 📌 Recession: x.com/DailyCryptoTra… 📌 Warren Buffet's Cash Pile: x.com/DailyCryptoTra… 📌 Japan's inflation problem: x.com/DailyCryptoTra… 📌 Justin Sun Rug Pull USDD (Luna V2): x.com/DailyCryptoTra… 📌 Trump's Tariff War: x.com/DailyCryptoTra… Elliott Wave Theory We are still on the path to a last impulsive wave 5. As mentioned in the last TA, “we could see an ‘extended wave 3’ (polywave), where wave 3 targets Fib levels 2.618 (price: 105.8k) and sub-wave 5 hits Fib level 3.618 (price: 118.5k), which aligns with our final blow-off top at 118–130k.” This has been unfolding perfectly. We had our wave 3 done and moved down a corrective wave 4 with an ABC zigzag and now move towards our final blow-off top, possibly in July-August, but timing is very difficult. As I wrote last time, if we fail to reach the previous ATH, we get what’s called a truncated wave 5, so we MUST surpass 109.6k and find support. If we do, this case is very strong; if not, we may have already seen our blow-off top. This is the best-case scenario. The invalidation point is if we exceed $130k. Then the current wave setup is invalidated, and we could target $170k if we get confirming structure. I'm going to sound repetitive now, but as mentioned earlier, once traditional markets (especially Nasdaq and S&P 500 tech stocks) correct, Bitcoin is likely to follow, leading to a blow-off top as discussed in my long-term BTC TA. At that point, BTC could drop to between $17k and $30k, forming a massive ABC corrective pattern with Fibonacci targets at $52k and $31k before finding a bottom. This only happens AFTER wave 5 is complete, not before—the structure needs to finish first. Invalidation Points This scenario could be invalidated if: 1. Markets reset or correct after 1–2 years. 2. Geopolitical tensions or wars are avoided. 3. A recession is avoided (low probability). 4. No Black Swan/Rhino events occur (Rhino is already here). If even one of these factors kicks in, a market crash is highly probable. Remember, it’s YOUR job to protect your capital. We’re already seeing an ongoing tariff war and ongoing wars that will globally impact the economy and cause a severe slowdown. Technical Indicators Weekly Chart Analysis: • Volume: Showing a bearish divergence, a bearish signal. • RSI: At 63 (bullish). The 50 level must hold; otherwise, expect further downside. Once we break 70, we must go above 71. If we dip down while price action goes down, we have a big bearish divergence. • RSI Stochastic: 79, which is quite high but is slowly going down to cool off, which is bullish. • MACD: Losing bullish momentum, but both lines remain above 0. We’re seeing signals for a final blow-off top. Daily Chart Analysis: • RSI: 68 bullish, but we need it to reach 85 or above to break the bearish divergence. • RSI Stochastic: Getting overbought, which is a bearish sign. • MACD: Showing bullish momentum; lines crossing above 0 – staying above confirms bullishness. • Volume: Low, with slight bearish divergence. Liquidity & Liquidation Heatmap Insights Our liquidity and liquidation heatmaps on TradingView reinforce this outlook, showing significant liquidity pools that align with our targets. Access these tools at Daily Crypto Trading – check my profile for details. Conclusion My outlook remains consistent: BTC is approaching a top, likely in the $120-130k range, especially if Nasdaq and S&P 500 also peak. This projection has held since late 2023, supported by both our Elliott Wave analysis and broader market trends. We formed an impulsive wave 5 with a sub-wave 3 done and corrective wave 4 moving towards sub-wave 5 for the final blow-off top. I'm going to repeat myself from last time, but if you're new here, this is mostly what I wrote last time, and most of it has not changed because the thesis is still firm. The ongoing tariff war could disrupt our anticipated blow-off top and turn EW into a truncated wave 5. I stand by my 2023 analysis, which remains valid until BTC surpasses $130k. I’ve always believed in a blow-off top during the 49k to 100k+ phase (where I was bullish), and my thesis hasn’t changed – no data has disproven it. We’re in an AI bubble, and bubbles always pop. • Recession: An economic downturn could sync with a traditional market correction, hitting BTC hard. • Geopolitical changes: Major global shifts (like the ongoing tariff wars) could bring serious volatility. • Black Swan events: Always a risk – never rule them out. • Market shifts: Big moves in traditional markets, driven by geopolitics or policy, will hit BTC. If these are avoided, BTC could reach $170k, as our Elliott Wave projections suggest. The strong BTC–tech sector correlation indicates a likely blow-off top. However, ongoing trade wars or rate cuts could complicate this. If BTC surpasses 109k and holds it as support, get ready for a new ATH in the 113k–130k range. If we break below 70k, we already had the top. Blow-off tops always end in euphoria and FOMO buying. In summary: While BTC could reach new highs, managing risk is crucial. The market is full of probabilities, not certainties. Although our targets have been accurate so far, future outcomes are never guaranteed. This analysis is meant to guide your understanding – always verify and strategize based on your own judgment. #bitcoin #recession
English
@helios_brah Do you understand that you don't need to drink that overpriced nonsense, because there is enough magnesium in food?
Do you understand this ANON?
English


@yoursimmo11 All the sources from "Your Body's Many Cries for Water: You Are Not Sick, You Are Thirsty" proves that you are wrong.
English

You've been lied to about hydration.
"Drink a gallon a day" was never based on science.
It was based on a misread 1945 food board recommendation that included water FROM FOOD.
Here's what a gallon of plain water actually does to a man over 40:
- Dilutes stomach acid.
- Wrecks digestion.
- Flushes sodium, potassium, and magnesium.
- Tanks energy.
- Increases urination.
- Depletes minerals faster than you replace them.
You're not hydrating. You're strip-mining your own mineral reserves.
English