David Arias

24K posts

David Arias banner
David Arias

David Arias

@Dav_AriC

@MadridProyecta • Libertas virorum fortium pectora acuit.

Chicago, IL Katılım Mayıs 2012
1.3K Takip Edilen2.5K Takipçiler
David Arias retweetledi
Kiko Llaneras
Kiko Llaneras@kikollan·
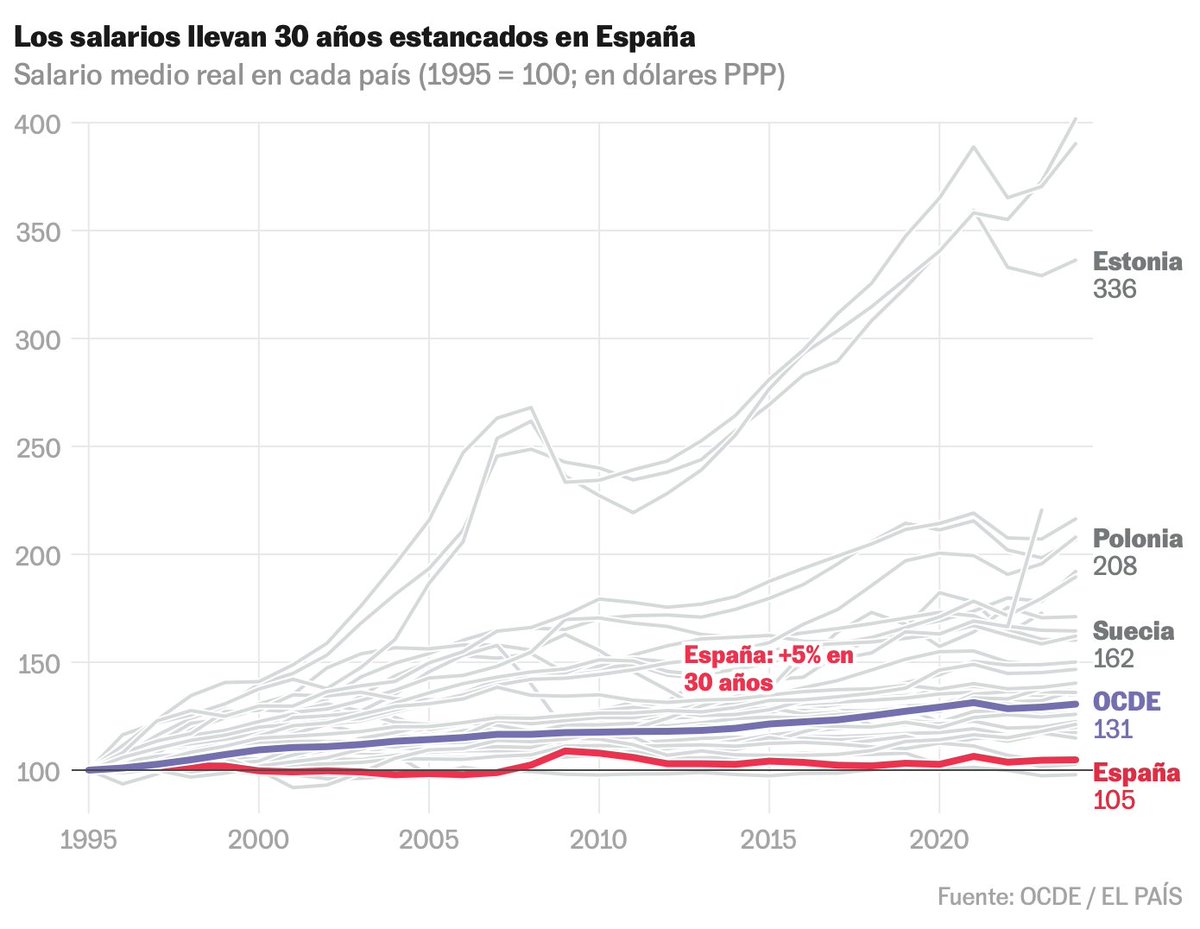
💰 ¿Suben los salarios en España? 
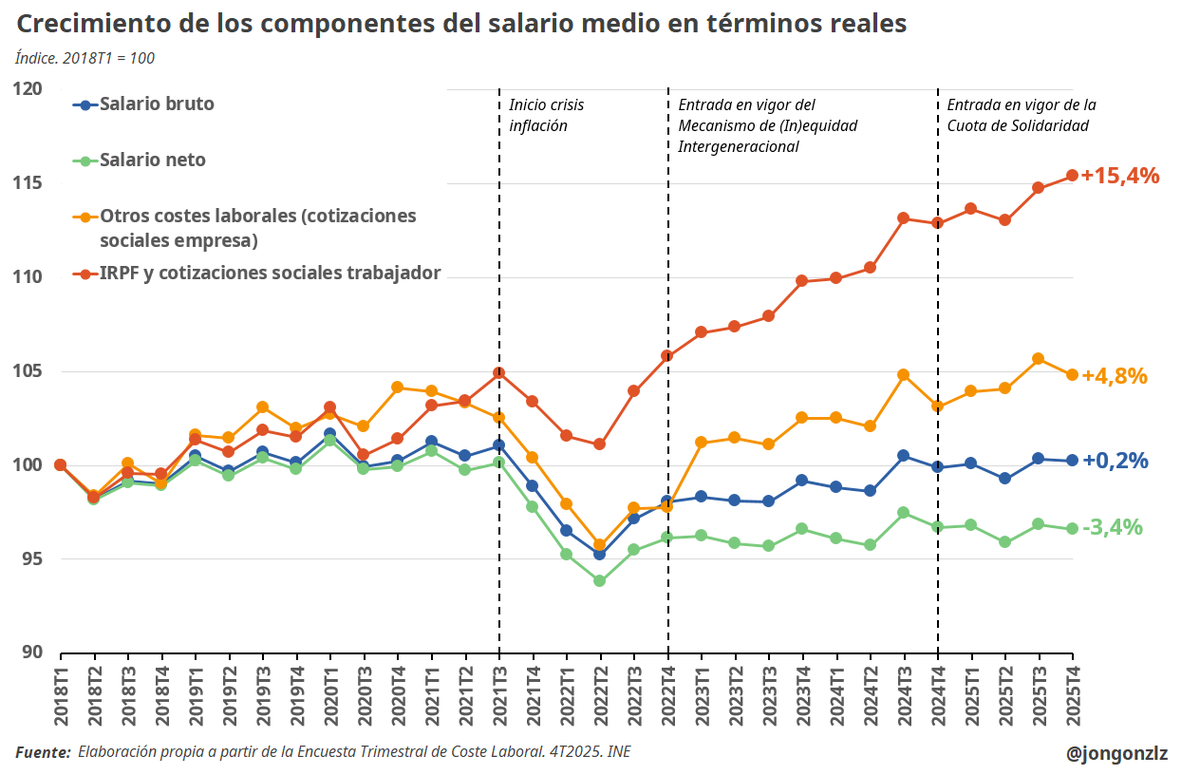
En realidad llevan 30 años estancados. El sueldo medio real solo sube 5% desde 1995, frente al 31% de la OCDE. Datos de sueldos, generaciones e impuestos:
Kiko Llaneras tweet media
Español
66
968
1.7K
155.9K
David Arias retweetledi
Jon González
Jon González@Jongonzlz·
Ha llegado el momento. Hoy, a igualdad de salario real, todos los trabajadores pagan más IRPF que en 2019. No es una opinión: son los datos. La inflación ha empujado a millones de personas en España a pagar más sin ganar más en términos reales. Deflactar el IRPF no es una cuestión ideológica; es justicia fiscal, especialmente con las rentas medias-bajas. Partidos del @ppopular @vox_es @JuntsXCat @eajpnv_eu @coalicion @upn_navarra. Es la hora de olvidarse de las diferencias y unirse por un objetivo común para mejorar la vida de los españoles. Asociaciones @atenea_esp @UnivHesperides @juandemariana @InstitutOstrom @voceslibres_esp @CivismoF. Es el momento de empujar esta medida. Hay que pasar de la 'Proposición no de ley' a una 'Proposición de ley' en el Congreso que deflacte los parámetros del IRPF de forma razonable pero suficiente. Si el Gobierno se escuda en el artículo 134.6 CE para no negociarla, amenazar con una moción de censura. Tenéis los números.
Jon González tweet media
Español
122
3K
6.8K
519.8K
EL PAÍS
EL PAÍS@el_pais·
El Ayuntamiento de Madrid pretende duplicar o incluso triplicar las 150.000 viviendas que se prevé edificar en proyectos ya aprobados, elevando la densidad en nuevos barrios e incluyendo más pisos en zonas consolidadas elpais.com/economia/vivie…
Español
24
15
104
140.7K
David Arias retweetledi
Jesús Fernández-Villaverde
Jesús Fernández-Villaverde@JesusFerna7026·
Últimamente no he colgado nada en español porque la situación en España me deprime bastante. Un ejemplo es este anuncio del PP sobre ocho medidas si llega al gobierno, que aquí incluyo. Fijémonos en estas ocho medidas. Una, la ley sobre ELA, afecta a una minoría muy pequeña del país. Sí, tener esta enfermedad es una desgracia, pero estamos hablando de 900 casos al año en un país que se acerca ya a los 50 millones de habitantes. Es “buenismo” en su manifestación más mediocre. Otra, bajar el IVA de los productos básicos, es demagógica y en contra de la teoría económica básica. Modificar la Ley Presupuestaria para que haya un mayor control sobre el gasto en defensa y seguridad resulta irrelevante. Y las otras varían entre lo necesario pero no muy importante (la independencia del CIS) y lo esperpéntico (modificar la Ley de Costas). España tiene cuatro problemas existenciales: 1) Fecundidad. 2) Inmigración. 3) Falta de crecimiento de los salarios reales. 4) Vivienda. Ni una de estas medidas tiene nada que ver con 1)-4) (excepto, de pasada, la ley antiocupación). ¿Por qué? Porque cualquier cosa que de verdad contribuya a la solución de 1)-4) implicaría sacrificios para los votantes del PP: personas de más de 55 años que quieren dejar todo como está. De hecho, la ley antiocupación se menciona porque protege los derechos de propiedad de los mayores. Feijóo y el PP, más en general, tienen la idea del futuro de España de una ameba porque a sus votantes el futuro de España les trae el fresco mientras su pensión se pague y el precio de su piso no caiga. Y nada de lo que yo (o cualquier otro) pueda decir será capaz de mover ese macizo carpetovetónico.
Jesús Fernández-Villaverde tweet media
Español
244
1.9K
5.4K
395.8K
Asociación Vecinal Cuatro Caminos-Tetuán
El Ayuntamiento quiere saber tu opinión del Plan Estratégico Municipal. La nuestra: aumentar alturas y edificabilidad expulsando vecinas, como tienen previsto para Tetuán, solo se explica por especulación. Expresa la tuya directamente el 30/04, 18h en Colón. #TetuánNOesunsolar
Asociación Vecinal Cuatro Caminos-Tetuán tweet mediaAsociación Vecinal Cuatro Caminos-Tetuán tweet media
Español
3
10
11
2.9K
David Arias retweetledi
Theo - t3.gg
Theo - t3.gg@theo·
Spain's egregious Cloudflare blocks are breaking Docker now 💀
Theo - t3.gg tweet media
English
141
472
3.9K
1M
David Arias retweetledi
izena イゼナ
izena イゼナ@yz7sha·
Population pyramid of Asturias: The autonomous community with the lowest TFR on mainland Spain. 0-14: 9.80% 15-64: 61.84% 65 and over: 28.36% Foreign population: 6.80%
izena イゼナ tweet media
English
20
46
304
137.9K
David Arias
David Arias@Dav_AriC·
@JesusFerna7026 Do you have data/intuition on how rapid TFR decline in origin countries might reshape immigration flows, given each destination's source-country mix?
English
0
0
0
152
Jesús Fernández-Villaverde
Jesús Fernández-Villaverde@JesusFerna7026·
The Philippines is a fantastic example of how deep and fast the drop in fertility is nearly everywhere on the planet. Just last week, on March 30, 2026, the Philippine Statistics Authority released the 2025 National Demographic and Health Survey (NDHS). The total fertility rate for the last three years has reached 1.7 children per woman, a dramatic fall from 4.1 in 1993, and well below the replacement rate (around 2.1 for a country like the Philippines). Since the NDHS computes the total fertility rate over three years, and it is dropping quickly, the total fertility rate for 2025 alone should be around 1.6, the same level as in the U.S. Let me repeat this: the Philippines and the U.S. have roughly the same total fertility rate. But U.S. income per capita is about 7.3 times the Philippine income per capita (when adjusted for purchasing power parity). Or to put it differently, Philippine income per capita today is the same as the U.S. had in 1910. In that year, the total fertility rate of the U.S. was around 3.5. At the same level of income per capita, the Philippines has a total fertility rate that is less than half. In some more urban regions, such as Calabarzon, the total fertility rate is 1.3. Historically, the rest of the country has followed the patterns of regions like Calabarzon with some lag, so the most likely scenario is that in a few years, the Philippines will have a total fertility rate of around 1.3 as well. Compared with the United Nations World Population Prospects (WPP), the Philippines is now at the fertility level the WPP had forecast for 2047, despite the aggressive reduction it made to the Philippines’ forecast fertility between 2022 and 2024. The Philippines is interesting because, compared with other Asian countries, it is a relatively religious and rural country without the Confucian obsession with education found in China or South Korea. It is also a country that many still associate with high fertility. Just yesterday, one reader left a comment on my previous post on fertility, using the Philippines as an example of high fertility, that “refuted” my claims. No, it does not. Finally, three technical points. First, I am reporting total fertility, not completed fertility (and yes, I am keenly aware of the difference between the two). Looking at age-specific fertility rates suggests that completed fertility for younger women will actually be below the current total fertility rate. Second, no, emigration does not matter here. I am talking about fertility rates, not birth rates. Third, the official release: psa.gov.ph/content/fertil…
Jesús Fernández-Villaverde tweet media
English
89
349
1.9K
852K
David Arias
David Arias@Dav_AriC·
@kikollan Tengo curiosidad por ver si las interfaces como Claude Code o Codex (o lo que venga después) ensancharán esa brecha o todo lo contrario.
Español
0
0
0
67
David Arias
David Arias@Dav_AriC·
@kikollan Lo que más me impresiona cuando hablo con gente no técnica es la brecha de adopción y la cantidad de usos potenciales que todavía quedan por implementar, incluso si el desarrollo de la IA se estancara.
Español
1
0
3
534
Kiko Llaneras
Kiko Llaneras@kikollan·
Hay una brecha con la IA. Los que la usan de verdad. Alucinan, exploran y se preguntan qué es lo que se nos viene encima. Los que no la usan. Y no saben lo que se nos viene encima.
Español
124
263
1.5K
217.9K
David Arias retweetledi
Jon González
Jon González@Jongonzlz·
Con la nueva ETCL estimamos la evolución ajustada a la inflación de los distintos componentes del salario medio desde el 1º Trimestre de 2018. 🔵Salario bruto: +0,2% 🟠Cotizaciones S.S. empleador: +4,8% 🔴IRPF y cotizaciones S.S. trabajador: +15,4% 🟢Salario neto: -3,4%
Jon González tweet media
Español
32
498
842
129.8K
David Arias retweetledi
Robert Colvile
Robert Colvile@rcolvile·
'At this point, 'building housing reduces rent' is as close to a scientific law of the housing market as we’re likely to find' - @Noahpinion
Robert Colvile tweet media
English
72
481
2.4K
115.4K
David Arias retweetledi
emily north
emily north@north0fnorth·
sometimes i think about what it must’ve been like to live in chicago from 1969-1973 and see 3 of the top 5 tallest buildings in the world at the time completed in a 4 year span right next to each other
emily north tweet mediaemily north tweet media
English
35
168
3.6K
290.3K
David Arias retweetledi
Jesús Fernández-Villaverde
Jesús Fernández-Villaverde@JesusFerna7026·
Las características electorales de las regiones evolucionan con el cambio social, a veces de manera profunda. Uno de mis ejemplos favoritos es Londres. Por mucho tiempo, los conservadores obtenían sólidas mayorías parlamentarias entre los miembros del Parlamento elegidos en Londres. En el pantallazo adjunto (de wiki) se muestra la tabla de resultados de los Tories en el área del Gran Londres. En los años 70 y 80, los conservadores obtenían claras mayorías en el Gran Londres (como en 1987, 58 de 84 diputados) o se mantenían incluso cuando, a nivel nacional, flojeaban (como en octubre de 1974, 41 de 92 diputados). Fue solo a partir de 1997 que el voto tory empezó a desaparecer en Londres, hasta alcanzar en 2024 un mínimo histórico de 9 de 75 diputados. Uno no puede asumir que una región como Madrid, que hoy vota como vota, seguirá votando así en 2040. De hecho, Madrid no votaba en 1977 como lo hace hoy en día (ni Andalucía ni Extremadura). La realidad es dialéctica.
Jesús Fernández-Villaverde tweet media
Español
29
48
328
63.2K
David Arias retweetledi
Jesús Fernández-Villaverde
Jesús Fernández-Villaverde@JesusFerna7026·
Over the weekend, I wrapped up a new version of my paper “The Neoclassical Growth of China” with Lee Ohanian and Wen Yao: sas.upenn.edu/~jesusfv/Neocl… The main change from previous versions is that we thoroughly redid the analysis using PWT 11.0. This was important because it allowed us to extend the sample to 2023. The additional years are quite informative, although to our pleasant surprise, in full agreement with what the model in the previous version of the paper had predicted using data up to 2019. I include my favorite figure from the paper in this post, which compares China with other East Asian economies at similar income per capita levels. To do so, we identify the year in which each of China, Korea, and Taiwan reached Japan’s 1950 per capita income level; the earliest year available for Japan in PWT 11.0. Japan's income per capita in 1950 was $3,138 (2021 PPP dollars), matching China’s in 1995, Korea’s in 1972, and Taiwan’s in 1961. Also, this initial per capita income of $3,138 is close to the middle-income threshold ($3,000) used by many international institutions and statistical agencies. We then trace the evolution of GDP and investment for each economy from that point onward. What do we see? First, China’s growth since 1995 has been remarkably similar to that of other East Asian economies when they were at the same level of GDP per capita, even though the distance to the technological frontier (proxied by the U.S.) was larger for China than for other East Asian economies because China took off later. Second, the growth pattern of all East Asian countries is amazingly similar. Third, in this pattern, there is a clear slowdown in growth once a country gets to around two-thirds of U.S. income per capita. While China might depart from the growth pattern of other East Asian countries in the future, there is absolutely nothing in the growth data to suggest this has happened so far. We tried all the variations of the same figure one could imagine. Some are in the paper, some got “cut” from the draft. But the main point is sharp: China is different because of its population size, not because of its growth pattern. Personally, I also think this graph shows that the burden of proof lies with those who argue that China’s future growth will differ from that of other East Asian economies. With a total fertility rate of 0.93, my bet is that China’s growth future will not be that different from Japan’s present.
Jesús Fernández-Villaverde tweet media
English
35
103
479
79.9K
David Arias retweetledi
Martinez
Martinez@MrtnzAlvrz·
La poblacion 18-35 años de MAD y BCN crece mas que en ninguna otra capital europea
Martinez tweet media
Español
23
12
58
58.5K
David Arias retweetledi
David Fernández
David Fernández@naroh·
Después de unos días de trabajo hago pública CONTRATACIÓN ABIERTA, una web donde se pueden revisar de forma fácil los contratos menores de las administraciones públicas de España. Hay más de 7,3 millones de contratos y 11.700 organismos públicos. 👇👇 contratacionabierta.es
David Fernández tweet media
Español
225
3.3K
7.2K
1.1M