Sabitlenmiş Tweet

When doing market making or cross exchange arb in crypto we discussed some of the issues of computing fair price from multiple geo-distributed data feeds.
Your quotes will arrive asynchronously from Binance, Bybit, Coinbase and so on, and each will be an indirect measure of fair price.
For example, how do you weigh the Binance and Bybit quotes that came in 35ms and 75ms ago against that Coinbase quote that came in 15ms ago? What about when the ordering is reversed?
Each exchange has a different level of liquidity, error, and basis, so even if the quotes were all equally fresh, there'd still be some decisions to be made. But latency adds an additional layer of complexity.
One mental model for this is ruler theory. Imagine trying to combine the measurements of a bunch of different rulers, each with their own bias (μ) and error (σ), into one optimal measurement.
Bias means a particular ruler is on average off from the truth by a consistent amount. Error means there is a random fluctuation by how much it is off from this average amount, sometimes a lot, sometimes a little, but usually within one stdev around the truth.
In physics, the way to weight each measurement is via precision weighting where each ruler is weighted by its inverse variance:
~ 1/σ²
A quote from a particular exchange is like a ruler measurement of fair price in that it too has its own bias and error.
The dominant part of bias is easy to measure, it is just basis, and a good start is to compute a rolling mean.
Error is a bit more complex. It will depend on liquidity, spread, volatility ... and time elapsed.
BTC-USDT on Binance is expected to be a less errorful measurement of BTC than the same instrument on say, Kucoin. But BTC-USDT on Binance 1 second ago is expected to be more errorful than BTC-USDT on Kucoin 10ms ago.
So there is an innate component to error and a time component. Total error squared will look something like this:
error² ≈ ε²_exchange + σ_price²·τ
where τ is the amount of time that has elapsed from when the quote was emitted to when you registered it, and ε²_exchange is the error unique to that instrument on that exchange (and at that particular point in time). For the time dependence, the assumption here is Gaussian diffusion, which is a defensible first order approximation when you are not near a significant liquidity event.
So errors have a component that grows at a speed proportional to variance, creating a kind of uncertainty cone as they propagate forward in time.
This tells you roughly how to weigh different quotes from different exchanges arriving at different times.
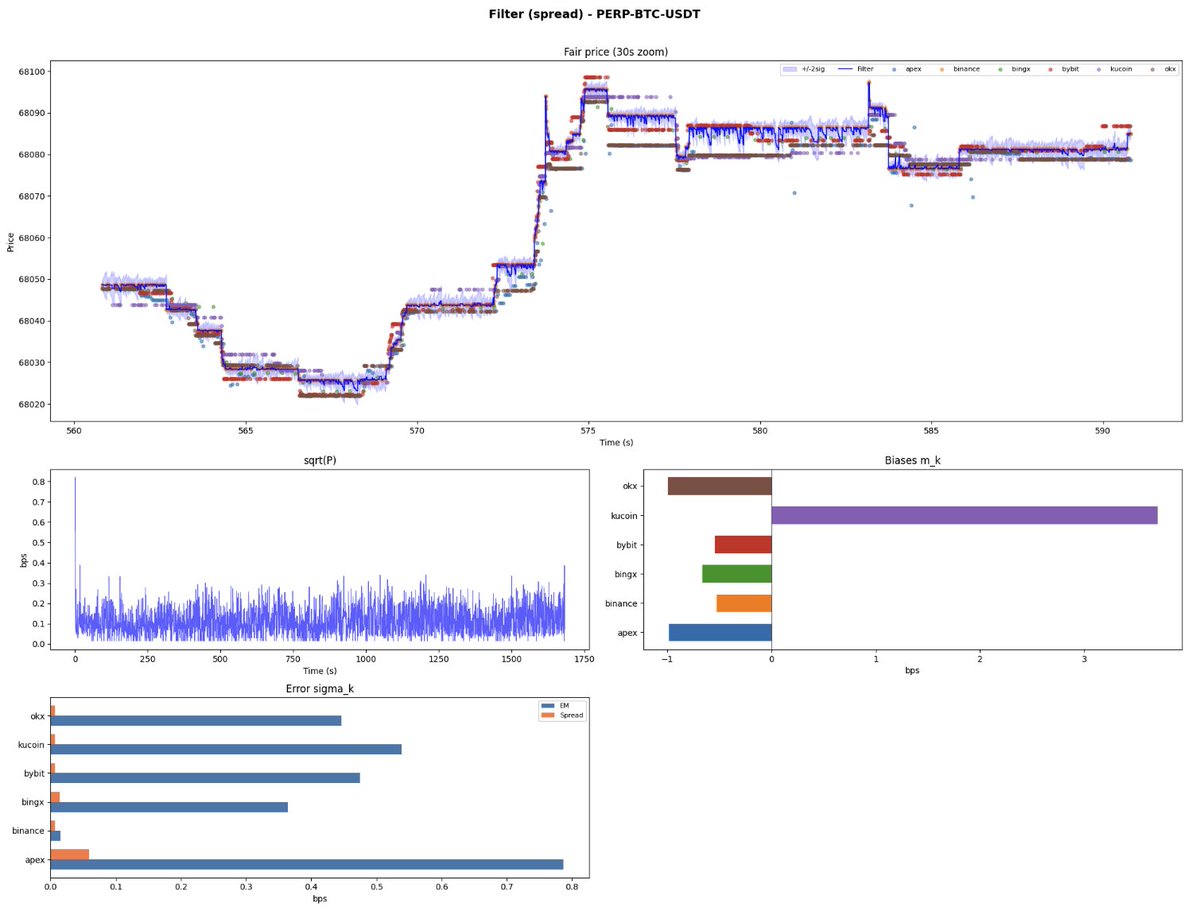
Below are plots from two models built on this intuition. Both are measurably better than just using the Binance mid-quote, and in production, more robust against feed glitches on any single exchange.
We'll discuss in more detail some concrete models that incorporate this intuition, and some that work surprisingly well while ignoring parts of it, in a subsequent post.

English