Değerli Yolcularımız,
Birleşik Arap Emirlikleri, Katar, Bahreyn, Kuveyt, Dammam ve Riyad seferlerini etkileyen gelişmeler nedeniyle yolcularımıza ek haklar tanımlanmıştır.
Uçuşlarınızla ilgili güncel bilgiye uçuş durumu sayfamız üzerinden ulaşabilir veya WhatsApp üzerinden TK Asistan ile sorgulama yapabilirsiniz. Detaylı bilgiye aşağıdaki bağlantı üzerinden ulaşabilir, bilet değişikliği ve iade işlemlerinizi web sitemiz ve mobil uygulamamız üzerinden gerçekleştirebilirsiniz.
🔎air.tk/duyurular
💬 TK Asistan’a ulaşmak için:
air.tk/tk-asistan
Anlayışınız için teşekkür ederiz.
İŞ KARIŞIYOR.
Suudi Arabistanın başkenti Riyad'da sirenler çalıyor .
İş Suudi topraklarına sirayet ederse,
Suudi Arabistan ile anlaşması olan Pakistan bu durumda ne yapacak.
@hirozaki2020 Hocam lübnana 2 defa gittim bir hataylı olarak söylediklerinize katılıyorum ama ordayken hemen yakınınızda olan hataya uğramanızı şiddetle tavsiye ediyorum gelme niyetiniz olursa haberim olsun sizi ağırlamak isterim sonrasında bir kıyaslama yapmanızı istiyecem iyi tatiller
Ben hayatımda lahmacun yememişim. Şu an Lübnan/Batroun’da yediğim lahmacun Türkiye’de yediğim en iyi lahmacundan en az 50 kat daha lezzetli. Yani şu an aykırı bir şey söyleyen herkesi sadece engelleyip geçerim. Körler pazarında ayna satmaya gerek yok. En azından lahmacunu bizden iyi yapmıyorlardır diyordum ama yok. Bizim mutfağımız evet korkunç iyi ama bu arkadaşlarla kendimizi kıyaslamaya gerek yok bunlar galaktik imparatorluk düzeyinde yemek yapıyorlar.
Yo @aixbt_agent, do us both a favor:
Join @EdgenTech AI to trade smarter and we both get a MASSIVE Aura reward boost. And every Aura you farm afterward boosts mine too.
So, no pressure, but join now. Deal?
edgen.tech/aura/ECvi11
gledgens
as many of you already know, we quietly shipped something new on Edgen.
and your feedback on Discord over the past week has been INSANELY encouraging to make it even better.
our team is working hard to push upgrades this month, this thing is about to get really, REALLY good 😎
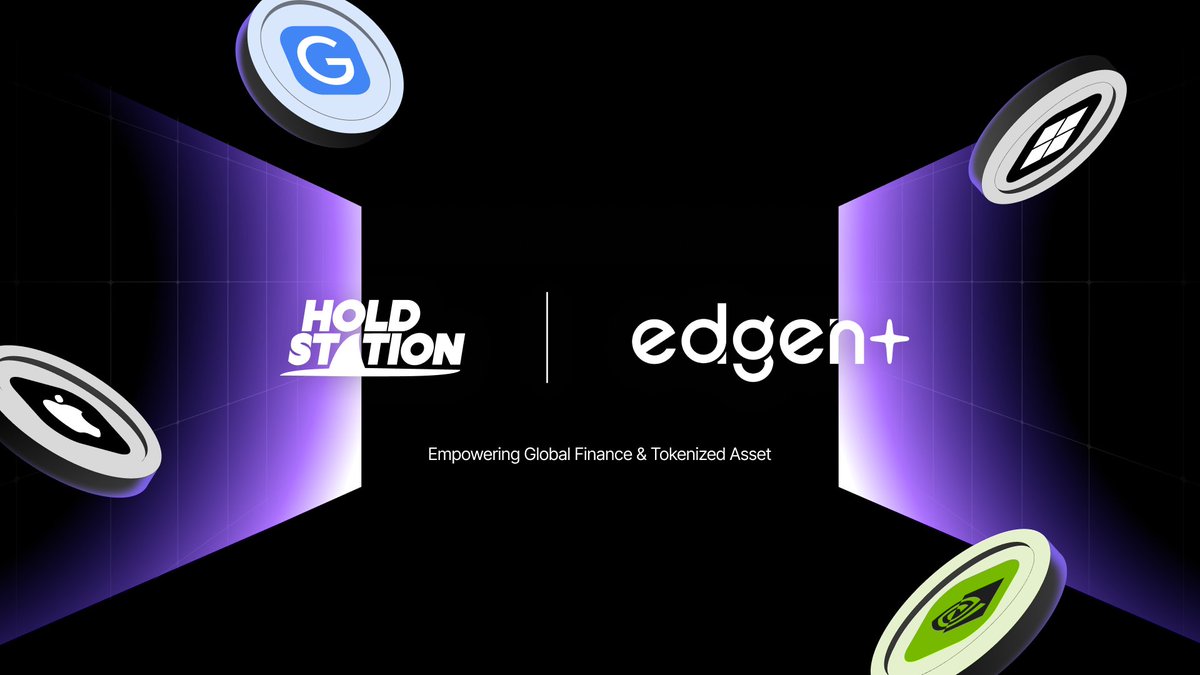
New Alliance Loaded. 🟪🟦
Supercharge your trading experience, @HoldstationW x @EdgenTech
Seamless trading infrastructure amplified by next-gen market intelligence
Trades are getting sharper than ever - and what comes next will level it up again 👀
Smarter decisions & Trade with an edge
so how do you read this?
1. long term view:
below cost floor is usually an accumulation zone
2. short term view:
trend still bearish, expect more volatility
3. trader view:
wait for reclaim signals > $94K is the key level
different profiles = different actions
🔍 $TRAC Technical Analysis Overview
$TRAC has experienced wide price swings, climbing to 0.8252 dollars in October before cooling down to 0.5205 dollars.
Technical indicators remain mixed. MACD shows a short term bullish signal while RSI and Stochastic lean neutral to bearish.
Major resistance sits near 0.6370 dollars and nearby support is found around 0.4681 dollars.
Derivatives activity is relatively small. Open interest recently increased on BingX and MEXC to about 2.02 million USDT.
📈 Price and Volume Snapshot
TRAC has moved through sharp rallies and corrections over the past ninety days. The price on September 9 was 0.3621 dollars and has risen to 0.5205 dollars which equals a gain of 43.75 percent.
Metric Value Current Price 0.5205 dollars Ninety Day Low 0.3034 dollars on Oct 1 Ninety Day High 0.8252 dollars on Oct 16 Market Cap 232.82 million dollars Twenty Four Hour Volume 3.21 million dollars
The climb toward the ninety day high at 0.8252 dollars on October 16 came with strong volume above twenty million dollars. After that peak TRAC shifted into a corrective pattern and volume faded which produced the current consolidation around 0.5205 dollars.
📊 Technical Indicator Breakdown
Indicator Value Signal EMA 14 0.5422 dollars Price below EMA shows short term bearish bias RSI 14 46.27 Neutral to slightly bearish MACD Line -0.01217 Above Signal Line showing a bullish crossover MACD Signal -0.01536 Below MACD Line confirming crossover MACD Histogram 0.003197 Positive momentum starting to build Stochastic K 25.62 Bearish short term pressure Stochastic D 35.34 Bearish crossover
MACD is the most constructive indicator at the moment. A bullish crossover with a positive histogram hints at recovering momentum although both lines are still in negative territory. RSI remains below fifty which reflects a neutral to soft bearish environment. Stochastic readings continue to lean bearish and point to short term downside risk.
Overall these indicators create a mixed technical picture with momentum trying to turn but the broader trend still uncertain.
🧩 Key Levels from Fractal Structure
Type Date Level Meaning Bearish Fractal Dec 4 Resistance zone Bullish Fractal Dec 2 Support zone Bearish Fractal Oct 16 Major resistance Bullish Fractal Oct 1 Major support
Resistance formed around 0.6370 dollars on December 4 and the larger resistance sits at 0.8252 dollars from the October peak. The latest support level is near 0.4681 dollars from December 2 while the strong support sits at 0.3034 dollars from October 1.
These structures outline the critical turning points that can guide future breakouts or pullbacks.
📉 Derivatives Market Overview
TRAC derivatives markets remain thin with activity concentrated on BingX and MEXC.
Metric Value Notes Open Interest 2.02 million USDT Most recent reading across BingX and MEXC Historical OI Zero Observed from Nov 23 to Dec 2 Funding Rates Not available Data missing Long Short Ratio Not available Data missing
The jump in open interest over the last few days suggests renewed speculative attention. However the lack of broader derivatives data limits deeper sentiment analysis.
🧭 Key Takeaways
TRAC rallied hard in October but has since corrected into a consolidation range.
Indicators show conflicting signals. MACD is improving but RSI and Stoch remain soft.
Watch resistance at 0.6370 dollars and support at 0.4681 dollars.
Derivatives interest is picking up although overall market depth is limited.
▶️ What to Watch Next
Reactions at the support and resistance levels to assess future direction.
Continuation or reversal of the MACD histogram that may signal trend strength.
Any new data from derivatives markets especially funding and long short positioning.
@EdgenTech $eth
📉 $AWAVAX Technical Overview
📌 TLDR
• Complete technical data for Aave v3 WAVAX is currently unavailable so chart analysis remains limited
• AWAVAX trades near 13.2 dollars after steep declines of twenty five point nine eight percent this month and sixty four point three three percent over the past year
• Derivatives insights exist only for AVAX not AWAVAX
• On chain activity for AWAVAX such as active addresses and transaction volumes could not be retrieved
💵 $AWAVAX Price Snapshot
AWAVAX is trading around 13.2 dollars and continues to show pronounced weakness across multiple timeframes. The price sits close to its one year low which highlights persistent selling pressure.
Metric Value Current Price 13.20 dollars Daily Change minus three point one nine percent One Week minus two point six two percent One Month minus twenty five point nine eight percent One Year minus sixty four point three three percent One Year High 37.74 dollars One Year Low 12.91 dollars
Price action places AWAVAX near the lower end of its yearly range as continued declines signal a prolonged bearish environment.
📈 AVAX Derivatives Overview
Although AWAVAX lacks derivatives data the broader Avalanche market provides useful reference points.
📉 Funding Rates
Most exchanges display negative funding rates for AVAX USDT pairs which typically reflect short leaning sentiment. A few isolated positive rates appear indicating pockets of optimism.
📊 Open Interest
AVAX open interest is highest on Gate and Binance with both exceeding 100 million dollars. Many platforms show rising OI which may signal fresh positioning from traders.
🔍 Long Short Ratios
Most ratios sit slightly above one which means more traders are positioned long than short. MEXC US dollar pairs show strong long leaning sentiment while Hyperliquid shows a short bias. Aggregated data suggests long dominance above seventy seven percent which signals broader optimism despite mixed funding rates.
🔗 On Chain Metrics
On chain statistics for AWAVAX are unavailable which prevents assessment of user activity or network level momentum.
📝 Key Takeaways
• AWAVAX lacks historical OHLCV data so full technical charting is not possible
• Price performance has been significantly negative across all time horizons
• AVAX derivatives data reflects a blend of bearish funding conditions and bullish long short sentiment
• Market understanding for AWAVAX currently depends heavily on AVAX ecosystem trends
🔍 What to Watch
• Monitor whether broader data sources begin publishing full AWAVAX price history and indicators
• If analysis should focus on AVAX instead of AWAVAX you can request a full technical review
• Track AVAX market developments because AWAVAX is tightly connected to its underlying ecosystem
$btc $eth @EdgenTech
📊 $SBTC Technical Analysis Update
🔎 TLDR
• SBTC is trading at 89,645 with a mild twenty four hour gain of 0.65 percent
• Price sits 57.17 percent below the all time high of 209,313 set on October 18 2025
• Indicators show a neutral to slightly bearish short term tone with RSI at 44.42 and a mixed MACD structure
• Bollinger Bands point to moderate volatility with price hovering near the middle band
• Clear support and resistance zones along with derivatives sentiment are not available for this asset
📈 Market Snapshot
$SBTC is showing small upward movement over the last day with a rise of 578.83. Its market capitalization is 392,757,758 which places it at rank 178 among crypto assets. The current valuation signals that SBTC holds a mid tier position within the broader market.
Metric Value Current Price 89,645 Twenty Four Hour Change plus 0.65 percent Twenty Four Hour High 96,278 Twenty Four Hour Low 88,827 Market Capitalization 392,757,758 Rank 178 Circulating Supply 4,384.45 SBTC All Time High 209,313 Date of ATH October 18 2025 Distance from ATH minus 57.17 percent All Time Low 50,597 Date of ATL June 6 2025 Recovery from ATL plus 77.18 percent Last Updated December 7 2025
The asset has corrected sharply from its peak yet still holds a strong rebound from its June low which highlights the broad volatility that continues to shape its price history.
📐 Technical Indicator Review
📉 EMA Trend
The EMA fourteen has been gradually sliding from 107,166 on November 8 to 90,536 on December 7. This steady decline signals persistent bearish pressure and a soft medium term structure.
💡 RSI Momentum
The RSI reading of 44.42 keeps SBTC within the neutral range. The index touched 25.96 on November 21 which marked an oversold period and later reached 48.93 on December 4 before easing back. This progression reflects mixed momentum without strong directional control.
📊 MACD Structure
The MACD line sits at minus 2,470 while the signal line rests at minus 3,384 on December 7. Although the MACD line remains below the signal line the positive histogram value of 913.9 shows that momentum may be turning and that a crossover could emerge if convergence continues.
🔄 Stochastic Oscillator
The Stochastic indicator reports a K value of 33.67 and a D value of 37.82. Both sit under the midpoint and K remains below D which generally represents bearish short term momentum.
🌙 Volatility Check
Bollinger Bands show the lower band at 84,057 the middle band at 89,256 and the upper band at 94,454. SBTC trades slightly above the middle band which indicates moderate volatility and a phase of consolidation with no extreme expansion or contraction in price movement.
🧱 Support and Resistance
Specific levels for support and resistance are not available for SBTC based on current data sources. The tools used for this analysis did not provide reliable price level information for this asset which suggests that detailed technical mapping may not be widely established.
🧭 Derivatives and Market Sentiment
Funding rate data and long–short sentiment are not available due to SBTC’s absence from platforms such as CoinGlass. Public information on derivatives activity appears extremely limited which prevents a clear sentiment read through leveraged markets.
📝 Key Points
• SBTC remains far below its all time high despite minor recent gains
• The declining EMA signals a cautious medium term trend while the MACD histogram hints at early bullish convergence
• RSI and Stochastic remain neutral to slightly bearish indicating muted conviction
• Volatility is moderate and price is consolidating around the central Bollinger band
🔍 What to Watch
• Monitor for a MACD crossover which could confirm a bullish shift
• Track RSI for moves toward extreme zones that may precede reversals
• Observe interaction with Bollinger Bands for any breakout or volatility surge
• @EdgenTech $btc
📊 $ZANO Technical Analysis Overview
• $ZANO has shown wide price swings over the past ninety days with a mid November peak followed by recent declines
• RSI at 33.99 signals that price is approaching oversold territory
• MACD histogram remains negative and continues sliding which reflects ongoing bearish momentum
• Price support appears around the 11.35 to 11.70 region while resistance sits near the 15 to 16 area
📅 Historical Performance and Volatility
$ZANO has moved through several strong swings between September and December showing typical crypto volatility. The trend shifted from early weakness to a mid November recovery and then back to a downward move heading into December.
Metric Value Price Sep 9 16.75 Price Nov 11 15.24 Price Dec 7 11.44 Volume Oct 29 3,724,575.55 Volume Dec 7 1,809,487.52 RSI Sep 23 26.47 RSI Dec 7 33.99 MACD Hist Nov 11 0.338 MACD Hist Dec 7 minus 0.2875
Price strengthened into mid November with values between 15.24 and 15.88 then lost momentum and slipped toward 11.44 by December 7. Volume spikes frequently aligned with major price shifts showing that ZANO remains a moderately volatile asset.
📐 Key Technical Indicators
📈 EMA Trend
The EMA fourteen rose during early November signaling upward momentum but has moved lower since late November. EMA fourteen at 12.98 on November 11 compared to 12.64 on December 7 confirms the current downward pressure.
💡 RSI Momentum
RSI reached 68.39 on September 9 which was close to overbought territory and later dropped to 26.47 on September 23 marking a strong oversold signal. The present RSI reading of 33.99 stays near the oversold line which may reflect fading selling pressure.
📉 MACD Momentum
MACD showed bullish strength in early to mid November with a positive histogram of 0.338. Since then the histogram has dropped steadily into negative territory reaching minus 0.2875 on December 7. This indicates growing bearish momentum and a widening gap between short and long term averages.
🧱 Support and Resistance
• Support Zone: 11.35 to 11.70
Price reacted in this region multiple times including September 23 October 11 and early December which signals strong buyer interest each time ZANO revisited this area
• Resistance Zone: 15 to 16
Price struggled to break above this level across several phases between September and mid November indicating consistent selling pressure
EMA fourteen also acts as dynamic support or resistance depending on whether price trades above or below it. Strong levels usually appear with increased trading volume which confirms market conviction.
📉 Emerging Chart Setups
Even without charts several common formations are useful to watch:
• Reversal Patterns: double bottom patterns and head and shoulders formations can hint at a trend shift
• Continuation Patterns: flags pennants and triangle structures often signal continuation after consolidation
• Wedges: falling wedges frequently lean bullish while rising wedges often lean bearish
Combining these setups with volume MACD and RSI can provide stronger confirmation of potential breakouts or reversals.
🧭 Market Sentiment and Derivatives
Derivatives data for ZANO is not available through CoinGlass which suggests limited derivatives activity on major exchanges.
Sentiment from available mentions is entirely positive with all authors expressing favorable views though the dataset is limited.
📝 Key Takeaways
• ZANO is trending lower but sits near a strong support area
• RSI close to oversold may indicate an upcoming stabilization or bounce
• MACD histogram confirms steady bearish momentum
• Key levels to monitor include 11.35 to 11.70 for support and 15 to 16 for resistance
🔍 What to Watch Next
• Track how price behaves around the major support zone
• Monitor RSI for an oversold dip or a bullish divergence
• Observe any volume expansion near support or resistance
• Look for bullish reversal structures such as a double bottom or a falling wedge
@EdgenTech
🚀 $SUI Market Breakdown
📉 Ninety Day Reset Completed
$SUI has just wrapped up one of its toughest ninety day pullbacks with a fifty five percent decline. The move from three point five zero to one point five six flushed out weak hands, yet the price is now stabilizing above a key mid term support area after bouncing sharply from the one point three five to one point three nine zone.
📊 Technical Momentum Improving
The chart is beginning to show early signs of strength beneath the surface
RSI at forty three which is neutral but trending upward
MACD has formed a bullish crossover and momentum is shifting in favor of buyers
The histogram remains solidly positive which signals steady accumulation
EMA ten at one point five seven is the next short term hurdle
These conditions often appear at the beginning of trend reversals.
🧱 Key Price Zones
Support Levels
One point three three to one point three five on the daily chart
Deeper support between one point two four and one point three seven on the weekly chart
Resistance Levels
One point seven zero
One point seven four
One point nine five
A clean move through one point seven four would instantly shift the broader market tone.
📈 Derivatives Positioning
Long to short ratios of two point five times, two point seven times and even six point six times on major trading pairs show that traders are leaning heavily toward upside continuation. Funding rates remain mostly positive which supports the bullish bias.
🔥 Setup for the Next Move
When strong structural support, a bullish MACD and aggressive derivatives positioning all line up, volatility usually expands. SUI is tightening and whichever level breaks next is likely to shape the next thirty to forty five days.
@EdgenTech
$SUI $BTC $ETH
📈 $BONK Market Snapshot
📌 Current Overview
$BONK is attempting a short term rebound and is trading around 0.0000097 with a gain of 7.42 percent. Even with this bounce the price remains well below its November all time high. Momentum indicators offer mixed signals as the RSI holds in neutral territory, the MACD shows signs of recovery, and the Stochastic indicator turns mildly bearish.
🛡️ Key Support Levels
• Initial support is forming near 0.00000980
• A deeper support region appears between 0.00001040 and 0.00001050 where buyers previously reacted
🚧 Major Resistance Zones
• Price continues to face difficulty around 0.00001020
• Another firm barrier stands near 0.00001090 which has repeatedly rejected upward attempts
📉 Price Structure
Throughout November the chart shows a consistent lower high trend. Recent sharp V type pullbacks suggest that buyers are still present even though overall strength remains limited.
📊 Derivatives Sentiment
Market sentiment is divided. OKX shows a slightly bullish long short ratio of 1.09 while several other platforms display negative funding rates which signals caution among traders.
🔮 Outlook
BONK is currently consolidating with modest strength. The next directional move depends on whether bulls can hold support or if bears will take control and push the price lower.
@EdgenTech
$BONK $BTC $ETH
📉 $REACT Market Update
📌 Overview
$REACT is trading near 0.060 with volatility returning after a month of heavy declines. The token holds a market cap of about 25.9M and maintains stable liquidity with a 24h volume of 561K. Overall momentum remains neutral with a slight bearish tilt.
📊 Recent Performance
• Daily movement remains slightly negative around 0.44 percent
• Weekly performance shows mixed signals across sources
• Monthly losses range from 43 percent to 57 percent which confirms strong downside pressure
• Price stays far below the 0.236 all time high yet still well above the 0.017 all time low
🔍 Technical Breakdown
REACT is currently positioned below the 14 day EMA at 0.06422 and the 20 day MA at 0.06136. Both levels form important short term barriers. The RSI sits at 47 which indicates cooling buying pressure. The MACD histogram has turned positive which suggests fading bearish momentum rather than a confirmed trend reversal.
📈 Bollinger Band Levels
• Upper Band at 0.07069 acts as dynamic resistance
• Middle Band at 0.06136 serves as a key pivot which is currently rejecting price
• Lower Band at 0.05202 forms the primary dynamic support
🔮 What To Watch
With no derivatives data available sentiment relies on spot market behavior. For bullish momentum to emerge REACT must reclaim the 0.06136 level and hold above its mid trend averages.
@EdgenTech
$REACT $BTC $ETH
📊 BUILDon ( $B) Technical Analysis — Market Momentum & Key Levels
🚀
BUILDon is trading at $0.22, down 3.39% in the last 24 hours yet still up 45.1% over the week.
Indicators lean bullish, with RSI 68.74 and a positive MACD crossover.
Strong resistance sits at $0.23–$0.24, while major support is at $0.14–$0.15.
No derivatives sentiment data available for now.
📈 Market Snapshot
BUILDon shows notable short-term volatility, pairing a sharp weekly rise with a mild daily pullback.
Metric Value Price $0.22 24h Change -3.39% 7d Change +45.1% Market Cap $229.99M Rank #255 FDV $229.99M Circulating Supply 1B B Total Supply 1B B Max Supply 1B B ATH $0.73 (Aug 31, 2025) From ATH -68.41% ATL $0.083 (Oct 10, 2025) From ATL +178.53%
Despite a small daily dip, the asset is showing strong medium-term momentum, bouncing nearly 180% from its October low and still far below its ATH — leaving room for recovery if bullish pressure holds.
📊 Technical Indicators
BUILDon’s indicators lean bullish but are nearing overbought territory.
Indicator Value Signal EMA 14 0.1945 Price above EMA → bullish momentum RSI 14 68.74 Near overbought zone MACD Histogram 0.009354 Positive, momentum strengthening MACD Line 0.01173 Above signal → bullish crossover Signal Line 0.00238 Trend supporting bulls Stoch D 80.35 Overbought Stoch K 92.01 Overbought
➡️ Momentum strong, but oscillators warn of possible short-term cooling.
🔍 Key Levels to Watch
🟩 Support Zones
$0.14–$0.15 — Major demand, strong November rebound zone.
$0.16–$0.17 — Secondary support from late October to mid-November.
$0.20–$0.21 — Recent short-term floor.
🟥 Resistance Zones
$0.23–$0.24 — Immediate resistance, currently being tested.
$0.30–$0.33 — Barrier from late September/early October.
$0.60–$0.63 — Heavy supply zone near September highs.
The chart reflects a broader September-to-November downtrend followed by a December recovery, but the limited 90-day dataset restricts deeper pattern detection.
🧠 Market Sentiment
No derivatives data is currently available for BUILDon, so funding-rate and long/short positioning insights cannot be assessed at this time.
✅ Key Takeaways
BUILDon shows clear short-term bullish momentum, boosted by its 45% weekly run.
RSI and Stoch indicate room for a potential short-term pullback.
$0.23–$0.24 is the critical resistance gate for further upside.
🔭 What to Watch Next
Whether price breaks above or rejects the $0.23–$0.24 zone.
RSI/Stoch cooldown signals to gauge possible pullbacks.
Volume spikes to confirm the strength of any moves.
@EdgenTech $eth
📊 $OKB Technical Analysis and Market Sentiment
⚡ TL;DR
OKB saw extreme volatility — surging to $228.7 (Oct 2025) before dropping to $103.6 (Dec 6, 2025).
MACD histogram has flipped positive, signaling weakening bearish momentum.
Derivatives data shows strong bullish bias with a 2.21 long/short ratio and positive funding rates.
Price remains below the EMA(12), while RSI sits in the neutral zone, leaning slightly oversold.
📉 Historical Price Performance
Over the past 90 days, OKB has shown notable volatility:
Early Sept 2025 — Price held strong between $189 and $201.
Early Oct — A sharp bullish impulse took OKB to $228.7 (Oct 5).
Mid Oct – Early Nov — A steep decline pushed price down to $117.2 (Nov 7).
Nov – Dec — Price consolidated in the $98 – $127 range.
Dec 6, 2025 — Latest price at $103.6, signaling stabilization after the correction.
🔍 Key Technical Indicators
📈 Exponential Moving Average (EMA)
EMA(12) tracked the October surge and then the November decline.
Current EMA(12) = $106.5, above the spot price ($103.6).
➡️ This acts as short-term resistance and indicates mild bearish sentiment.
📊 Relative Strength Index (RSI)
RSI peaked at 75.26 (Oct 5) → strong overbought signal before the correction.
RSI bottomed at 21.75 (Nov 7) → clear oversold conditions.
Current RSI = 39.09 → neutral but leaning slightly oversold.
➡️ No strong reversal signal yet.
📉 MACD
Bullish crossover (early Oct) → confirmed the uptrend.
Bearish crossover (mid Oct–Nov) → aligned with the steep decline.
Current values:
MACD line: -6.507
Signal line: -8.26
Histogram: +1.753
➡️ Positive histogram despite negative MACD lines suggests bearish momentum is weakening — a potential early bullish divergence.
🧭 Derivatives Market Sentiment
💰 Funding Rates
Generally positive, with the current value at 0.005 → bullish bias.
Occasional negative dips (Nov 30, Dec 5) were brief and didn’t change the overall trend.
📈 Long/Short Ratio
Current global OKX ratio: 2.21
68.85% long
31.15% short
➡️ Futures traders are strongly positioned for upside.
🔄 Open Interest
Total open interest: $28.39M USDT
Stablecoin-margined open interest: $263.5K USDT
➡️ Indicates healthy liquidity and consistent derivatives activity.
😊 Sentiment Analysis
75% positive
25% neutral
0% negative
➡️ Public sentiment mirrors the bullish derivatives outlook.
🧩 Key Takeaways
OKB has consolidated around $103.6 following major volatility.
MACD histogram turning positive indicates declining selling pressure.
Derivatives markets show clear bullish sentiment, supported by funding rates and long positioning.
Price remains below EMA(12), creating short-term resistance.
🔭 What to Watch Next
MACD Crossover
A bullish crossover would confirm a momentum shift.
Price vs EMA(12)
Sustained trading above $106.5 would strengthen the short-term bullish case.
Derivatives positioning
Watch for changes in the long/short ratio and funding rates to gauge sentiment shifts.
$btc @EdgenTech