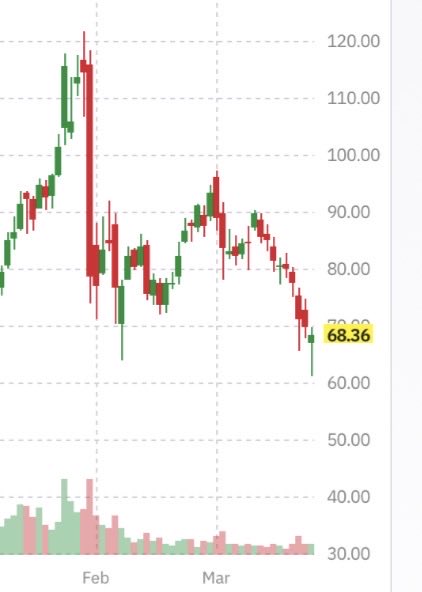
A 16% correction from the 61.21 low suggests the bear cycle has likely run its course. This action does not confirm a bear market. Instead, it points to the possibility that a new bullish cycle is beginning. If this interpretation is correct, the market may now be setting up for a move back above 100, with the potential to retest the prior highs near 120. From a cyclical and mean-reversion perspective, the recent decline appears more consistent with the completion of a corrective phase than the start of a prolonged bearish trend.
@brian95123@garysavage1 A 50% Dip is not a collapse. It's a perfect Fibonacci correction in a longterm bull market. It's where you add to your longterm position. it's the foundation for a larger expansion into new highs.
@garysavage1 50% is not a dip. It’s a collapse.
It does look promising for a ST bottom, but the long term technical damage to all PM’s and mining stocks is overwhelming.
Lower lows and lower highs.
There's a pretty good chance this mornings undercut will turn out to be the bottom in metals and stocks and the top in oil.
In a bull market you need to buy dips. But how many people can actually do that? Not many.
People buy into narratives at tops and bottoms. At the top there is always a narrative for why price can't go down. We saw it back in January as people argued with me that the "fundamentals" were to strong and metals were only going higher. I did an interview on Commodity Culture and suggested that there would be a crash after the parabolic rise. The comments were insane as people lost their mind at the thought there was any way metals could drop. (cult like behavior).
That has completely reversed. Now the narrative is that the war will somehow prevent metals from ever rising again. I've got news for you. The "fundamentals" haven't changed. All that happened was metals had an intermediate degree correction. Sentiment got too bullish, smart money started to take profits (exacerbated by a successful attack on silver by the banking cartel) and down we went. A profit taking event. Not a change in fundamentals. Just a profit taking event after a long and very powerful rally.
Sentiment has now been cleared, people are bearish and buying into the narrative. We now have the fuel for the next leg up in the bull market. This leg will see gold over $6000 and maybe as high as $7000 before the next profit taking event.
I also think this correction has knocked metals back into the wall of worry phase, and that's a good thing as it extends the life of the bull by at least several years.
If you are one of those people able to ignore the narrative now is the time to start buying. If you are already long you need to hold onto your position. The next leg up should begin soon and may be ready to begin today.
The SMT will be open for new subscriptions till the end of April. Don't let 2 months of rally go by and then decide to FOMO in. The time to buy is when you are nervous or scared. Not when you are happy, greedy and buying into the next narrative that price can only go up.
smartmoneytrackerpremium.com
The fact that VC PMI remains consistent during chaos is the strongest validation of the model.
“When price disconnects from value, the math doesn’t break—the opportunity expands.”
CLASSIC BEAR TRAP
Hedge funds went short into maximum fear, exactly when the market is setting up to punish the late sellers. When sentiment reaches this kind of extreme, a reversal can become explosive as shorts get trapped and forced to cover.
The VC PMI integrates price, time, and probability to identify high-probability mean reversion zones. In gold futures, current structure shows Buy 1 at $4409 and Buy 2 at $4315, with the mean at $4573 and upside targets at $4669 (Sell 1) and $4888 (Sell 2). Time cycles indicate a key inflection window between March 20–23, marking potential exhaustion of the decline, with the next cycle pivot projected into March 27–30. The Square of 9 aligns resistance near $4700–$4800 and higher harmonic expansion toward $5000. When price and time converge at these levels, it signals a high-probability reversal zone within the VC PMI framework.
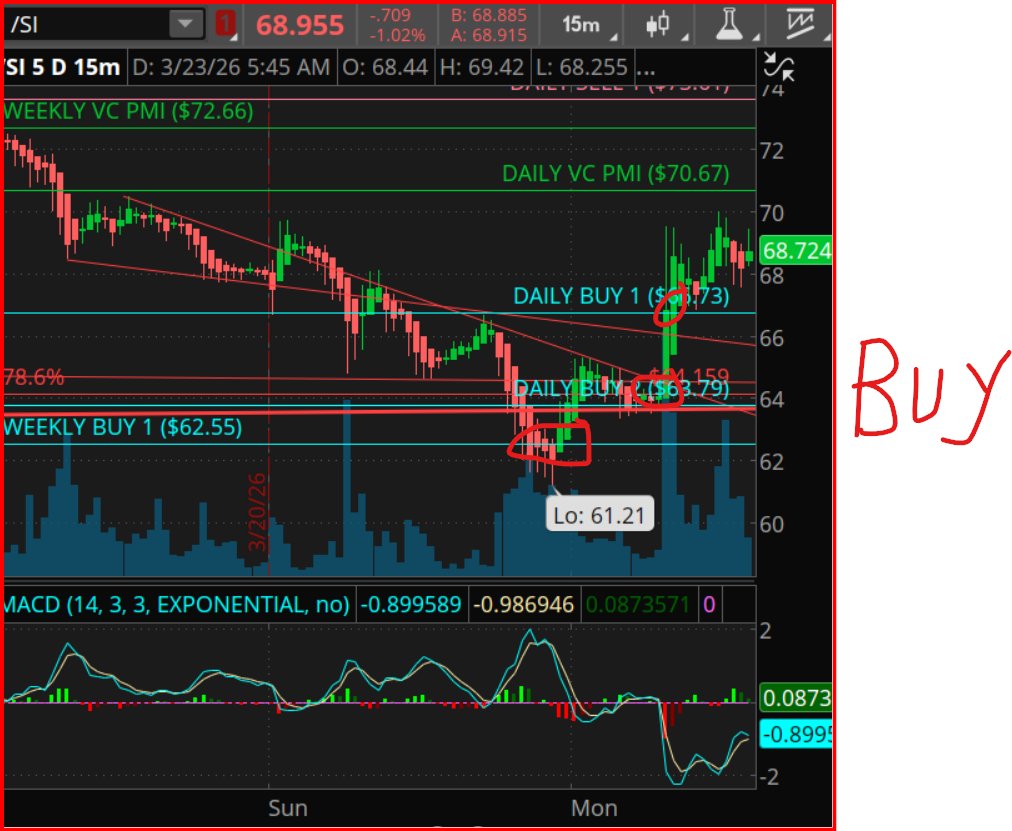
The current silver structure reflects a classic VC PMI mean-reversion setup, where price has reacted precisely from the Weekly Buy 1 at $62.55 and reversed into the Daily Buy 1 zone at $66.73, confirming a high-probability pivot. The low at $61.21 aligns with a Square of 9 harmonic support, indicating completion of a downside cycle. Time-cycle analysis suggests a 3–5 day reversal window from the March 23 low, projecting upward momentum toward the Daily Mean at $70.67 and Weekly Mean at $72.66. A sustained close above $68.80 activates
THERE'S MORE PANIC NOW THAN THE LAST TIME WE MADE THHE LOW OF 63.90 BACK IN EARLY FEB
Current market conditions show greater panic than the prior $63.90 low, yet price is holding above that level, creating a bullish sentiment–price divergence. This indicates that despite intensified fear and emotional selling, the market is no longer responding with significantly lower prices, suggesting seller exhaustion. Within the VC PMI framework, this behavior aligns with a late-stage capitulation phase, where weak hands exit and stronger hands begin accumulating. Historically, such conditions precede trend reversals and momentum shifts. The combination of elevated bearish sentiment and price stability increases the probability that the market is forming a higher low, signaling an approaching recovery phase.
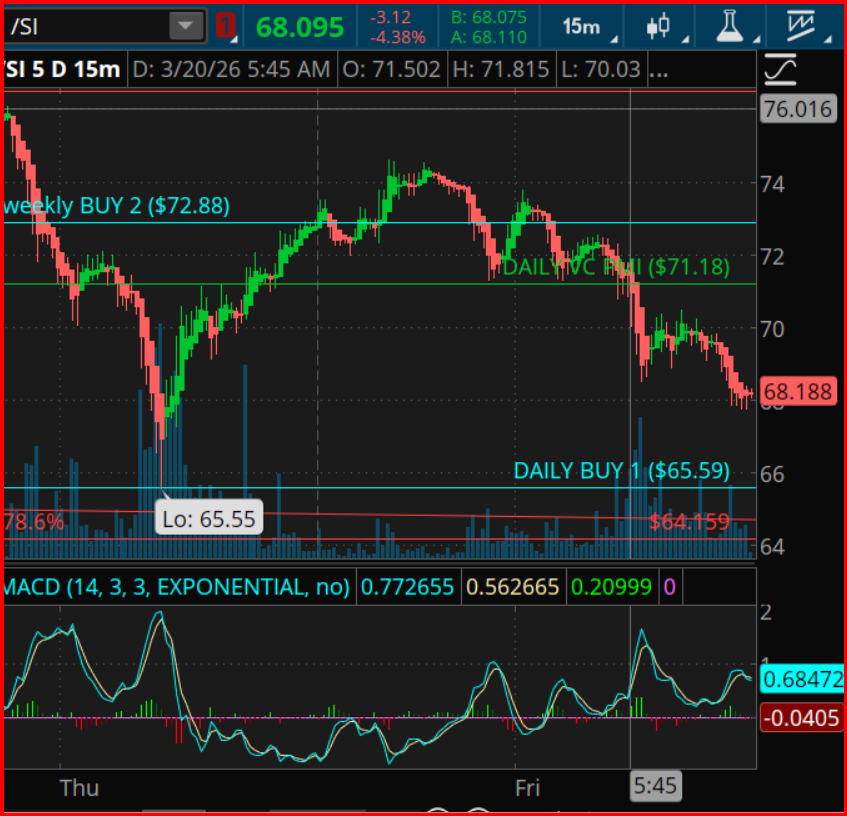
The chart shows a two-phase decline: initial selling with high volume (liquidation) followed by continued downside on declining volume, indicating weakening bearish pressure. This transition reflects seller exhaustion, not aggressive continuation. Within the VC PMI framework, this behavior suggests the market is entering a late-stage correction and early accumulation phase, as stronger hands begin absorbing supply. However, full confirmation requires either high-volume stabilization (absorption) or a volume-backed upside move. Key levels remain $71.18 for momentum shift and $65.59 as extreme value support. Overall, the structure signals a developing bottom, with downside risk diminishing and reversal probability increasing.
Gold and silver are declining today primarily due to U.S. dollar strength and rising Treasury yields, which reduce the appeal of non-yielding assets. The recent surge in crude oil prices tied to geopolitical tensions is fueling inflation expectations, delaying anticipated Federal Reserve rate cuts. This shift is pressuring metals short term despite longer-term bullish fundamentals. From a VC PMI perspective, prices are moving toward extreme levels below the mean, activating high-probability mean reversion zones. This decline reflects liquidation and repositioning rather than structural weakness.