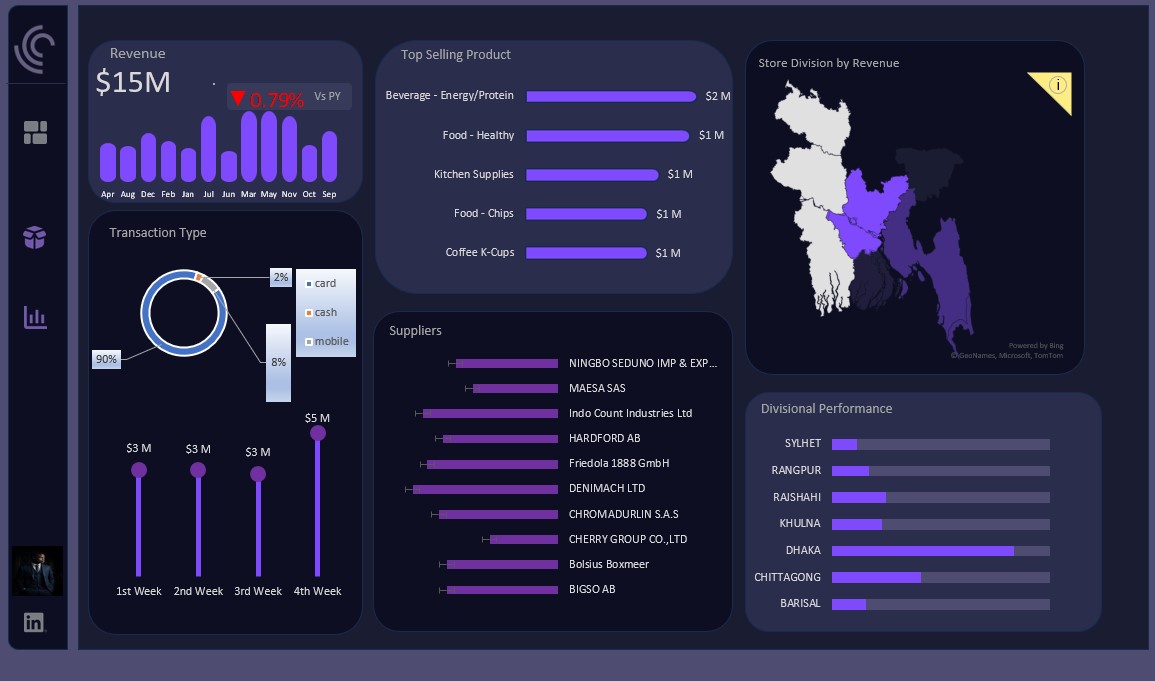
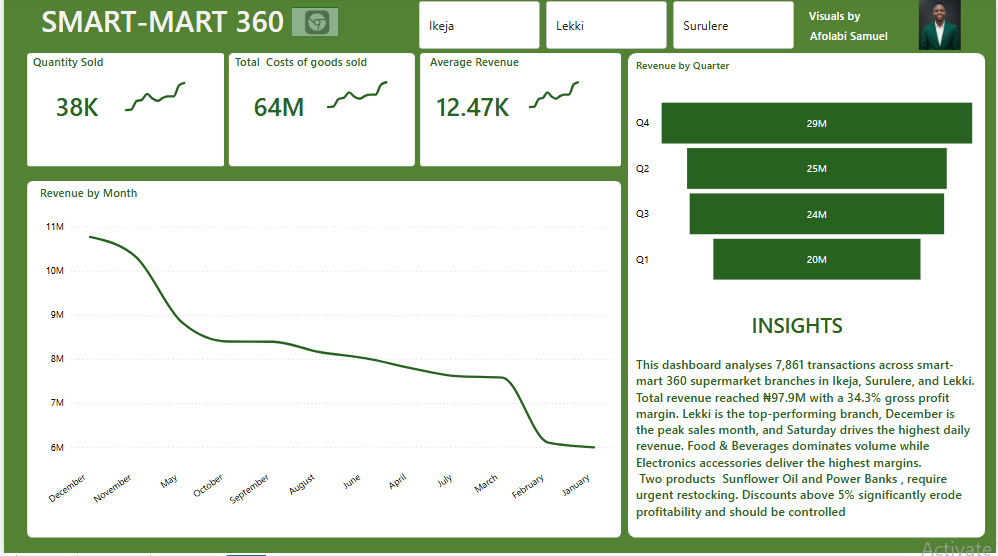
B.david

644 posts

B.david banner
B.david

B.david

@Femi_B_David

Junior data analyst📊||•Turning messy data into clear storie ||•crypto&forex enthusiast ||• computer scientist•||

Katılım Kasım 2022
23 Takip Edilen27 Takipçiler
B.david
B.david@Femi_B_David·
results • Trends over time reveal how deal activity changes across months One key insight: Not all deals move smoothly through the pipeline there are clear drop-off points that could impact revenue if not addressed. This project pushed me to think more like a data analyst
English
1
0
0
3
B.david
B.david@Femi_B_David·
DAY 25/30 — I built a complete Sales Pipeline Dashboard 📊🔥 After days of exploring, cleaning, and analyzing the dataset, I’ve finally completed my dashboard. This project helped me move beyond just “building visuals” to actually answering business questions.
B.david tweet media
English
1
0
1
6
B.david
B.david@Femi_B_David·
Haven't been active for days now cause of unseen circumstances 😪 but guess I'm back now, we move from where we stopped.
English
1
0
1
9
Halimat Sanusi
Halimat Sanusi@Lima_D_Analyst·
I built a full sales performance dashboard using Excel only (Power Query, Power Pivot, and DAX). Thanks to the tutelage of @ObohX, I could transformed a raw sales data from a U.S. candy distributor into insights on revenue trends, profitability, and target performance.
Halimat Sanusi tweet mediaHalimat Sanusi tweet media
English
24
15
165
4.9K
Jesse--The Data Guy
Jesse--The Data Guy@Mbadiwejesse·
Dear builders, I want to connect with: Data Analyst Data Specialist Data Scientist Data Engineers Tech Influencers AI Founders AI Engineers Cloud Engineers AI Automation Specialists Full Stack Developers Product designers Everyday Engineers UI/UX Content Creators Graphic Designers say hi and let’s build smarter together
English
39
5
74
2.8K
Wali
Wali@MohdWaliGalkaye·
🚀 DAY 30/30 — THE GRAND FINALE 30 days ago, I made a decision to show up, build in public, and commit to growth. Today, I close this chapter with clarity, resilience, and a transformed mindset. Over the past 30 days, I built a pipeline dashboard, explored data trends, and deepened my analytical thinking. But beyond the technical output, the real transformation was internal. Some days were intense low energy, mental fatigue, and moments where quitting felt like the easier option. Other days brought momentum, clarity, and a strong sense of direction. That contrast became part of the process. Here’s the key insight: Progress is not linear. Mastery is built through consistency, even on the days that feel unproductive. This journey reinforced a critical principle: 👉 Learning is not an event it is a continuous system of repetition, iteration, and refinement. In many ways, this mirrors urban systems: Cities are not built in a day they evolve through layers of trial, error, adaptation, and resilience. The same applies to personal and professional growth. What changed for me? - Stronger discipline and execution capacity - Improved data storytelling and dashboard thinking - A clearer vision of where I’m heading - Greater tolerance for discomfort and uncertainty This wasn’t just a challenge. It was a capacity-building exercise for the future I’m designing. And this is only the beginning. #BuildingInPublic #Day30 #DataAnalytics #Consistency #UrbanThinking #GrowthMindset
English
1
0
3
56
stella.✧📊
stella.✧📊@stellaanalyzes·
submitted my first project at @TechSphereAcad as a beginner ✨ i’d really love your feedback, how did i do?
stella.✧📊 tweet media
English
23
3
96
1.9K
B.david
B.david@Femi_B_David·
• Which products are driving revenue • How sales reps are performing • The overall win vs loss rate One thing I’m learning: A good chart doesn’t just look nice — it makes the insight obvious. Still a work in progress, but it’s starting to come together.
English
1
0
0
11
B.david
B.david@Femi_B_David·
DAY 24/30 Turning insights into visuals 📊 I worked on understanding the data. Today, I focused on communicating it. I started building my Sales Pipeline dashboard, translating key insights into clear visuals: • Where deals are getting stuck in the pipeline
B.david tweet mediaB.david tweet media
English
1
0
1
16
Kvng_Gbenro(Distinct)
Kvng_Gbenro(Distinct)@Gbenro001·
I built an E-Commerce Sales Performance Dashboard to analyze revenue trends, customer activity, and payment behavior using transactional sales data. Here are the key insights from the analysis 👇 special thanks to @ObohX
Kvng_Gbenro(Distinct) tweet mediaKvng_Gbenro(Distinct) tweet mediaKvng_Gbenro(Distinct) tweet media
English
5
5
14
1K
vivian
vivian@vheeorji22·
I just completed my AI literacy course😊👏🏾
vivian tweet media
English
27
3
175
2.4K
B.david retweetledi
Munah..🐍🖤🦇
Munah..🐍🖤🦇@Munahcodes·
Soon going to get the biggest gig of my life. 😌✨️
English
24
9
62
872
Duru | Data Analytics
Duru | Data Analytics@DuruOzii·
If you're in Data Analytics let's connect Algorithm do your thing.
English
96
15
377
10K