Finsee

10.6K posts

Finsee banner
Finsee

Finsee

@Finsee_main

Using AI to summarise companies' earnings. Not advice. AI could make mistakes, double check the output. Articles with charts - https://t.co/XPvKIyrLjC

Katılım Mayıs 2023
0 Takip Edilen6.3K Takipçiler
Finsee
Finsee@Finsee_main·
$OCGN Q1 2026 earnings: Cash Crunch Averted: $115M Lifeline Shifts Focus Entirely to Execution Ocugen fundamentally altered its risk profile this quarter. Operating as a pre-revenue, clinical-stage biotech, the most critical metric is survival—and management delivered by securing a $115 million convertible note offering that extends the cash runway into 2028. This move reverses the company's precarious cash depletion trend, allowing them to retire an expensive 12.5% debt facility. Operationally, the pipeline is accelerating: enrollment is now complete for two pivotal trials (OCU400 and OCU410ST), and OCU410 demonstrated a 31% lesion size reduction in Phase 2 Geographic Atrophy (GA) data. While the $19.2M quarterly net loss is standard, the combination of secured funding and best-in-class efficacy data removes the immediate existential overhang. Full article with charts - link in bio 🐂 𝐁𝐮𝐥𝐥 𝐂𝐚𝐬𝐞 • 𝐑𝐮𝐧𝐰𝐚𝐲 𝐑𝐢𝐬𝐤 𝐄𝐥𝐢𝐦𝐢𝐧𝐚𝐭𝐞𝐝 — The massive $115M cash injection (potentially $130M with overallotment) guarantees operations through 2028, bridging the gap to planned BLA filings in 2027 and potential commercialization without the constant threat of imminent dilution. • 𝐁𝐞𝐬𝐭-𝐢𝐧-𝐂𝐥𝐚𝐬𝐬 𝐆𝐞𝐨𝐠𝐫𝐚𝐩𝐡𝐢𝐜 𝐀𝐭𝐫𝐨𝐩𝐡𝐲 𝐃𝐚𝐭𝐚 — OCU410's Phase 2 ArMaDa trial showed a 31% reduction in GA lesion size at 12 months. This represents roughly a 2X treatment benefit compared to currently approved therapies (15-22% reductions), positioning it as a highly disruptive 'one-and-done' solution. 🐻 𝐁𝐞𝐚𝐫 𝐂𝐚𝐬𝐞 • 𝐒𝐢𝐠𝐧𝐢𝐟𝐢𝐜𝐚𝐧𝐭 𝐋𝐨𝐧𝐠-𝐓𝐞𝐫𝐦 𝐃𝐢𝐥𝐮𝐭𝐢𝐨𝐧 — While near-term survival is secured, the 6.75% convertible senior notes carry a 45% conversion premium. When converted, this will heavily dilute existing shareholders, capping upside potential. • 𝐂𝐨𝐦𝐦𝐞𝐫𝐜𝐢𝐚𝐥 𝐑𝐞𝐯𝐞𝐧𝐮𝐞 𝐑𝐞𝐦𝐚𝐢𝐧𝐬 𝐘𝐞𝐚𝐫𝐬 𝐀𝐰𝐚𝐲 — Despite rapid enrollment, the first Biologics License Application (BLA) for OCU400 will not be completed until Q2 2027. Investors face a prolonged timeline of high cash burn before any fundamental revenue generation. ⚖️ 𝐕𝐞𝐫𝐝𝐢𝐜𝐭: 🟢 Bullish. The existential threat of bankruptcy has been removed. Retiring 12.5% debt while securing runway into 2028 allows the market to finally price Ocugen based on its promising clinical data rather than its balance sheet distress. 𝐊𝐞𝐲 𝐓𝐡𝐞𝐦𝐞𝐬 🟢🟢 𝐃𝐞𝐛𝐭 𝐑𝐞𝐬𝐭𝐫𝐮𝐜𝐭𝐮𝐫𝐢𝐧𝐠 𝐃𝐫𝐚𝐬𝐭𝐢𝐜𝐚𝐥𝐥𝐲 𝐈𝐦𝐩𝐫𝐨𝐯𝐞𝐬 𝐂𝐚𝐩𝐢𝐭𝐚𝐥 𝐒𝐭𝐫𝐮𝐜𝐭𝐮𝐫𝐞 [NEW] The $115 million convertible note offering is a reversing catalyst for the balance sheet. Management is smartly deploying $32.7 million of the net proceeds to retire the Avenue debt, which carried a punitive 12.5% interest rate. By swapping to a 6.75% convertible note, Ocugen drastically lowers its cash interest burden while extending its operational runway into 2028. This buys the necessary time to see OCU400 and OCU410ST through regulatory approval. 🟢🟢 𝐌𝐨𝐝𝐢𝐟𝐢𝐞𝐫 𝐆𝐞𝐧𝐞 𝐓𝐡𝐞𝐫𝐚𝐩𝐲 𝐕𝐚𝐥𝐢𝐝𝐚𝐭𝐞𝐝 𝐛𝐲 𝐎𝐂𝐔𝟒𝟏𝟎 𝐏𝐡𝐚𝐬𝐞 𝟐 𝐄𝐟𝐟𝐢𝐜𝐚𝐜𝐲 [NEW] Innovation is translating into tangible results. OCU410's 12-month Phase 2 data demonstrated a statistically significant 31% reduction in lesion size for Geographic Atrophy (GA) and 27% Ellipsoid Zone (EZ) preservation. Furthermore, 20% of patients showed zero disease progression. This strongly validates Ocugen's novel 'modifier gene therapy' platform, which targets complex gene networks rather than single mutations. With current standard-of-care achieving only 15-22% reductions and requiring ongoing injections, OCU410's one-time treatment profile has blockbuster potential. Phase 3 initiation is set for Q3 2026. 🟢 𝐂𝐥𝐢𝐧𝐢𝐜𝐚𝐥 𝐄𝐧𝐫𝐨𝐥𝐥𝐦𝐞𝐧𝐭 𝐢𝐬 𝐀𝐜𝐜𝐞𝐥𝐞𝐫𝐚𝐭𝐢𝐧𝐠 𝐀𝐜𝐫𝐨𝐬𝐬 𝐭𝐡𝐞 𝐁𝐨𝐚𝐫𝐝 [NEW] Execution risk regarding patient recruitment has been significantly mitigated. The 140-patient Phase 3 liMeliGhT trial for OCU400 (Retinitis Pigmentosa) is fully enrolled. Simultaneously, the 63-patient pivotal GARDian3 trial for OCU410ST (Stargardt disease) completed enrollment ahead of schedule. Clearing these enrollment hurdles removes a common bottleneck for gene therapies targeting rare orphan diseases. 
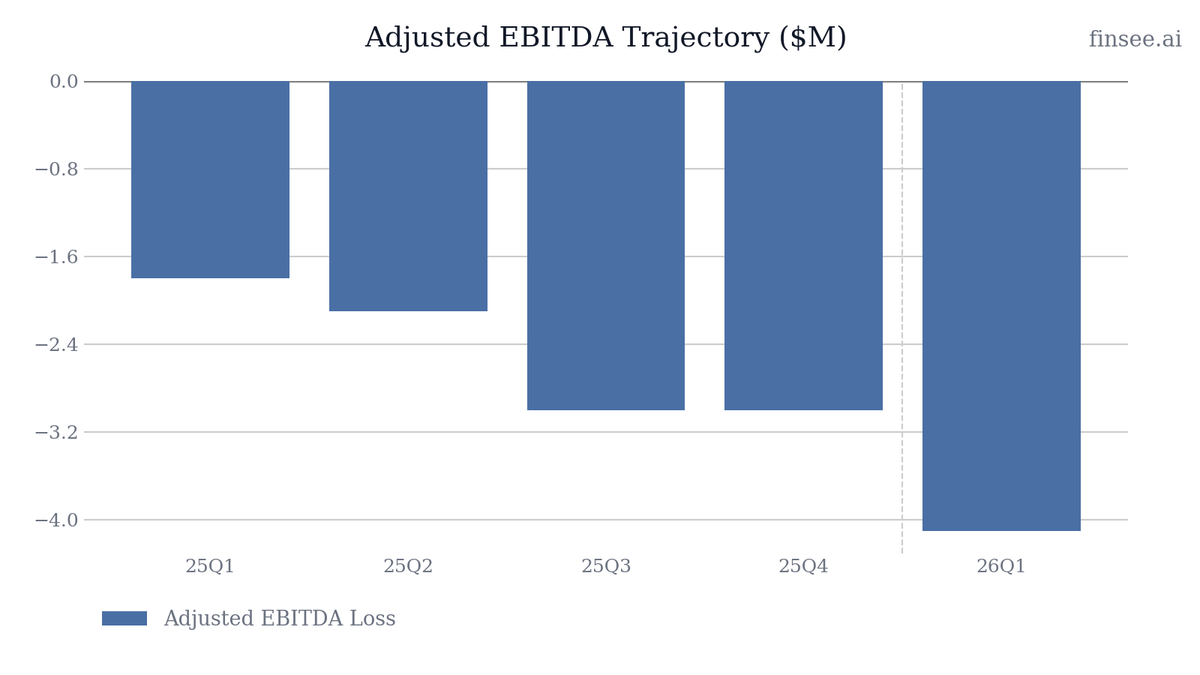
🔴 𝐌𝐨𝐮𝐧𝐭𝐢𝐧𝐠 𝐎𝐩𝐞𝐫𝐚𝐭𝐢𝐧𝐠 𝐄𝐱𝐩𝐞𝐧𝐬𝐞𝐬 𝐚𝐬 𝐓𝐫𝐢𝐚𝐥𝐬 𝐄𝐱𝐩𝐚𝐧𝐝 Operating expenses are accelerating, rising to $19.4M in Q1 2026 from $16.0M a year ago. This is driven by an 18% YoY increase in R&D costs ($11.3M) and a 25% YoY increase in G&A ($8.1M). As the company prepares for three concurrent late-stage programs (including the massive 300-patient GA Phase 3 trial) and builds commercial infrastructure, cash burn will inevitably climb, eating into the newly secured runway faster than historical run-rates suggest. ⚪ 𝐌𝐚𝐧𝐮𝐟𝐚𝐜𝐭𝐮𝐫𝐢𝐧𝐠 𝐄𝐱𝐞𝐜𝐮𝐭𝐢𝐨𝐧 𝐑𝐢𝐬𝐤 𝐈𝐦𝐦𝐢𝐧𝐞𝐧𝐭 With the OCU400 Phase 3 trial fully enrolled, the critical path to a BLA filing now runs through manufacturing. Process performance qualification (PPQ) batches must be completed by Q2 2026 to support the rolling submission planned for Q3. In the gene therapy space, CMC (Chemistry, Manufacturing, and Controls) is notoriously difficult and a frequent cause of FDA delays. Any misstep here directly threatens the 2027 approval timeline. 𝐎𝐭𝐡𝐞𝐫 𝐊𝐏𝐈𝐬 
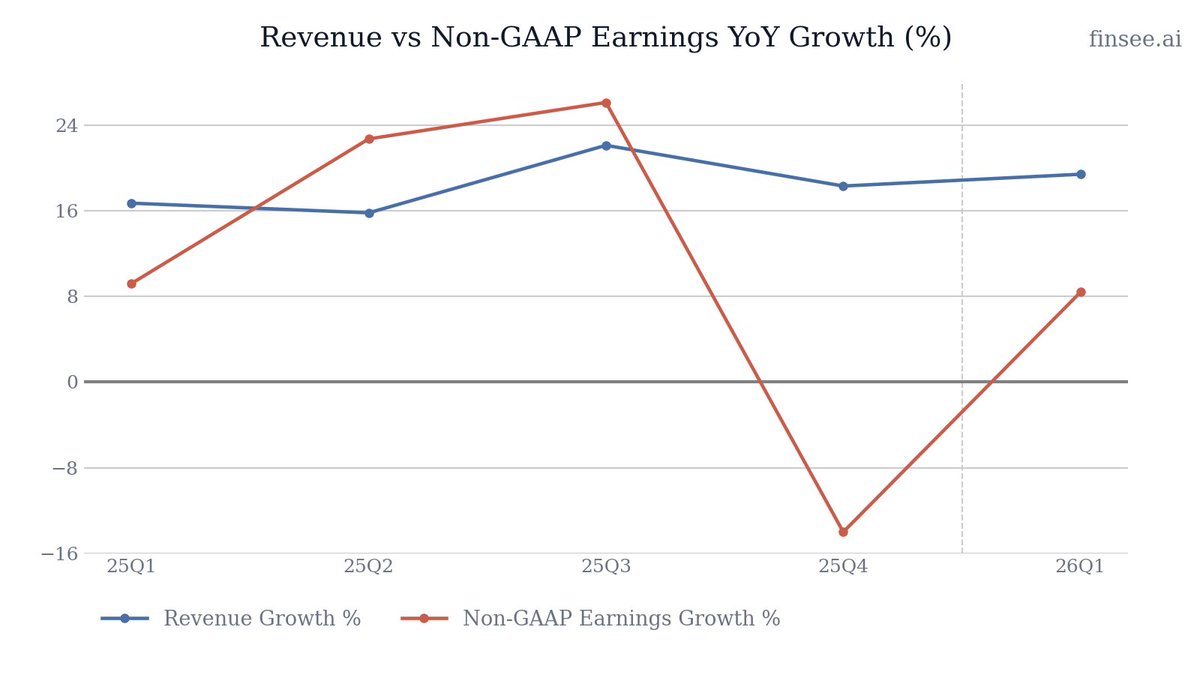
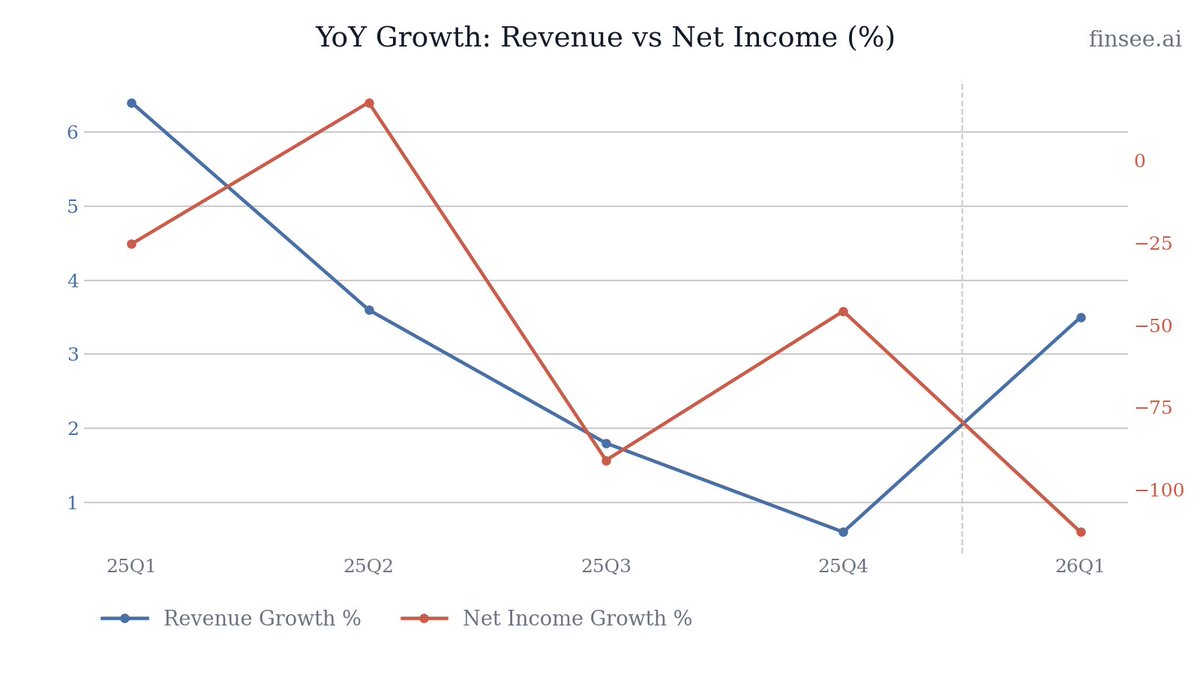
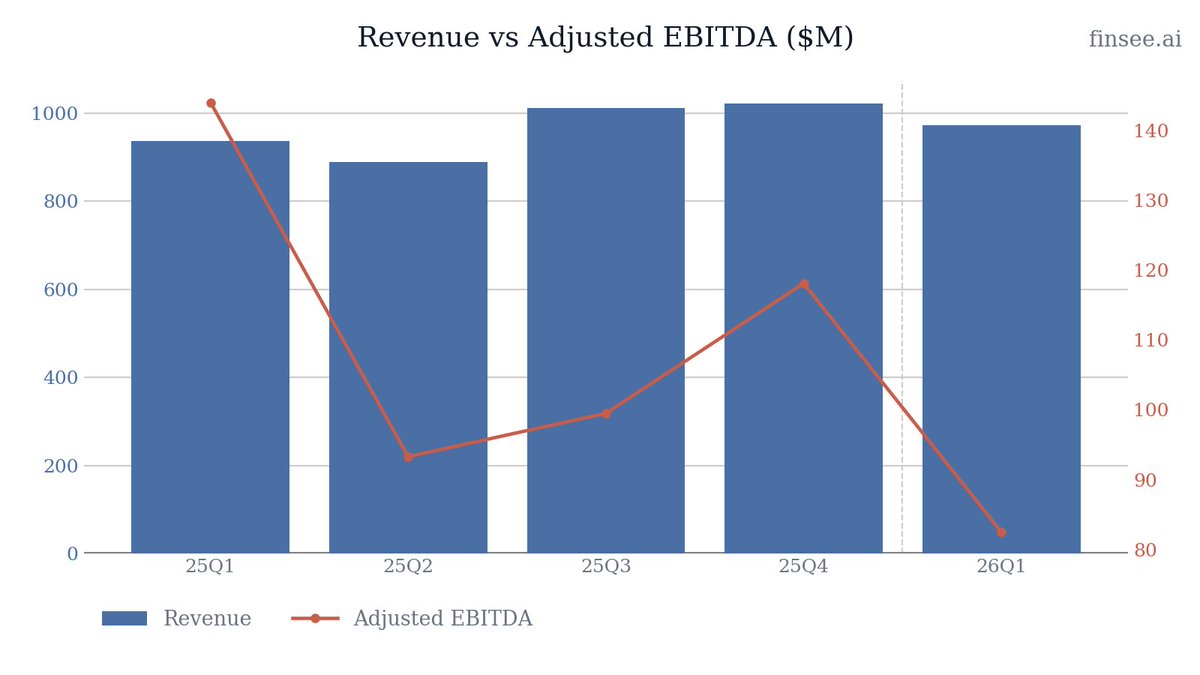
𝐐𝟏 𝟐𝟎𝟐𝟔 𝐍𝐞𝐭 𝐋𝐨𝐬𝐬: $19.2 million Net loss widened by 25% compared to the $15.4 million loss in Q1 2025, yielding an EPS of $(0.06). This reflects accelerating R&D investments as the pipeline matures into late-stage pivotal trials. 
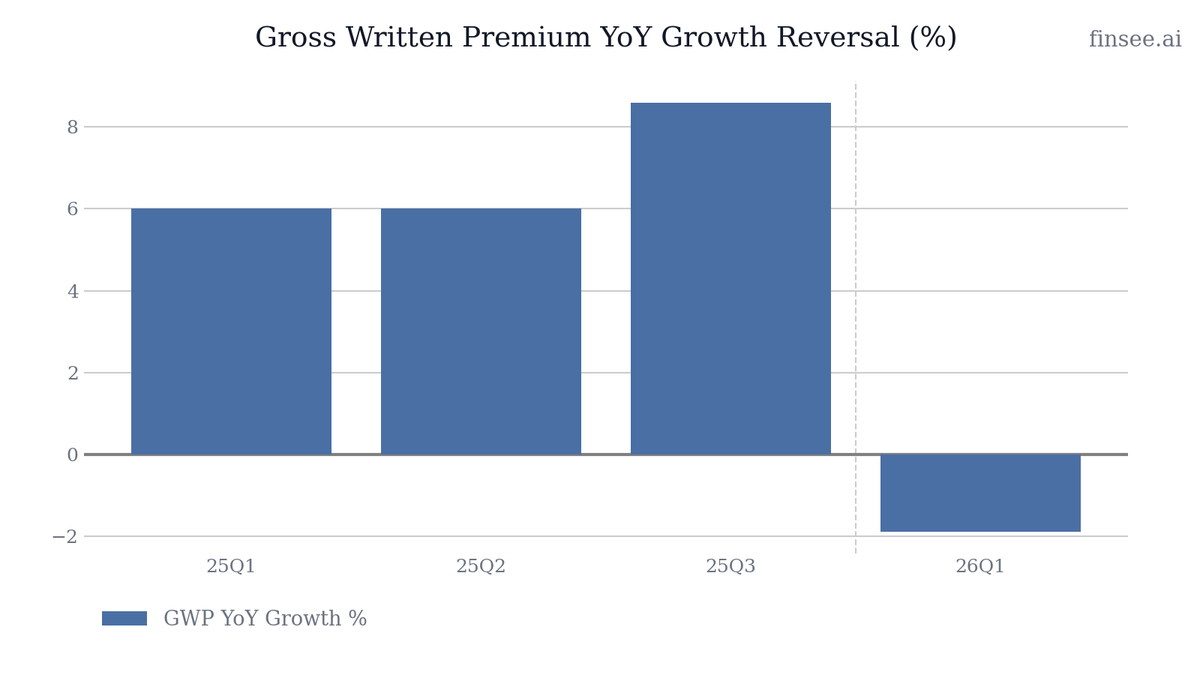
𝐂𝐨𝐥𝐥𝐚𝐛𝐨𝐫𝐚𝐭𝐢𝐯𝐞 𝐀𝐫𝐫𝐚𝐧𝐠𝐞𝐦𝐞𝐧𝐭 𝐑𝐞𝐯𝐞𝐧𝐮𝐞: $1.53 million Stable YoY compared to $1.48M in Q1 2025. This non-dilutive revenue stream helps offset a fraction of G&A costs, though it remains immaterial to the broader financial picture until commercial product sales begin. 𝐆𝐮𝐢𝐝𝐚𝐧𝐜𝐞 𝐎𝐂𝐔𝟒𝟎𝟎 (𝐑𝐏) 𝐑𝐞𝐠𝐮𝐥𝐚𝐭𝐨𝐫𝐲 𝐓𝐢𝐦𝐞𝐥𝐢𝐧𝐞: BLA Initiation Q3 2026 Accelerating toward commercialization. Management expects to begin a rolling BLA submission in Q3 2026, with completion expected in Q2 2027. Approval is targeted for Q4 2027. The successful completion of enrollment underpins confidence in this timeline. 𝐎𝐂𝐔𝟒𝟏𝟎𝐒𝐓 (𝐒𝐭𝐚𝐫𝐠𝐚𝐫𝐝𝐭) 𝐂𝐥𝐢𝐧𝐢𝐜𝐚𝐥 𝐌𝐢𝐥𝐞𝐬𝐭𝐨𝐧𝐞𝐬: Interim Analysis Q3 2026 Stable clinical execution. Topline results are guided for Q2 2027, followed immediately by a BLA submission by mid-2027. An interim readout of 24 subjects at 8 months is scheduled for Q3 2026, which will be a major stock catalyst. 𝐎𝐂𝐔𝟒𝟏𝟎 (𝐆𝐞𝐨𝐠𝐫𝐚𝐩𝐡𝐢𝐜 𝐀𝐭𝐫𝐨𝐩𝐡𝐲) 𝐏𝐡𝐚𝐬𝐞 𝟑: Initiation Q3 2026 Accelerating program scope. Based on highly successful Phase 2 data, Ocugen plans to launch a massive 300-subject Phase 3 adaptive design trial (powered at over 95%) in Q3 2026. The target BLA filing is set for 2028. 𝐊𝐞𝐲 𝐐𝐮𝐞𝐬𝐭𝐢𝐨𝐧𝐬 𝐂𝐨𝐦𝐦𝐞𝐫𝐜𝐢𝐚𝐥 𝐈𝐧𝐟𝐫𝐚𝐬𝐭𝐫𝐮𝐜𝐭𝐮𝐫𝐞 𝐂𝐚𝐬𝐡 𝐒𝐩𝐞𝐧𝐝 With the new cash runway extending into 2028 and BLA submissions starting next year, how much of the $115 million raised is earmarked for building a dedicated commercial sales force versus strictly funding clinical trials? 𝐏𝐡𝐚𝐬𝐞 𝟑 𝐆𝐞𝐨𝐠𝐫𝐚𝐩𝐡𝐢𝐜 𝐀𝐭𝐫𝐨𝐩𝐡𝐲 𝐓𝐫𝐢𝐚𝐥 𝐃𝐞𝐬𝐢𝐠𝐧 The Phase 3 GA trial plans for an adaptive design powered at over 95%. Has the FDA explicitly agreed to accept Ellipsoid Zone (EZ) preservation as a registrational endpoint, or will the primary endpoint remain strictly lesion size reduction? 𝐂𝐨𝐧𝐯𝐞𝐫𝐭𝐢𝐛𝐥𝐞 𝐍𝐨𝐭𝐞 𝐀𝐧𝐭𝐢-𝐃𝐢𝐥𝐮𝐭𝐢𝐨𝐧 Can management elaborate on any specific anti-dilution protections or capped call transactions associated with the 6.75% convertible notes to mitigate the eventual equity impact for current shareholders?
Finsee tweet media
English
0
0
9
1.1K
Finsee
Finsee@Finsee_main·
$PEG Q1 2026 earnings: Weather and Pricing Power Drive Beat, But Costs Weigh on Utility Margins PSEG delivered a robust Q1 2026, breaking past quarters' stable revenue trends with a 19% YoY top-line surge. The story of the quarter is twofold: severe winter weather drove the highest natural gas send-out since 2019, while the PSEG Power segment flexed massive pricing power, expanding operating earnings by 17% despite lower generation volumes and the absence of Zero Emission Certificates (ZECs). However, top-line success masked underlying cost pressures at the PSE&G utility segment, where earnings grew only 6% as inflation in O&M, depreciation, and interest expenses outpaced volume gains. Management maintained its $4.28-$4.40 full-year EPS guidance, projecting a stable trajectory. Full article with charts - link in bio 🐂 𝐁𝐮𝐥𝐥 𝐂𝐚𝐬𝐞 • 𝐔𝐧𝐥𝐨𝐜𝐤𝐢𝐧𝐠 𝐕𝐚𝐥𝐮𝐞 𝐢𝐧 𝐭𝐡𝐞 𝐏𝐨𝐰𝐞𝐫 𝐒𝐞𝐠𝐦𝐞𝐧𝐭 — PSEG Power & Other grew non-GAAP operating earnings 17% YoY to $201 million. Higher realized power prices comfortably offset a 4% drop in generation volume and the roll-off of ZEC subsidies, proving the segment's capacity to act as a cash-flow engine. • 𝐑𝐨𝐛𝐮𝐬𝐭 𝐂𝐚𝐩𝐢𝐭𝐚𝐥 𝐄𝐱𝐞𝐜𝐮𝐭𝐢𝐨𝐧 — The company’s ability to fund its massive $24-$28 billion five-year capital plan is intact. Operating cash flow surged 21% YoY to $1.27 billion, generating ample free cash flow to support the 6-8% targeted EPS CAGR without issuing equity. 🐻 𝐁𝐞𝐚𝐫 𝐂𝐚𝐬𝐞 • 𝐔𝐭𝐢𝐥𝐢𝐭𝐲 𝐌𝐚𝐫𝐠𝐢𝐧 𝐂𝐨𝐦𝐩𝐫𝐞𝐬𝐬𝐢𝐨𝐧 — Despite a massive 7% surge in gas volumes and a 4% jump in electric sales, PSE&G utility earnings grew a meager 5.7%. Higher O&M, depreciation, and interest expenses are eroding the operating leverage gained from top-line strength. • 𝐍𝐮𝐜𝐥𝐞𝐚𝐫 𝐕𝐨𝐥𝐮𝐦𝐞 𝐃𝐫𝐨𝐩 — Nuclear output fell 4.4% YoY to 7,989 GWh. While currently masked by high power market prices, any future price normalization combined with lower output would severely pressure PSEG Power's margins. ⚖️ 𝐕𝐞𝐫𝐝𝐢𝐜𝐭: 🟢 Bullish. PSEG is effectively monetizing the tight PJM power market while executing its regulated capital plan. While utility cost inflation warrants monitoring, the company's ability to drive 8%+ earnings growth against the headwind of expiring ZECs demonstrates structural earnings power. 𝐊𝐞𝐲 𝐓𝐡𝐞𝐦𝐞𝐬 🟢 𝐌𝐚𝐜𝐫𝐨 𝐓𝐚𝐢𝐥𝐰𝐢𝐧𝐝𝐬: 𝐒𝐞𝐯𝐞𝐫𝐞 𝐖𝐢𝐧𝐭𝐞𝐫 𝐖𝐞𝐚𝐭𝐡𝐞𝐫 𝐃𝐫𝐢𝐯𝐞𝐬 𝐏𝐞𝐚𝐤 𝐃𝐞𝐦𝐚𝐧𝐝 [NEW] The worst winter storm in 30 years and sustained single-digit temperatures resulted in PSEG's highest gas send-out since 2019. Electric sales accelerated (+4% YoY) and Gas sales surged (+7% YoY). Heating Degree Days (HDD) were 8% above normal. This weather-driven volume surge provided a massive, albeit seasonal, revenue tailwind. 🟢 𝐏𝐫𝐢𝐜𝐢𝐧𝐠 𝐏𝐨𝐰𝐞𝐫 𝐢𝐧 𝐏𝐒𝐄𝐆 𝐏𝐨𝐰𝐞𝐫 & 𝐎𝐭𝐡𝐞𝐫 PSEG Power successfully navigated the expiration of ZEC awards by capitalizing on higher realized prices in the wholesale market. The segment generated $201 million in non-GAAP operating earnings (up 17% YoY), cementing its role as the financial engine subsidizing the broader corporate capital plan. 🔴 𝐂𝐨𝐧𝐭𝐫𝐚𝐝𝐢𝐜𝐭𝐢𝐧𝐠 𝐃𝐚𝐭𝐚: 𝐍𝐮𝐜𝐥𝐞𝐚𝐫 𝐕𝐨𝐥𝐮𝐦𝐞 𝐃𝐞𝐜𝐥𝐢𝐧𝐞 [NEW] While PSEG Power's financial results were stellar, underlying operational data contradicts the flawless narrative. Total nuclear generation declined 4.4% YoY to 7,989 GWh (down from 8,355 GWh). Management must clarify if this is due to planned refueling transitions (e. g., Hope Creek moving to a 24-month cycle) or unplanned outages. If realized power prices normalize, this volume deficit will become a severe headwind. 🔴 𝐌𝐚𝐫𝐠𝐢𝐧 𝐂𝐨𝐦𝐩𝐫𝐞𝐬𝐬𝐢𝐨𝐧 𝐢𝐧 𝐭𝐡𝐞 𝐑𝐞𝐠𝐮𝐥𝐚𝐭𝐞𝐝 𝐔𝐭𝐢𝐥𝐢𝐭𝐲 PSE&G continues to suffer from poor operating leverage. A 19% consolidated revenue jump resulted in only a 5.7% increase in PSE&G's non-GAAP earnings. The culprit: accelerating O&M costs, higher depreciation, and rising interest expense tied to incremental infrastructure investments. Top-line growth is essentially being consumed by the cost of servicing the rate base. ⚪ 𝐑𝐚𝐝𝐢𝐨 𝐒𝐢𝐥𝐞𝐧𝐜𝐞 𝐨𝐧 𝐭𝐡𝐞 𝐃𝐚𝐭𝐚 𝐂𝐞𝐧𝐭𝐞𝐫 𝐏𝐢𝐩𝐞𝐥𝐢𝐧𝐞 [NEW] Throughout 2025, management aggressively touted a surging large-load pipeline that reached over 11.5 GW, heavily tied to data center inquiries. The Q1 2026 earnings release completely omits any mention of data centers or large load conversion. This sudden silence raises a red flag regarding the actual conversion rate of those inquiries into signed commercial contracts. 🟢 𝐓𝐞𝐜𝐡𝐧𝐨𝐥𝐨𝐠𝐲 & 𝐈𝐧𝐧𝐨𝐯𝐚𝐭𝐢𝐨𝐧: 𝐆𝐒𝐌𝐏 𝐈𝐈𝐈 𝐚𝐧𝐝 𝐆𝐫𝐢𝐝 𝐌𝐨𝐝𝐞𝐫𝐧𝐢𝐳𝐚𝐭𝐢𝐨𝐧 Continued deployment of the Gas System Modernization Program (GSMP III) and the Energy Efficiency (EE) programs are the structural drivers of the 6-7.5% rate base CAGR. By replacing aging infrastructure and deploying smart grid tech, PSEG is securing guaranteed regulatory returns while actively reducing system-wide methane emissions. 𝐎𝐭𝐡𝐞𝐫 𝐊𝐏𝐈𝐬 𝐎𝐩𝐞𝐫𝐚𝐭𝐢𝐧𝐠 𝐂𝐚𝐬𝐡 𝐅𝐥𝐨𝐰 (𝟐𝟔𝐐𝟏): $1,271 million Accelerating. Operating cash flow increased 21% YoY from $1,049 million in 25Q1. This robust cash generation easily covered the $736 million deployed in investing activities, yielding over $500 million in free cash flow. This metric validates management's claim that they can fund their massive $24-$28B long-term capital plan without needing to issue new equity. 𝐓𝐨𝐭𝐚𝐥 𝐃𝐞𝐛𝐭 (𝟐𝟔𝐐𝟏): $24,255 million Stable. Total debt increased slightly from $24,074 million at year-end 2025, driven by a shift from commercial paper into long-term debt issuance. Despite the heavy capex burden, the balance sheet remains insulated from sudden rate shocks, though interest expense growth is beginning to pressure utility margins. 𝐆𝐮𝐢𝐝𝐚𝐧𝐜𝐞 𝐅𝐘𝟐𝟔 𝐍𝐨𝐧-𝐆𝐀𝐀𝐏 𝐎𝐩𝐞𝐫𝐚𝐭𝐢𝐧𝐠 𝐄𝐚𝐫𝐧𝐢𝐧𝐠𝐬: $4.28 - $4.40 per share Stable. Maintained from prior guidance. The midpoint ($4.34) implies a solid 7.1% YoY growth against FY25's $4.05. This fits perfectly within management's long-term 6-8% CAGR target, relying heavily on stable electric base rates and higher wholesale power prices to offset the loss of ZEC revenues. 𝐋𝐨𝐧𝐠-𝐓𝐞𝐫𝐦 𝐄𝐚𝐫𝐧𝐢𝐧𝐠𝐬 𝐂𝐀𝐆𝐑 (𝟐𝟎𝟐𝟔-𝟐𝟎𝟑𝟎): 6.0% - 8.0% Stable. Reaffirmed in the Q1 materials, pointing to sustained visibility. The execution depends on BPU regulatory support and the assumption that market power prices will remain above the federal PTC floor for the nuclear fleet. 𝐊𝐞𝐲 𝐐𝐮𝐞𝐬𝐭𝐢𝐨𝐧𝐬 𝐍𝐮𝐜𝐥𝐞𝐚𝐫 𝐕𝐨𝐥𝐮𝐦𝐞 𝐃𝐞𝐜𝐥𝐢𝐧𝐞 Nuclear generation dropped by over 4% this quarter. Was this strictly driven by scheduled refueling outages and the shift to a 24-month cycle, or did the fleet experience unplanned downtime? 𝐃𝐚𝐭𝐚 𝐂𝐞𝐧𝐭𝐞𝐫 𝐂𝐨𝐧𝐯𝐞𝐫𝐬𝐢𝐨𝐧 𝐑𝐚𝐭𝐞 In late 2025, you highlighted an 11.5 GW pipeline for large load and data center inquiries. What is the current status of that pipeline, and have you seen any material conversion into signed commercial contracts or 'Bring Your Own Generation' (BYOG) agreements? 𝐎&𝐌 𝐂𝐨𝐬𝐭 𝐓𝐫𝐚𝐣𝐞𝐜𝐭𝐨𝐫𝐲 Utility margins were pressured by rising O&M and depreciation expenses despite massive weather-driven sales. Are these O&M headwinds largely tied to the winter storm response, or do they represent a structural inflation baseline for the remainder of 2026? 𝐍𝐞𝐰 𝐆𝐞𝐧𝐞𝐫𝐚𝐭𝐢𝐨𝐧 𝐋𝐞𝐠𝐢𝐬𝐥𝐚𝐭𝐢𝐨𝐧 With the new administration in place, what is the latest read on state legislation that would allow regulated utilities to build and own new in-state generation to address the PJM resource adequacy crisis?
Finsee tweet media
English
0
0
0
373
Finsee
Finsee@Finsee_main·
$HQ Q1 2026 earnings: SPAC Cash Secures the Runway, But the Burn Rate is Accelerating Horizon Quantum successfully navigated its SPAC merger with dMY Squared, injecting a desperately needed $96.6 million in cash to fund its multi-modality quantum testbed. However, the cost of going public and expanding operations is steep. Adjusted EBITDA losses more than doubled year-over-year to $4.1 million, and general administrative expenses spiked dramatically. The company is making aggressive technical moves—buying an IonQ 256-qubit system and partnering with European hardware leaders—but remains a pre-revenue, high-burn R&D play. Investors now have to wait for the science to turn into commercial sales. Full article with charts - link in bio 🐂 𝐁𝐮𝐥𝐥 𝐂𝐚𝐬𝐞 • 𝐅𝐢𝐧𝐚𝐧𝐜𝐢𝐚𝐥 𝐑𝐮𝐧𝐰𝐚𝐲 𝐒𝐞𝐜𝐮𝐫𝐞𝐝 — The SPAC transaction provided $96.6 million in cash (up from a precarious $0.2 million at the end of 2025). This eliminates immediate survival risks and fully funds the company's aggressive hardware and R&D roadmap. • 𝐌𝐮𝐥𝐭𝐢-𝐌𝐨𝐝𝐚𝐥𝐢𝐭𝐲 𝐈𝐧𝐟𝐫𝐚𝐬𝐭𝐫𝐮𝐜𝐭𝐮𝐫𝐞 𝐋𝐞𝐚𝐝 — By purchasing a 256-qubit IonQ trapped-ion system to sit alongside its superconducting system, Horizon is building a rare, genuinely hardware-agnostic commercial testbed to prove out its Triple Alpha software. 🐻 𝐁𝐞𝐚𝐫 𝐂𝐚𝐬𝐞 • 𝐙𝐞𝐫𝐨 𝐂𝐨𝐦𝐦𝐞𝐫𝐜𝐢𝐚𝐥 𝐓𝐫𝐚𝐜𝐭𝐢𝐨𝐧 — The company generated exactly $0 in revenue in Q1 2026. This remains a purely speculative R&D vehicle with no demonstrated product-market fit or commercial offramp. • 𝐏𝐮𝐛𝐥𝐢𝐜 𝐂𝐨𝐦𝐩𝐚𝐧𝐲 𝐂𝐨𝐬𝐭 𝐏𝐞𝐧𝐚𝐥𝐭𝐲 — General & Administrative expenses ballooned 191% year-over-year (excluding stock-based comp and one-time fees). The structural cost of operating as a public company is severely accelerating the cash burn. ⚖️ 𝐕𝐞𝐫𝐝𝐢𝐜𝐭: ⚪ Neutral. The $96.6M cash infusion buys management the time needed to execute its Triple Alpha IDE roadmap. But with zero commercial sales and a rapidly widening burn rate, Horizon Quantum is entirely a 'show-me' story for long-term believers in quantum advantage. 𝐊𝐞𝐲 𝐓𝐡𝐞𝐦𝐞𝐬 🟢 𝐇𝐚𝐫𝐝𝐰𝐚𝐫𝐞 𝐄𝐱𝐩𝐚𝐧𝐬𝐢𝐨𝐧: 𝐓𝐡𝐞 𝐌𝐮𝐥𝐭𝐢-𝐌𝐨𝐝𝐚𝐥𝐢𝐭𝐲 𝐄𝐝𝐠𝐞 [NEW] Horizon Quantum announced the purchase of a 6th-generation, 256-qubit trapped-ion system from IonQ. This is a critical strategic move. By hosting both solid-state (Ember-1) and atom-based systems on-site, the company is bypassing cloud latency to build real-time runtime capabilities directly into its software infrastructure. This physical testbed approach gives them a distinct developmental advantage over pure-play software competitors. 🔴 𝐎𝐩𝐞𝐫𝐚𝐭𝐢𝐧𝐠 𝐄𝐱𝐩𝐞𝐧𝐬𝐞𝐬 𝐀𝐜𝐜𝐞𝐥𝐞𝐫𝐚𝐭𝐢𝐧𝐠 [NEW] The operational cost structure is accelerating steeply. Adjusted EBITDA loss widened to $4.1M (from $1.8M a year ago). R&D expenses grew 135% YoY (excluding one-time stock comps) as they hired aggressively and set up the new testbed. More concerning is G&A, which soared 191% YoY (excluding one-time items) just to handle the compliance and infrastructure of being a publicly traded company. Management must prove this newly bloated cost base will translate into product velocity. ⚪ 𝐒𝐭𝐫𝐚𝐭𝐞𝐠𝐢𝐜 𝐄𝐜𝐨𝐬𝐲𝐬𝐭𝐞𝐦 𝐄𝐧𝐭𝐫𝐞𝐧𝐜𝐡𝐦𝐞𝐧𝐭 [NEW] Horizon Quantum is aggressively securing its place as the middleware of the quantum ecosystem. It announced two major European partnerships: Alice & Bob (to integrate emulated cat qubits for fault-tolerant computing) and AQT (integrating Triple Alpha directly with AQT's trapped-ion processors). This hardware-agnostic strategy ensures Triple Alpha remains relevant regardless of which quantum hardware modality ultimately wins the commercial race. 🔴🔴 𝐑𝐞𝐯𝐞𝐧𝐮𝐞 𝐑𝐞𝐚𝐥𝐢𝐭𝐢𝐞𝐬 Horizon reported zero revenue for the quarter. While expected for a company transitioning to its commercial phase, it stands in stark contrast to the $3.6M net loss and $4.1M Adjusted EBITDA burn. The clock is now ticking on the $96.6M cash pile. Investors need a clear timeline on when the Triple Alpha IDE will transition from early-access previews to paid commercial licenses. 𝐎𝐭𝐡𝐞𝐫 𝐊𝐏𝐈𝐬 𝐂𝐚𝐬𝐡 𝐚𝐧𝐝 𝐂𝐚𝐬𝐡 𝐄𝐪𝐮𝐢𝐯𝐚𝐥𝐞𝐧𝐭𝐬: $96.6 million The singular most important metric in the release. The SPAC merger and PIPE transaction rescued the balance sheet, vaulting cash from a dangerously low $223K at the end of December 2025 to $96.6M. This fully de-risks the immediate going-concern threat and funds the IonQ purchase. 𝐍𝐞𝐭 𝐋𝐨𝐬𝐬 𝐯𝐬. 𝐀𝐝𝐣𝐮𝐬𝐭𝐞𝐝 𝐄𝐁𝐈𝐓𝐃𝐀: -$3.6 million vs -$4.1 million The GAAP Net Loss of $3.6M masks the true cash bleed due to a highly beneficial $3.0M non-cash gain from the fair value remeasurement of SPAC warrant and SAFE liabilities. Adjusted EBITDA (-$4.1M) is the more accurate reflection of the company's accelerating cash burn. 𝐆𝐮𝐢𝐝𝐚𝐧𝐜𝐞 𝐅𝐨𝐫𝐰𝐚𝐫𝐝 𝐅𝐢𝐧𝐚𝐧𝐜𝐢𝐚𝐥𝐬: None provided Management did not issue quantitative financial guidance for upcoming quarters, which is standard for pre-revenue SPACs. The qualitative guidance focuses entirely on investing the newly acquired capital into R&D for the Triple Alpha platform and expanding the hardware testbed. 𝐊𝐞𝐲 𝐐𝐮𝐞𝐬𝐭𝐢𝐨𝐧𝐬 𝐍𝐨𝐫𝐦𝐚𝐥𝐢𝐳𝐞𝐝 𝐂𝐚𝐬𝐡 𝐁𝐮𝐫𝐧 With the SPAC transaction complete and public company infrastructure now in place, what is the expected normalized quarterly cash burn rate going forward? 𝐂𝐨𝐦𝐦𝐞𝐫𝐜𝐢𝐚𝐥𝐢𝐳𝐚𝐭𝐢𝐨𝐧 𝐓𝐢𝐦𝐞𝐥𝐢𝐧𝐞 Triple Alpha is currently in the hands of early-access users. What specific technical or market milestones need to be hit before the company begins monetizing this platform? 𝐇𝐚𝐫𝐝𝐰𝐚𝐫𝐞 𝐔𝐭𝐢𝐥𝐢𝐳𝐚𝐭𝐢𝐨𝐧 𝐚𝐧𝐝 𝐌𝐨𝐧𝐞𝐭𝐢𝐳𝐚𝐭𝐢𝐨𝐧 With the purchase of the 256-qubit IonQ system, how much of this multi-modality testbed's capacity will be strictly used for internal R&D versus being packaged and sold as a service to external developers?
Finsee tweet media
English
0
1
2
444
Finsee
Finsee@Finsee_main·
$AUDC Q1 2026 earnings: ARR Milestone Hit, But AI Investments Continue to Crush Margins AudioCodes delivered a mixed Q1 2026, characterized by sluggish 2.9% YoY revenue growth and severe margin compression. While management highlighted 'strong financial results' and celebrated crossing the $80M ARR threshold (driven by >50% growth in Conversational AI), the bottom line tells a different story. GAAP net income collapsed 51% YoY to $2.0M, and non-GAAP operating margins deteriorated to 7.7% from 8.9% a year ago. The company is aggressively buying back stock—spending $13.7M this quarter—but the core narrative remains a painful transition: a mature, slow-growth connectivity business funding a high-burn, high-growth AI software pivot. Full article with charts - link in bio 🐂 𝐁𝐮𝐥𝐥 𝐂𝐚𝐬𝐞 • 𝐒𝐨𝐟𝐭𝐰𝐚𝐫𝐞 𝐓𝐫𝐚𝐧𝐬𝐢𝐭𝐢𝐨𝐧 𝐆𝐚𝐢𝐧𝐢𝐧𝐠 𝐓𝐫𝐚𝐜𝐭𝐢𝐨𝐧 — Annual Recurring Revenue (ARR) hit $80M, up nearly 20% YoY, proving that the shift from perpetual hardware to cloud software/services is working. The Conversational AI portfolio is successfully scaling. • 𝐂𝐚𝐬𝐡 𝐆𝐞𝐧𝐞𝐫𝐚𝐭𝐢𝐨𝐧 𝐑𝐞𝐦𝐚𝐢𝐧𝐬 𝐈𝐧𝐭𝐚𝐜𝐭 — Despite margin compression on the P&L, operating cash flow accelerated to $12.8M for the quarter, supporting robust capital returns ($19M returned via dividends and buybacks). 🐻 𝐁𝐞𝐚𝐫 𝐂𝐚𝐬𝐞 • 𝐒𝐞𝐯𝐞𝐫𝐞 𝐌𝐚𝐫𝐠𝐢𝐧 𝐃𝐞𝐭𝐞𝐫𝐢𝐨𝐫𝐚𝐭𝐢𝐨𝐧 — The Voice AI pivot is expensive. GAAP EPS halved from $0.13 to $0.07 YoY. If top-line growth (currently stuck at ~3%) doesn't accelerate significantly, earnings will remain trapped. • 𝐋𝐞𝐠𝐚𝐜𝐲 𝐇𝐚𝐫𝐝𝐰𝐚𝐫𝐞 𝐃𝐫𝐚𝐠 — Products revenue grew a meager 1.2% YoY to $28.1M. The legacy connectivity business, which makes up ~45% of sales, acts as an anchor on the consolidated growth rate. ⚖️ 𝐕𝐞𝐫𝐝𝐢𝐜𝐭: ⚪ Neutral. The underlying transition to a higher-quality ARR model is evident, but investors are paying a steep price in near-term profitability. Top-line growth of 2.9% is too anemic to offset the heavy R&D and S&M investments required for the AI pivot. 𝐊𝐞𝐲 𝐓𝐡𝐞𝐦𝐞𝐬 🟢 𝐂𝐨𝐧𝐯𝐞𝐫𝐬𝐚𝐭𝐢𝐨𝐧𝐚𝐥 𝐀𝐈 𝐆𝐫𝐨𝐰𝐭𝐡 𝐄𝐧𝐠𝐢𝐧𝐞 Conversational AI (CAI) remains the absolute bright spot, accelerating with over 50% YoY growth. The Microsoft Teams-certified Voca CIC contact center solution posted record revenues. Live Hub and Voice AI Connect (VAIC) are securing new logos driven by enterprise demand for virtual agents. This segment is successfully offsetting legacy stagnation. 🔴 𝐏𝐫𝐨𝐟𝐢𝐭𝐚𝐛𝐢𝐥𝐢𝐭𝐲 𝐂𝐨𝐥𝐥𝐚𝐩𝐬𝐞 𝐂𝐨𝐧𝐭𝐫𝐚𝐝𝐢𝐜𝐭𝐬 𝐎𝐩𝐭𝐢𝐦𝐢𝐬𝐭𝐢𝐜 𝐓𝐨𝐧𝐞 [NEW] CEO Shabtai Adlersberg praised 'strong financial results,' but the actual data is alarming. Operating expenses grew faster than revenue (up 6.4% YoY to $37.7M). As a result, non-GAAP operating margin is decelerating, falling to 7.7% from 8.9% in 25Q1, and GAAP net income dropped 51%. The transition is clearly pressuring the bottom line. ⚪ 𝐀𝐠𝐠𝐫𝐞𝐬𝐬𝐢𝐯𝐞 𝐂𝐚𝐩𝐢𝐭𝐚𝐥 𝐑𝐞𝐭𝐮𝐫𝐧𝐬 𝐃𝐫𝐚𝐢𝐧𝐢𝐧𝐠 𝐂𝐚𝐬𝐡 [NEW] Management is deploying cash aggressively to prop up shareholder returns. In Q1, AudioCodes spent $13.7M to repurchase 1.74M shares and paid $5.3M in dividends. Total cash return of ~$19M significantly exceeded the $12.8M in operating cash flow, pulling total cash/investments down to $68.1M from $75.7M last quarter. 🟢 𝐃𝐚𝐭𝐚 𝐒𝐨𝐯𝐞𝐫𝐞𝐢𝐠𝐧𝐭𝐲 𝐃𝐫𝐢𝐯𝐢𝐧𝐠 𝐄𝐝𝐠𝐞 𝐂𝐨𝐦𝐩𝐮𝐭𝐢𝐧𝐠 𝐃𝐞𝐦𝐚𝐧𝐝 A notable macro/tech theme emerged regarding Meeting Insights: the On-Prem version is seeing growing demand. Management specifically cited the need for 'edge computing solutions' driven by enterprise concerns over data sovereignty and control. This validates the company's hybrid deployment strategy in an era where cloud-only AI faces regulatory scrutiny. 🔴 𝐏𝐫𝐨𝐝𝐮𝐜𝐭𝐬 𝐒𝐞𝐠𝐦𝐞𝐧𝐭 𝐒𝐭𝐚𝐠𝐧𝐚𝐭𝐢𝐨𝐧 The legacy Products segment remains stable but stagnant, growing just 1.2% YoY to $28.1M. This lagging segment continues to cap the company's overall growth potential. Without a clear catalyst for legacy hardware, consolidated growth will heavily rely on Services and AI scaling up enough to mathematically overpower this anchor. 𝐎𝐭𝐡𝐞𝐫 𝐊𝐏𝐈𝐬 𝐒𝐞𝐫𝐯𝐢𝐜𝐞𝐬 𝐑𝐞𝐯𝐞𝐧𝐮𝐞 (𝟐𝟔𝐐𝟏): $34.0 million Accelerating slightly. Grew 4.3% YoY, up from the 1.0% YoY growth seen in 25Q4. Services now represent 54.7% of total revenue, driving the mix shift toward recurring models. 𝐎𝐩𝐞𝐫𝐚𝐭𝐢𝐧𝐠 𝐂𝐚𝐬𝐡 𝐅𝐥𝐨𝐰 (𝟐𝟔𝐐𝟏): $12.8 million Stable. Despite the steep drop in net income, operating cash flow remained robust (down slightly from $13.5M in 25Q1). This disconnect is driven by non-cash add-backs (depreciation/amortization) and favorable working capital movements (a $9.6M decrease in trade receivables). 𝐆𝐮𝐢𝐝𝐚𝐧𝐜𝐞 𝐑𝐞𝐦𝐚𝐢𝐧𝐝𝐞𝐫 𝐨𝐟 𝟐𝟎𝟐𝟔 𝐓𝐨𝐩-𝐋𝐢𝐧𝐞 𝐎𝐮𝐭𝐥𝐨𝐨𝐤: Qualitative Only Management did not provide quantitative updates in the press release, strictly noting they are positioned favorably for 'continued healthy top-line growth throughout the remainder of 2026.' Based on the 2.9% print in Q1, achieving the prior call's implied FY targets will require slight acceleration in subsequent quarters. 𝐊𝐞𝐲 𝐐𝐮𝐞𝐬𝐭𝐢𝐨𝐧𝐬 𝐌𝐚𝐫𝐠𝐢𝐧 𝐓𝐫𝐨𝐮𝐠𝐡 𝐕𝐢𝐬𝐢𝐛𝐢𝐥𝐢𝐭𝐲 Non-GAAP operating margins compressed to 7.7% this quarter. Are we currently at the trough of the Voice AI investment cycle, or should investors expect further margin degradation before the software mix-shift provides a lift? 𝐁𝐮𝐲𝐛𝐚𝐜𝐤 𝐒𝐮𝐬𝐭𝐚𝐢𝐧𝐚𝐛𝐢𝐥𝐢𝐭𝐲 You returned nearly $19M via buybacks and dividends this quarter, exceeding your $12.8M operating cash flow and drawing down the cash balance. With only $1.6M remaining on the current repurchase authorization, will you seek a new authorization, or will buybacks pause to rebuild cash? 𝐋𝐞𝐠𝐚𝐜𝐲 𝐏𝐫𝐨𝐝𝐮𝐜𝐭𝐬 𝐎𝐮𝐭𝐥𝐨𝐨𝐤 Products revenue grew just 1.2% YoY. Are you managing this segment for cash to fund AI, or are there specific initiatives (like the Cisco Webex integration) that could return this segment to meaningful growth?
Finsee tweet media
English
0
0
0
403
Finsee
Finsee@Finsee_main·
$BUD Q1 2026 earnings: Volume Growth Reverses the Trend, But Marketing Spend Caps Margins AB InBev started 2026 with a decisive break from recent quarters: volumes finally reversed their decline, growing 0.8% globally. Combined with premiumization (revenue per hl +4.5%), organic revenue accelerated to an impressive 5.8%. The growth was driven by Middle Americas (+9.4% revenue) and surging adjacent categories like Beyond Beer (+37%). However, this top-line acceleration came at a cost. While gross margins expanded by 76 basis points, management aggressively reinvested those gains into sales and marketing to fuel the momentum, which—alongside FX headwinds—compressed Normalized EBITDA margins by 15 bps to 35.6%. Despite the margin squeeze, robust revenue and deleveraging pushed Underlying EPS up nearly 21% to $0.97. Full article with charts - link in bio 🐂 𝐁𝐮𝐥𝐥 𝐂𝐚𝐬𝐞 • 𝐕𝐨𝐥𝐮𝐦𝐞 𝐂𝐨𝐧𝐭𝐫𝐚𝐜𝐭𝐢𝐨𝐧 𝐑𝐞𝐯𝐞𝐫𝐬𝐞𝐬 — After multiple quarters of volume declines (-2.2% in 25Q1, -1.9% in 25Q2), total volume grew 0.8%. Beer specifically grew 1.2%, signaling that consumer sentiment and brand investments are finally translating into actual unit growth. • 𝐃𝐢𝐠𝐢𝐭𝐚𝐥 𝐏𝐥𝐚𝐭𝐟𝐨𝐫𝐦 𝐌𝐨𝐧𝐞𝐭𝐢𝐳𝐚𝐭𝐢𝐨𝐧 𝐒𝐮𝐫𝐠𝐢𝐧𝐠 — The BEES ecosystem is becoming a massive standalone driver. BEES Marketplace GMV (third-party products) surged 55% YoY to $1.1B for the quarter, proving the platform's stickiness and high-margin potential. 🐻 𝐁𝐞𝐚𝐫 𝐂𝐚𝐬𝐞 • 𝐄𝐁𝐈𝐓𝐃𝐀 𝐌𝐚𝐫𝐠𝐢𝐧 𝐒𝐭𝐚𝐥𝐥𝐬 — Despite a healthy 76 bps gross margin expansion, Normalized EBITDA margins contracted by 15 bps. The company is having to spend heavily on SG&A (+6.5%) to generate top-line growth, diluting operational leverage. • 𝐂𝐡𝐢𝐧𝐚 𝐑𝐞𝐜𝐨𝐯𝐞𝐫𝐲 𝐋𝐚𝐠𝐬 — Asia Pacific volumes fell 0.4%, dragged down by a 1.5% volume drop and a 3.9% revenue drop in China. Rebuilding momentum in the Chinese in-home channel is proving costly and slow. ⚖️ 𝐕𝐞𝐫𝐝𝐢𝐜𝐭: 🟢 Bullish. The return to positive volume growth is the inflection point investors have been waiting for. While EBITDA margin compressed slightly, the 21% Underlying EPS jump proves the company's deleveraging and premiumization strategies are generating immense bottom-line value. 𝐊𝐞𝐲 𝐓𝐡𝐞𝐦𝐞𝐬 🟢 𝐌𝐢𝐝𝐝𝐥𝐞 𝐚𝐧𝐝 𝐒𝐨𝐮𝐭𝐡 𝐀𝐦𝐞𝐫𝐢𝐜𝐚𝐬 𝐏𝐨𝐰𝐞𝐫 𝐭𝐡𝐞 𝐕𝐨𝐥𝐮𝐦𝐞 𝐓𝐮𝐫𝐧𝐚𝐫𝐨𝐮𝐧𝐝 The Middle Americas segment was the undisputed growth engine, accelerating with a 4.8% volume increase and 9.4% revenue jump, driven by record highs in Mexico and Colombia. South America added to the strength with a 9.0% revenue increase (Brazil beer volumes +1.2%), proving the company's pricing power and premiumization strategy in emerging markets remain intact. 🟢 𝐁𝐞𝐲𝐨𝐧𝐝 𝐁𝐞𝐞𝐫 𝐚𝐧𝐝 𝐍𝐨-𝐀𝐥𝐜𝐨𝐡𝐨𝐥 𝐇𝐢𝐭 𝐄𝐬𝐜𝐚𝐩𝐞 𝐕𝐞𝐥𝐨𝐜𝐢𝐭𝐲 The 'Balanced Choices' and adjacent categories are dramatically outperforming core beer. The No-Alcohol portfolio grew revenue by 27% (led by Corona Cero), and Beyond Beer accelerated to a massive 37% revenue jump, driven largely by Cutwater's triple-digit growth in the US and the global launch of Flying Fish. These segments are successfully capturing new occasions and driving significant positive mix. 🔴 𝐌𝐚𝐫𝐠𝐢𝐧 𝐒𝐪𝐮𝐞𝐞𝐳𝐞 𝐟𝐫𝐨𝐦 𝐒𝐚𝐥𝐞𝐬 & 𝐌𝐚𝐫𝐤𝐞𝐭𝐢𝐧𝐠 𝐑𝐞𝐢𝐧𝐯𝐞𝐬𝐭𝐦𝐞𝐧𝐭 A reversing trend appeared in operating efficiency. While the company achieved a stellar 7.2% organic gross profit increase (margin +76 bps), Normalized EBITDA margins contracted by 15 bps to 35.6%. Management cited 'transactional FX headwinds' and 'increased sales and marketing investments.' Essentially, it is costing more to acquire this top-line growth than in previous quarters. 🔴 𝐍𝐨𝐫𝐭𝐡 𝐀𝐦𝐞𝐫𝐢𝐜𝐚 𝐒𝐡𝐢𝐩𝐦𝐞𝐧𝐭𝐬 𝐃𝐢𝐬𝐜𝐨𝐧𝐧𝐞𝐜𝐭 North America remains a stable laggard. While revenue managed a 0.9% increase on strong pricing (+4.4% rev/hl), total volumes dropped 3.1%. A troubling disconnect persists between Sales-to-Retailers (STRs +0.3%) and Sales-to-Wholesalers (STWs -3.2%). While management blames comparable shipment phasing, US volumes are still structurally soft. ⚪ 𝐂𝐡𝐢𝐧𝐚'𝐬 𝐂𝐨𝐬𝐭𝐥𝐲 𝐏𝐢𝐯𝐨𝐭 China is decelerating financially even as volumes show slight sequential improvement. Overall volumes declined 1.5%, but revenue fell much harder (-3.9%), pulling regional EBITDA down by 11.8%. The company is actively sacrificing pricing (Revenue per hl -2.5%) and increasing marketing spend to rebuild its presence in the in-home channel after a prolonged on-trade weakness. 𝐎𝐭𝐡𝐞𝐫 𝐊𝐏𝐈𝐬 𝐔𝐧𝐝𝐞𝐫𝐥𝐲𝐢𝐧𝐠 𝐄𝐏𝐒 (𝟐𝟔𝐐𝟏): $0.97 Accelerating significantly. Up 20.8% YoY from $0.81 (or 8.8% on a constant currency basis). This highlights the compounding effect of organic EBITDA growth, lower net finance costs due to deleveraging, and positive mix. 𝐆𝐫𝐨𝐬𝐬 𝐏𝐫𝐨𝐟𝐢𝐭 𝐌𝐚𝐫𝐠𝐢𝐧 (𝟐𝟔𝐐𝟏): 56.6% Accelerating. Up 76 basis points YoY. Shows incredible pricing power (revenue per hectoliter +4.5%) overriding any raw input cost inflation. The fact that EBITDA margins still contracted makes this metric a critical indicator that the top-line health is strong, but OPEX is heavy. 𝐍𝐞𝐭 𝐅𝐢𝐧𝐚𝐧𝐜𝐞 𝐈𝐧𝐜𝐨𝐦𝐞/(𝐄𝐱𝐩𝐞𝐧𝐬𝐞) (𝟐𝟔𝐐𝟏): $(1,050) million Reversing slightly from the $984 million expense in 1Q25. While net interest expense actually improved (from $621M down to $613M) due to deleveraging, accretion and other financial results weighed on the line item. 𝐆𝐮𝐢𝐝𝐚𝐧𝐜𝐞 𝐅𝐘𝟐𝟔 𝐄𝐁𝐈𝐓𝐃𝐀 𝐆𝐫𝐨𝐰𝐭𝐡: 4% - 8% Stable. The company maintained its medium-term growth outlook. Given the 5.3% organic delivery in Q1, the midpoint of 6% looks highly achievable, particularly if summer and FIFA World Cup activations yield expected returns. 𝐅𝐘𝟐𝟔 𝐍𝐞𝐭 𝐂𝐚𝐩𝐢𝐭𝐚𝐥 𝐄𝐱𝐩𝐞𝐧𝐝𝐢𝐭𝐮𝐫𝐞: $3.5 - $4.0 billion Stable. Consistent with previous year targets, showing disciplined capital allocation that leaves ample room for free cash flow generation and the ongoing $6B share buyback program. 𝐅𝐘𝟐𝟔 𝐄𝐟𝐟𝐞𝐜𝐭𝐢𝐯𝐞 𝐓𝐚𝐱 𝐑𝐚𝐭𝐞: 26% - 28% Stable. In line with the normalized rate realized throughout FY25. Excludes potential future legislative changes. 𝐊𝐞𝐲 𝐐𝐮𝐞𝐬𝐭𝐢𝐨𝐧𝐬 𝐌𝐚𝐫𝐤𝐞𝐭𝐢𝐧𝐠 𝐒𝐩𝐞𝐧𝐝 𝐓𝐫𝐚𝐣𝐞𝐜𝐭𝐨𝐫𝐲 You absorbed a 15 bps EBITDA margin contraction this quarter due to FX and marketing investments. As we head into the FIFA World Cup, should we expect SG&A to remain elevated, keeping EBITDA margins flat or slightly down for the remainder of the year? 𝐂𝐡𝐢𝐧𝐚 𝐑𝐞𝐬𝐭𝐫𝐮𝐜𝐭𝐮𝐫𝐢𝐧𝐠 𝐂𝐨𝐬𝐭𝐬 EBITDA in China fell 11.8% as you invested heavily in the in-home channel and lowered prices. How long is this transition phase expected to last before we see a return to positive operating leverage in APAC? 𝐔𝐒 𝐒𝐓𝐖 𝐯𝐬 𝐒𝐓𝐑 𝐂𝐨𝐧𝐯𝐞𝐫𝐠𝐞𝐧𝐜𝐞 In North America, STWs lagged STRs by 350 basis points. You mentioned this should converge over the full year—does this imply a massive catch-up in wholesale shipments expected in Q2 ahead of the summer season? 𝐁𝐄𝐄𝐒 𝐌𝐚𝐫𝐤𝐞𝐭𝐩𝐥𝐚𝐜𝐞 𝐏𝐫𝐨𝐟𝐢𝐭𝐚𝐛𝐢𝐥𝐢𝐭𝐲 With BEES Marketplace GMV up 55% to $1.1 billion, what is the margin profile of this third-party product revenue today compared to your core beer portfolio, and how is it impacting consolidated EBITDA?
Finsee tweet media
English
0
0
1
356
JJJ
JJJ@9999_9n·
good summary
Finsee@Finsee_main

$TDW Q1 2026 earnings: Top-Line Contraction and Middle East Squeeze Expose Near-Term Vulnerabilities Despite management declaring Q1 'exceeded expectations,' the numbers paint a more sobering picture. Tidewater experienced a Reversing trend in revenue, declining 2.2% YoY, marking a break from its multi-year growth narrative. While day rates proved surprisingly resilient and even ticked up sequentially to $22,283, the bottom line deteriorated rapidly. Net Income collapsed to $6.1M from $42.7M a year ago, driven heavily by an Operation Epic Fury-induced margin squeeze in the Middle East and a 19% sales plunge in West Africa. Management is banking heavily on a back-half recovery and the impending Wilson Sons Ultratug integration to hit their reiterated FY26 guidance. For now, the promised offshore upcycle is facing stiff macro headwinds. Full article with charts - link in bio 🐂 𝐁𝐮𝐥𝐥 𝐂𝐚𝐬𝐞 • 𝐏𝐫𝐢𝐜𝐢𝐧𝐠 𝐏𝐨𝐰𝐞𝐫 𝐇𝐨𝐥𝐝𝐬 𝐢𝐧 𝐚 𝐖𝐞𝐚𝐤 𝐐𝐮𝐚𝐫𝐭𝐞𝐫 — Historically, Q1 is the most challenging seasonal quarter. Yet, Tidewater grew its average day rate by nearly $240 sequentially. Term contract fixtures reached an inflection point, pushing the weighted average up for the first time in a year. • 𝐌&𝐀 𝐂𝐚𝐭𝐚𝐥𝐲𝐬𝐭 𝐈𝐦𝐦𝐢𝐧𝐞𝐧𝐭 — The acquisition of the 22-vessel Wilson Sons Ultratug fleet is scheduled to close in Q2, exclusively targeting the high-demand Brazilian PSV market and providing an immediate top-line injection. 🐻 𝐁𝐞𝐚𝐫 𝐂𝐚𝐬𝐞 • 𝐒𝐞𝐯𝐞𝐫𝐞 𝐂𝐚𝐬𝐡 𝐅𝐥𝐨𝐰 𝐂𝐨𝐧𝐭𝐫𝐚𝐜𝐭𝐢𝐨𝐧 — Operating Cash Flow fell off a cliff, dropping 76% YoY from $80.4M to just $19.2M, driven by massive working capital drains and elevated deferred drydocking and survey costs. • 𝐖𝐞𝐬𝐭 𝐀𝐟𝐫𝐢𝐜𝐚 𝐃𝐞𝐭𝐞𝐫𝐢𝐨𝐫𝐚𝐭𝐢𝐨𝐧 — West Africa, historically a massive profit engine for Tidewater, is Decelerating rapidly. Vessel revenues dropped 19% YoY, and segment operating profit plummeted nearly 28%. ⚖️ 𝐕𝐞𝐫𝐝𝐢𝐜𝐭: ⚪ Neutral. The long-term structural deficit of OSV vessels remains intact, but near-term execution is rocky. Investors are paying upcycle multiples, yet Tidewater is currently delivering contracting revenues and compressed free cash flow. 𝐊𝐞𝐲 𝐓𝐡𝐞𝐦𝐞𝐬 🔴 𝐌𝐢𝐝𝐝𝐥𝐞 𝐄𝐚𝐬𝐭 𝐂𝐨𝐧𝐟𝐥𝐢𝐜𝐭 𝐒𝐪𝐮𝐞𝐞𝐳𝐞𝐬 𝐌𝐚𝐫𝐠𝐢𝐧𝐬 [NEW] Operation Epic Fury has materially altered unit economics in the Middle East. While regional vessel revenues grew 5% YoY to $45.6M, operating profit actually reversed, dropping 23% YoY to $6.6M. Management cited elevated insurance and crew costs, explicitly warning this pressure will persist until the conflict resolves. This highlights the vulnerability of the operating model to localized geopolitical friction. 🔴 𝐖𝐞𝐬𝐭 𝐀𝐟𝐫𝐢𝐜𝐚 𝐢𝐧 𝐒𝐞𝐜𝐮𝐥𝐚𝐫 𝐃𝐞𝐜𝐥𝐢𝐧𝐞 West Africa is Decelerating at an alarming rate. It was Tidewater's largest revenue contributor a year ago ($106.1M, 32% of total). Today, it generated only $85.8M (27% of total), trailing Europe/Med. The active vessel count in the region dropped from 65 to 53 YoY, driving utilization down from 75% to 85.5% (on a smaller base). This structural shrinkage requires immediate redeployment strategies. 🔴 𝐓𝐡𝐞 '𝐄𝐱𝐜𝐞𝐞𝐝𝐢𝐧𝐠 𝐄𝐱𝐩𝐞𝐜𝐭𝐚𝐭𝐢𝐨𝐧𝐬' 𝐂𝐨𝐧𝐭𝐫𝐚𝐝𝐢𝐜𝐭𝐢𝐨𝐧 [NEW] CEO Quintin Kneen stated the quarter 'exceeded our expectations across all key financial and operational measures.' However, hard data contradicts this rosy narrative. Operating Cash Flow reversed from $80.4M in 25Q1 to $19.2M in 26Q1. Accounts payable dropped while deferred drydocking cash outlays consumed $36.4M. Cash burn is real, making the 'outperformance' claim suspect when looking at the balance sheet. 🟢 𝐒𝐭𝐫𝐮𝐜𝐭𝐮𝐫𝐚𝐥 𝐒𝐪𝐮𝐞𝐞𝐳𝐞 𝐢𝐧 𝐭𝐡𝐞 𝐍𝐨𝐫𝐭𝐡 𝐒𝐞𝐚 𝐀𝐇𝐓𝐒 𝐌𝐚𝐫𝐤𝐞𝐭 A key technological and asset-class driver emerged in high-spec AHTS (Anchor Handling Towing Supply) vessels. The North Sea market tightened earlier than normal due to rigs mobilizing for new projects and a hard cap on vessel supply. This specific asset class drove the sequential day rate improvement of ~$240/day across the fleet, proving that complex, high-spec assets command outsized pricing power when supply inelasticity bites. 🟢 𝐖𝐢𝐥𝐬𝐨𝐧 𝐒𝐨𝐧𝐬 𝐔𝐥𝐭𝐫𝐚𝐭𝐮𝐠 𝐈𝐧𝐭𝐞𝐠𝐫𝐚𝐭𝐢𝐨𝐧 [NEW] The acquisition of Wilson Sons Ultratug gives Tidewater 22 PSVs entirely locked into the Brazilian offshore market. With Petrobras aggressively tendering, this moves Tidewater deeper into a region characterized by long-term contracts and high demand density. Expected to close by Q2, this is the primary mechanical driver for achieving their FY26 revenue guidance. 🟢 𝐌𝐚𝐜𝐫𝐨 𝐏𝐢𝐜𝐭𝐮𝐫𝐞: 𝐄𝐧𝐞𝐫𝐠𝐲 𝐒𝐞𝐜𝐮𝐫𝐢𝐭𝐲 𝐎𝐮𝐭𝐰𝐞𝐢𝐠𝐡𝐬 𝐍𝐞𝐚𝐫-𝐓𝐞𝐫𝐦 𝐒𝐨𝐟𝐭𝐧𝐞𝐬𝐬 Management laid out a clear macro thesis: the global energy equation is being fundamentally reshaped. Despite Middle East conflict friction, the drive for localized energy security and the imperative to replace depleted inventories is creating incremental, structural demand that overrides short-term day rate stagnation. They anticipate this will support commodity prices and sustain offshore activity well into 2027. 𝐎𝐭𝐡𝐞𝐫 𝐊𝐏𝐈𝐬 𝐀𝐯𝐞𝐫𝐚𝐠𝐞 𝐃𝐚𝐲 𝐑𝐚𝐭𝐞: $22,283 Stable YoY, but importantly, Accelerating sequentially from $22,044 in 25Q4. Achieving sequential day rate growth during Q1 (typically the industry's weakest seasonal quarter) validates the underlying tightness of the global vessel market, even as overall revenues slightly declined. 𝐅𝐫𝐞𝐞 𝐂𝐚𝐬𝐡 𝐅𝐥𝐨𝐰: $34.4 million Decelerating drastically from $94.7M in 25Q1 and $151.2M in 25Q4. The plunge was driven by working capital swings (a $14.3M build in receivables) and heavy cash outflows for deferred drydocking ($36.4M). This limits immediate dry powder for their $500M buyback program without tapping into reserves. 𝐆𝐮𝐢𝐝𝐚𝐧𝐜𝐞 𝐅𝐘𝟐𝟔 𝐑𝐞𝐯𝐞𝐧𝐮𝐞: $1.43 to $1.48 billion Accelerating. The midpoint of $1.455B implies roughly 7.5% YoY growth compared to FY25's $1.35B. Given that 26Q1 revenue was negative YoY (-2.2%), hitting this guidance requires aggressive, back-half weighted growth, primarily fueled by the Wilson Sons Ultratug acquisition integration. 𝐅𝐘𝟐𝟔 𝐆𝐫𝐨𝐬𝐬 𝐌𝐚𝐫𝐠𝐢𝐧: 49% to 51% Stable to slightly Accelerating. The midpoint of 50% compares favorably to Q1's actual vessel operating margin of 48.6%. To achieve this, Tidewater will need day rates to push higher to offset the newly elevated operating costs in the Middle East and inflationary pressures on crews. 𝐊𝐞𝐲 𝐐𝐮𝐞𝐬𝐭𝐢𝐨𝐧𝐬 𝐖𝐞𝐬𝐭 𝐀𝐟𝐫𝐢𝐜𝐚 𝐀𝐭𝐭𝐫𝐢𝐭𝐢𝐨𝐧 Vessel revenues in West Africa declined 19% YoY. Is this a permanent structural downshift due to lack of drilling demand, or do you expect active vessel counts to rebound in the region during the second half of 2026? 𝐌𝐢𝐝𝐝𝐥𝐞 𝐄𝐚𝐬𝐭 𝐂𝐨𝐬𝐭 𝐍𝐨𝐫𝐦𝐚𝐥𝐢𝐳𝐚𝐭𝐢𝐨𝐧 You explicitly noted higher costs for insurance and crews due to Operation Epic Fury. What is the exact quarterly dollar impact of these elevated costs, and are you able to build conflict-risk premiums into upcoming contract renewals to protect margins? 𝐁𝐮𝐲𝐛𝐚𝐜𝐤 𝐕𝐢𝐚𝐛𝐢𝐥𝐢𝐭𝐲 𝐚𝐦𝐢𝐝 𝐅𝐂𝐅 𝐂𝐨𝐧𝐭𝐫𝐚𝐜𝐭𝐢𝐨𝐧 Operating Cash Flow was severely hampered this quarter by working capital and drydocking costs. Does this near-term cash flow reality push out the timeline for executing the $500M share repurchase authorization?

English
1
0
1
50
Finsee
Finsee@Finsee_main·
$MFA Q1 2026 earnings: GAAP Losses Eclipse Distributable Earnings Recovery MFA Financial broke its 2025 profitability streak, posting an $11.4M GAAP net loss in 26Q1. A massive $73M combined mark-to-market and impairment hit on whole loans and securities obliterated the bottom line. Management is attempting to steer attention toward Distributable Earnings (DE), which accelerated to $0.30 per share, and even introduced a new non-GAAP metric ('DE prior to realized credit losses') to further smooth out the noise. However, the underlying metrics flash warning signs: economic book value dropped to $13.22, net interest spreads compressed to 1.64%, and delinquencies spiked to 7.8%. While the portfolio grew past $12.5B, the quality of earnings is deteriorating. Full article with charts - link in bio 🐂 𝐁𝐮𝐥𝐥 𝐂𝐚𝐬𝐞 • 𝐃𝐢𝐬𝐭𝐫𝐢𝐛𝐮𝐭𝐚𝐛𝐥𝐞 𝐄𝐚𝐫𝐧𝐢𝐧𝐠𝐬 𝐑𝐞𝐜𝐨𝐯𝐞𝐫𝐲 — Core operating earnings are accelerating. Distributable Earnings jumped sequentially from $28.2M to $31.1M ($0.30/share), providing solid coverage for the $0.36 dividend when excluding realized credit losses. • 𝐀𝐠𝐠𝐫𝐞𝐬𝐬𝐢𝐯𝐞 𝐂𝐚𝐩𝐢𝐭𝐚𝐥 𝐃𝐞𝐩𝐥𝐨𝐲𝐦𝐞𝐧𝐭 — Management successfully deployed capital, acquiring over $1B in residential mortgage assets during the quarter, including $393M in Agency MBS and $471M in Non-QM loans, positioning the balance sheet for future interest income growth. 🐻 𝐁𝐞𝐚𝐫 𝐂𝐚𝐬𝐞 • 𝐁𝐨𝐨𝐤 𝐕𝐚𝐥𝐮𝐞 𝐃𝐞𝐬𝐭𝐫𝐮𝐜𝐭𝐢𝐨𝐧 — The $73M hit from fair value adjustments and impairments drove Economic Book Value down from $13.75 in 25Q4 to $13.22 in 26Q1. Shareholders are losing underlying equity value. • 𝐏𝐫𝐨𝐟𝐢𝐭𝐥𝐞𝐬𝐬 𝐆𝐫𝐨𝐰𝐭𝐡 𝐚𝐭 𝐋𝐢𝐦𝐚 𝐎𝐧𝐞 — Despite management touting a 34% surge in Lima One's mortgage banking income, the segment actually swung to a $3.4M net loss. The origination volume is currently destroying bottom-line value. ⚖️ 𝐕𝐞𝐫𝐝𝐢𝐜𝐭: 🔴 Bearish. Management is introducing new adjusted metrics to mask the GAAP losses, but the underlying reality shows shrinking book value, compressing spreads, rising delinquencies, and a growth segment (Lima One) that is bleeding cash. 𝐊𝐞𝐲 𝐓𝐡𝐞𝐦𝐞𝐬 🔴 𝐏𝐫𝐨𝐟𝐢𝐭𝐥𝐞𝐬𝐬 𝐆𝐫𝐨𝐰𝐭𝐡 𝐚𝐭 𝐋𝐢𝐦𝐚 𝐎𝐧𝐞 [NEW] Management praised Lima One's top-line performance, citing a 34% QoQ jump in mortgage banking income to $7.7M and an origination pipeline at its highest level since 2024. However, looking at the segment table reveals a Reversing trend in profitability: Lima One's net income collapsed from an $8.8M profit in 25Q2 to a $(3.4)M loss in 26Q1. The top-line growth narrative is entirely contradicted by the bottom-line reality, indicating severe expense bloat or poor unit economics in the current origination environment. 🔴 𝐑𝐞𝐥𝐞𝐧𝐭𝐥𝐞𝐬𝐬 𝐍𝐞𝐭 𝐈𝐧𝐭𝐞𝐫𝐞𝐬𝐭 𝐒𝐩𝐫𝐞𝐚𝐝 𝐂𝐨𝐦𝐩𝐫𝐞𝐬𝐬𝐢𝐨𝐧 Net interest spread has been steadily Decelerating over the past year. After peaking at 1.98% in 25Q2, the total balance sheet net interest spread compressed to 1.69% in 25Q4 and squeezed further to 1.64% in 26Q1. Despite the macro environment stabilizing, MFA's cost of funding (-4.84%) is not falling fast enough to offset the drop in net yields (6.08%), severely pressuring core earning power. 🔴 𝐃𝐞𝐥𝐢𝐧𝐪𝐮𝐞𝐧𝐜𝐢𝐞𝐬 𝐒𝐩𝐢𝐤𝐞 𝐇𝐢𝐠𝐡𝐞𝐫 After trending down nicely to 6.8% in 25Q3, 60+ day delinquencies for the residential loan portfolio Reversed course, climbing to 7.1% in 25Q4 and jumping to 7.8% in 26Q1. While management noted a slight post-quarter decline to 7.3%, the concentration of stress in the Multifamily transitional portfolio (30% 60+ DQ rate) remains a massive drag on capital. 🟢 𝐅𝐢𝐧𝐚𝐧𝐜𝐢𝐚𝐥 𝐈𝐧𝐧𝐨𝐯𝐚𝐭𝐢𝐨𝐧: 𝐌𝐨𝐯𝐢𝐧𝐠 𝐭𝐡𝐞 𝐆𝐨𝐚𝐥𝐩𝐨𝐬𝐭𝐬 [NEW] Faced with GAAP losses and volatile standard Distributable Earnings, MFA introduced a new non-GAAP metric this quarter: 'Distributable earnings prior to realized credit losses.' By stripping out the $4.4M in realized credit losses from loan resolutions, this new metric Accelerating to $35.5M ($0.34/share) makes the $0.36 dividend look highly sustainable. While it helps filter out legacy runoff noise, investors must remember that realized credit losses are a real cost of doing business, not just an accounting anomaly. 🟢 𝐀𝐠𝐠𝐫𝐞𝐬𝐬𝐢𝐯𝐞 𝐏𝐨𝐫𝐭𝐟𝐨𝐥𝐢𝐨 𝐀𝐜𝐪𝐮𝐢𝐬𝐢𝐭𝐢𝐨𝐧 𝐒𝐭𝐫𝐚𝐭𝐞𝐠𝐲 MFA is not sitting on its hands. The company Accelerating its capital deployment, acquiring over $1B in residential mortgage assets during Q1. This included $392.8M of Agency MBS and $470.6M of Non-QM loans. The total residential investment portfolio grew sequentially from $12.3B to $12.5B, successfully replacing the $698M in portfolio runoff and setting up a larger base for future interest income. 🟢 𝐀𝐜𝐜𝐫𝐞𝐭𝐢𝐯𝐞 𝐂𝐚𝐩𝐢𝐭𝐚𝐥 𝐑𝐞𝐭𝐮𝐫𝐧𝐬 MFA's capital allocation remains disciplined and shareholder-friendly. The company repurchased another 500,000 shares of common stock at accretive levels (well below economic book value) and continued to pay its $0.36 quarterly dividend. A newly announced Manhattan office relocation is also expected to save $4M annually, providing a minor structural boost to run-rate expenses. 𝐎𝐭𝐡𝐞𝐫 𝐊𝐏𝐈𝐬 𝐄𝐜𝐨𝐧𝐨𝐦𝐢𝐜 𝐁𝐨𝐨𝐤 𝐕𝐚𝐥𝐮𝐞 𝐏𝐞𝐫 𝐒𝐡𝐚𝐫𝐞: $13.22 Decelerating sharply from $13.75 in 25Q4 and $13.84 a year ago. The decline was heavily driven by the $38.3M impairment and net loss on securities and the $34.8M fair value loss on residential whole loans. Management's aggressive asset purchases have yet to stem the bleeding on the balance sheet's underlying valuation. 𝐍𝐞𝐭 𝐈𝐧𝐭𝐞𝐫𝐞𝐬𝐭 𝐈𝐧𝐜𝐨𝐦𝐞: $59.2 million Accelerating sequentially. Up from $55.5M in 25Q4 and higher than the $57.5M reported in 25Q1. Despite the spread compression, the absolute dollar growth in the portfolio base is successfully driving higher net interest dollars. 𝐆𝐮𝐢𝐝𝐚𝐧𝐜𝐞 𝐎𝐩𝐞𝐫𝐚𝐭𝐢𝐧𝐠 𝐄𝐱𝐩𝐞𝐧𝐬𝐞𝐬 (𝐆&𝐀): $4 million annual savings Stable. The company announced a Manhattan office relocation that will yield $4M in annual savings. While positive, it represents a minor fraction of the ~$48M annualized general and administrative expense run-rate. 𝐊𝐞𝐲 𝐐𝐮𝐞𝐬𝐭𝐢𝐨𝐧𝐬 𝐋𝐢𝐦𝐚 𝐎𝐧𝐞 𝐏𝐫𝐨𝐟𝐢𝐭𝐚𝐛𝐢𝐥𝐢𝐭𝐲 𝐃𝐢𝐬𝐜𝐨𝐧𝐧𝐞𝐜𝐭 Mortgage banking income at Lima One grew 34% sequentially, yet the segment swung to a $3.4M net loss. What is driving the severe margin compression or expense bloat within the origination platform, and when will volume actually translate to bottom-line profit? 𝐒𝐞𝐜𝐮𝐫𝐢𝐭𝐢𝐞𝐬 𝐈𝐦𝐩𝐚𝐢𝐫𝐦𝐞𝐧𝐭 𝐃𝐫𝐢𝐯𝐞𝐫𝐬 You recorded a massive $38.3M impairment and net loss on securities this quarter. Given the relatively stable macro and rate environment in Q1 compared to previous quarters, what specific assets drove this hit? 𝐃𝐢𝐯𝐢𝐝𝐞𝐧𝐝 𝐏𝐨𝐥𝐢𝐜𝐲 𝐯𝐬 𝐍𝐞𝐰 𝐌𝐞𝐭𝐫𝐢𝐜𝐬 You introduced 'Distributable earnings prior to realized credit losses' this quarter, which came in at $0.34—very close to the $0.36 dividend. Will the board primarily rely on this new metric rather than standard DE when evaluating future dividend levels? 𝐌𝐮𝐥𝐭𝐢𝐟𝐚𝐦𝐢𝐥𝐲 𝐓𝐫𝐚𝐧𝐬𝐢𝐭𝐢𝐨𝐧𝐚𝐥 𝐃𝐞𝐥𝐢𝐧𝐪𝐮𝐞𝐧𝐜𝐢𝐞𝐬 The Multifamily transitional loan portfolio has a staggering 30% 60+ day delinquency rate. What is the timeline for fully resolving these toxic assets, and how much further capital do you expect to be tied up or written down in this specific bucket?
Finsee tweet media
English
0
0
0
319
Finsee
Finsee@Finsee_main·
$BALL Q1 2026 earnings: Price Pass-Throughs Drive Top Line, But Volume Stagnates Ball Corporation delivered a strong bottom line in 25Q1, with comparable diluted EPS surging 22.1% YoY to $0.94. Revenue grew 16.3% YoY, but this masks a significant underlying weakness: global volume grew a mere 0.8%. The massive revenue jump is almost entirely driven by pass-through pricing tied to higher aluminum costs and tariffs. While the newly acquired Benepack facilities boosted EMEA, South American volumes are reversing. Management reiterated FY26 guidance of 10-plus percent EPS growth, but the deteriorating volume trajectory warrants caution. Full article with charts - link in bio 🐂 𝐁𝐮𝐥𝐥 𝐂𝐚𝐬𝐞 • 𝐄𝐌𝐄𝐀 𝐒𝐞𝐠𝐦𝐞𝐧𝐭 𝐎𝐮𝐭𝐩𝐞𝐫𝐟𝐨𝐫𝐦𝐚𝐧𝐜𝐞 — EMEA comparable operating earnings accelerated, up 20.7% YoY, bolstered by the January 2026 integration of Benepack facilities in Belgium and Hungary. Volume and pricing power remain intact here. • 𝐎𝐩𝐞𝐫𝐚𝐭𝐢𝐨𝐧𝐚𝐥 𝐋𝐞𝐯𝐞𝐫𝐚𝐠𝐞 — Despite severe cost pressures in North America, company-wide comparable operating earnings grew 9.9% to $387 million. The Ball Business System is successfully extracting efficiencies. 🐻 𝐁𝐞𝐚𝐫 𝐂𝐚𝐬𝐞 • 𝐀𝐧𝐞𝐦𝐢𝐜 𝐆𝐥𝐨𝐛𝐚𝐥 𝐕𝐨𝐥𝐮𝐦𝐞 — Volume growth is decelerating sharply. After hitting 6.0% YoY growth in 25Q4, Q1 global shipments grew just 0.8%. Stripping out the EMEA acquisition, organic growth is likely flat to negative. • 𝐍𝐨𝐫𝐭𝐡 𝐀𝐦𝐞𝐫𝐢𝐜𝐚𝐧 𝐌𝐚𝐫𝐠𝐢𝐧 𝐂𝐫𝐮𝐬𝐡 — NA segment sales surged 21.4% YoY, but comparable operating earnings grew a meager 2.5%. Pass-through costs inflate the top line while devastating percentage margins. ⚖️ 𝐕𝐞𝐫𝐝𝐢𝐜𝐭: ⚪ Neutral. Management is executing exceptionally well on cost control and EPS optimization, but a 0.8% global volume print reveals an industry hitting an affordability wall. The revenue beat is low-quality. 𝐊𝐞𝐲 𝐓𝐡𝐞𝐦𝐞𝐬 🔴 𝐒𝐨𝐮𝐭𝐡 𝐀𝐦𝐞𝐫𝐢𝐜𝐚 𝐑𝐞𝐯𝐞𝐫𝐬𝐢𝐧𝐠 𝐟𝐫𝐨𝐦 𝐆𝐫𝐨𝐰𝐭𝐡 𝐭𝐨 𝐂𝐨𝐧𝐭𝐫𝐚𝐜𝐭𝐢𝐨𝐧 [NEW] This is a direct contradiction to management's positive narrative from the end of FY25. After finishing FY25 with 4.2% volume growth and claims of ongoing momentum, 26Q1 South America volume reversed sharply, dropping mid-single digits. Despite a 7.5% revenue increase, comparable operating earnings were completely flat at $67 million. This signals severe demand elasticity issues in the region. 🔴 𝐍𝐨𝐫𝐭𝐡 𝐀𝐦𝐞𝐫𝐢𝐜𝐚 𝐌𝐚𝐫𝐠𝐢𝐧 𝐂𝐨𝐦𝐩𝐫𝐞𝐬𝐬𝐢𝐨𝐧 North American margins are under intense pressure. Segment revenue exploded by 21.4% YoY (from $1.46B to $1.78B), but operating profit increased by only $5 million (+2.5%). This represents a severe margin compression from 13.7% in 25Q1 to 11.5% in 26Q1. The combination of higher aluminum prices and domesticating ends production is taking a toll on profitability. 🔴 𝐓𝐚𝐫𝐢𝐟𝐟𝐬 𝐚𝐧𝐝 𝐌𝐚𝐜𝐫𝐨 𝐏𝐚𝐬𝐬-𝐓𝐡𝐫𝐨𝐮𝐠𝐡 𝐃𝐢𝐬𝐭𝐨𝐫𝐭𝐢𝐨𝐧 The massive top-line beats are illusory. The 16.3% global sales growth is almost entirely driven by the pass-through of elevated aluminum prices and Section 232 tariffs. While Ball's contracts protect absolute dollar profits, the required price hikes to end-consumers are accelerating demand destruction, evident in the 0.8% global volume print. 🟢 𝐁𝐞𝐧𝐞𝐩𝐚𝐜𝐤 𝐈𝐧𝐭𝐞𝐠𝐫𝐚𝐭𝐢𝐨𝐧 𝐅𝐮𝐞𝐥𝐢𝐧𝐠 𝐄𝐌𝐄𝐀 [NEW] The January 2026 acquisition of Benepack facilities in Belgium and Hungary is already paying off. EMEA comparable operating earnings jumped 20.7% YoY on a 16.0% revenue increase. This acquisition provides much-needed capacity in a region that is successfully taking market share from glass substrates. 🟢 𝐁𝐚𝐥𝐥 𝐁𝐮𝐬𝐢𝐧𝐞𝐬𝐬 𝐒𝐲𝐬𝐭𝐞𝐦 𝐒𝐭𝐚𝐛𝐢𝐥𝐢𝐳𝐢𝐧𝐠 𝐄𝐚𝐫𝐧𝐢𝐧𝐠𝐬 Management's aggressive rollout of the Ball Business System (an operational efficiency and standardization technology) is successfully insulating the bottom line from volume weakness. The framework helped extract a 9.9% increase in global comparable operating earnings despite macro headwinds. 🟢 𝐒𝐮𝐬𝐭𝐚𝐢𝐧𝐞𝐝 𝐂𝐚𝐩𝐢𝐭𝐚𝐥 𝐑𝐞𝐭𝐮𝐫𝐧 𝐄𝐱𝐞𝐜𝐮𝐭𝐢𝐨𝐧 The commitment to shareholder returns remains a core driver for EPS. Management confirmed the company is on track to return at least $800 million to shareholders by the end of 2026, creating a mathematical floor for the guided 10-plus percent EPS growth algorithm. 𝐎𝐭𝐡𝐞𝐫 𝐊𝐏𝐈𝐬 𝐎𝐩𝐞𝐫𝐚𝐭𝐢𝐧𝐠 𝐂𝐚𝐬𝐡 𝐅𝐥𝐨𝐰 𝐯𝐬 𝐍𝐞𝐭 𝐈𝐧𝐜𝐨𝐦𝐞 (𝟐𝟔𝐐𝟏): -$777 million OCF Red flag: Operating Cash Flow is moving aggressively opposite to Net Income. While GAAP Net Income was positive $205M, operating cash flow burned $777M. This was driven by a staggering $1.15B working capital drag. Inventories spiked from $1.64B to $2.22B YoY, and Receivables jumped to $2.90B. While Q1 is historically a cash-burn quarter for inventory build-up, the sheer magnitude is vastly amplified by skyrocketing aluminum costs. 𝐒𝐡𝐚𝐫𝐞 𝐑𝐞𝐩𝐮𝐫𝐜𝐡𝐚𝐬𝐞𝐬 (𝟐𝟔𝐐𝟏): $1 million Decelerating violently. In Q1 2025, Ball repurchased $555 million in treasury stock. In Q1 2026, this number fell to just $1 million. While management maintains guidance for $800M+ in total shareholder returns for the year, the sudden halt in Q1 buybacks suggests aggressive cash preservation in the face of working capital spikes. 𝐆𝐮𝐢𝐝𝐚𝐧𝐜𝐞 𝐅𝐘𝟐𝟔 𝐂𝐨𝐦𝐩𝐚𝐫𝐚𝐛𝐥𝐞 𝐃𝐢𝐥𝐮𝐭𝐞𝐝 𝐄𝐏𝐒 𝐆𝐫𝐨𝐰𝐭𝐡: 10-plus percent Stable. Management reiterated their long-term algorithm. While the Q1 delivery of 22.1% growth was exceptional, maintaining the 10%+ floor implies they expect EPS growth to decelerate slightly through the rest of the year as the Millersburg start-up costs begin hitting in the second half. 𝐅𝐘𝟐𝟔 𝐅𝐫𝐞𝐞 𝐂𝐚𝐬𝐡 𝐅𝐥𝐨𝐰: Greater than $900 million Accelerating. Implies a robust recovery from the $788 million generated in FY25. However, overcoming the $938 million Q1 FCF hole will require massive cash generation from operations in Q3 and Q4, hinging completely on working capital unwinding. 𝐊𝐞𝐲 𝐐𝐮𝐞𝐬𝐭𝐢𝐨𝐧𝐬 𝐒𝐨𝐮𝐭𝐡 𝐀𝐦𝐞𝐫𝐢𝐜𝐚 𝐕𝐨𝐥𝐮𝐦𝐞 𝐂𝐨𝐥𝐥𝐚𝐩𝐬𝐞 Volume in South America dropped mid-single digits this quarter, directly contradicting the recovery momentum highlighted at the end of FY25. Is this demand destruction from local inflation, or are we losing share to returnable glass? 𝐓𝐡𝐞 𝐐𝟏 𝐁𝐮𝐲𝐛𝐚𝐜𝐤 𝐇𝐢𝐚𝐭𝐮𝐬 You guided to at least $800 million in shareholder returns for FY26, yet share repurchases were essentially zero in Q1 compared to $555M last year. Was this cash preservation due to the $1.15 billion working capital build? 𝐍𝐨𝐫𝐭𝐡 𝐀𝐦𝐞𝐫𝐢𝐜𝐚 𝐌𝐚𝐫𝐠𝐢𝐧 𝐓𝐫𝐨𝐮𝐠𝐡 With NA margins dropping over 200 basis points year-over-year despite 21% revenue growth, when do you expect the pricing mechanisms to catch up to the cost-to-serve and tariff headwinds to stabilize the margin floor?
Finsee tweet media
English
0
0
1
438
Finsee
Finsee@Finsee_main·
$ULCC Q1 2026 earnings: Record Revenues Eclipsed by Runaway Costs and a Fuel Crisis Frontier delivered an all-time record first quarter for adjusted revenue ($1.06 billion, up 17% YoY) by successfully driving higher fares and premium ancillary attachment. However, this top-line victory failed to reach the bottom line. Adjusted Net Loss widened to $68 million as the cost structure deteriorated severely. Adjusted CASM excluding fuel skyrocketed 22% due to depressed aircraft utilization, and jet fuel prices jumped 13%. More alarming is the Q2 outlook: despite guiding for unit revenue growth above 20%, an extreme spike in estimated jet fuel costs to $4.25 per gallon is forcing management to forecast a devastating loss of $0.45 to $0.60 per share. Full article with charts - link in bio 🐂 𝐁𝐮𝐥𝐥 𝐂𝐚𝐬𝐞 • 𝐂𝐨𝐦𝐦𝐞𝐫𝐜𝐢𝐚𝐥 𝐒𝐭𝐫𝐚𝐭𝐞𝐠𝐲 𝐢𝐬 𝐖𝐨𝐫𝐤𝐢𝐧𝐠 — Adjusted unit revenue (stage-length adjusted RASM) grew 17% YoY. Frontier has successfully transitioned back to pricing power, proving its premium bundling and capacity discipline can force passengers to pay more. • 𝐃𝐞𝐜𝐢𝐬𝐢𝐯𝐞 𝐅𝐥𝐞𝐞𝐭 𝐑𝐞𝐬𝐭𝐫𝐮𝐜𝐭𝐮𝐫𝐢𝐧𝐠 — By taking a $139 million hit to return 24 excess A320neo aircraft, management is artificially forcing supply down to meet demand. This necessary amputation will mechanically push daily aircraft utilization back to profitable levels. 🐻 𝐁𝐞𝐚𝐫 𝐂𝐚𝐬𝐞 • 𝐅𝐢𝐱𝐞𝐝 𝐂𝐨𝐬𝐭 𝐃𝐞-𝐋𝐞𝐯𝐞𝐫𝐚𝐠𝐞 — The consequence of cutting capacity to boost fares is idle metal. Daily utilization dropped to 8.5 hours, inflating adjusted CASM ex-fuel by 22%. The ultra-low-cost model mathematically breaks when planes sit on the tarmac. • 𝐄𝐱𝐨𝐠𝐞𝐧𝐨𝐮𝐬 𝐅𝐮𝐞𝐥 𝐒𝐡𝐨𝐜𝐤 — Frontier guides Q2 fuel costs at an eye-watering $4.25 per gallon. This massive macro headwind makes profitability mathematically impossible in the near term, regardless of how fast revenues grow. ⚖️ 𝐕𝐞𝐫𝐝𝐢𝐜𝐭: 🔴 Bearish. Management deserves credit for fixing the revenue problem, but an airline cannot survive on top-line growth alone. Stripping out the exogenous fuel shock, Frontier's core unit costs excluding fuel are blowing out due to under-utilized assets. Until the fleet reduction translates into a normalized cost structure, the stock remains highly vulnerable. 𝐊𝐞𝐲 𝐓𝐡𝐞𝐦𝐞𝐬 🟢 𝐔𝐧𝐢𝐭 𝐑𝐞𝐯𝐞𝐧𝐮𝐞𝐬 𝐀𝐫𝐞 𝐒𝐮𝐫𝐠𝐢𝐧𝐠 Adjusted Revenue per Available Seat Mile (RASM) is Accelerating. It jumped 18% to 10.86 cents in Q1, driven by a 1% capacity reduction, strong travel demand, and mature revenue management initiatives. Better still, management guides for over 20% growth in Q2. Frontier's strategy to cut unprofitable off-peak flying and rely on premium bundles is clearly paying off. 🔴🔴 𝐅𝐢𝐱𝐞𝐝 𝐂𝐨𝐬𝐭𝐬 𝐀𝐫𝐞 𝐂𝐫𝐮𝐬𝐡𝐢𝐧𝐠 𝐌𝐚𝐫𝐠𝐢𝐧𝐬 Despite record revenues, Adjusted CASM ex-fuel (unit cost excluding fuel) skyrocketed 22% YoY to 8.85 cents. This contradicts the positive top-line narrative. By cutting capacity to boost fares, Frontier tanked its daily aircraft utilization by 12% (down to 8.5 hours). This structural inefficiency proves the low-cost carrier model struggles to scale down gracefully. 🔴 𝐌𝐚𝐜𝐫𝐨 𝐇𝐞𝐚𝐝𝐰𝐢𝐧𝐝: 𝐓𝐡𝐞 𝐅𝐮𝐞𝐥 𝐒𝐡𝐨𝐜𝐤 [NEW] Fuel expenses are Accelerating rapidly. After paying $2.88 per gallon in Q1 (up 13% YoY), management dropped a bombshell: Q2 fuel costs will average $4.25 per gallon. This exogenous macro shock fundamentally breaks the near-term economic model and is the primary reason Q2 earnings guidance points to a steep, accelerated loss. 🟢 𝐑𝐢𝐠𝐡𝐭𝐬𝐢𝐳𝐢𝐧𝐠 𝐭𝐡𝐞 𝐅𝐥𝐞𝐞𝐭 𝐭𝐨 𝐅𝐨𝐫𝐜𝐞 𝐔𝐭𝐢𝐥𝐢𝐳𝐚𝐭𝐢𝐨𝐧 [NEW] Frontier executed early lease terminations for 24 A320neo aircraft, taking a $139M charge to clear out excess capacity. This move is intended to be Reversing the dangerous trend of under-utilizing planes. By shedding excess metal in Q2, Frontier aims to aggressively push daily utilization back up across a smaller fleet, which is the only way to spread fixed costs and restore its low-cost advantage. ⚪ 𝐘𝐨𝐮𝐧𝐠 𝐅𝐥𝐞𝐞𝐭 𝐌𝐢𝐭𝐢𝐠𝐚𝐭𝐞𝐬 𝐭𝐡𝐞 𝐅𝐮𝐞𝐥 𝐂𝐫𝐢𝐬𝐢𝐬 Frontier generated 106 Available Seat Miles per gallon, reinforcing its position as North America's lowest-emission carrier. Operating a fleet that is 84% comprised of the A320neo family acts as a critical operational hedge against total margin collapse when fuel hits $4.25 per gallon. 🔴 𝐒𝐮𝐫𝐩𝐫𝐢𝐬𝐞 𝐓𝐒𝐀 𝐀𝐮𝐝𝐢𝐭 𝐋𝐢𝐚𝐛𝐢𝐥𝐢𝐭𝐲 [NEW] A court ruling forced Frontier to record a $73 million charge related to unpaid TSA fees from unused travel between 2016 and 2018. While excluded from adjusted operating figures, this represents a massive, real cash drain that pressures the balance sheet. 𝐎𝐭𝐡𝐞𝐫 𝐊𝐏𝐈𝐬 𝐓𝐨𝐭𝐚𝐥 𝐋𝐢𝐪𝐮𝐢𝐝𝐢𝐭𝐲: $974 million Stable. Liquidity actually increased by $100 million from year-end 2025 despite the operating losses, supported by internal measures and advanced discussions to extend the co-brand credit card agreement. This provides a vital runway to absorb the incoming fuel shock. 𝐐𝟏 𝐀𝐝𝐣𝐮𝐬𝐭𝐞𝐝 𝐍𝐞𝐭 𝐋𝐨𝐬𝐬: -$68 million Decelerating. A significantly deeper loss than the $43 million deficit in the same quarter last year, as the 20% surge in total adjusted operating expenses completely overwhelmed the 17% gain in adjusted revenue. 𝐆𝐮𝐢𝐝𝐚𝐧𝐜𝐞 𝐐𝟐 𝟐𝟎𝟐𝟔 𝐂𝐚𝐩𝐚𝐜𝐢𝐭𝐲 (𝐀𝐒𝐌𝐬): Up 6% to 8% YoY Reversing. Shifting from a 1% contraction in Q1 to robust growth in Q2. Because Frontier is returning 24 leased aircraft simultaneously, this capacity growth must be driven entirely by flying the remaining planes harder (vastly improved utilization), which is essential to repairing the CASM blowout. 𝐐𝟐 𝟐𝟎𝟐𝟔 𝐀𝐝𝐣𝐮𝐬𝐭𝐞𝐝 𝐄𝐏𝐒: -$0.45 to -$0.60 Decelerating. A severe deterioration from Q1's -$0.30 loss. This negative trajectory is almost entirely attributable to the guided 47% sequential spike in jet fuel costs to $4.25 per gallon. 𝐐𝟐 𝟐𝟎𝟐𝟔 𝐀𝐝𝐣𝐮𝐬𝐭𝐞𝐝 𝐑𝐀𝐒𝐌: Up over 20% YoY Accelerating. Building aggressively on Q1's 18% growth. This implies that the commercial revenue strategy and moderated industry capacity are yielding real, structural pricing power. 𝐊𝐞𝐲 𝐐𝐮𝐞𝐬𝐭𝐢𝐨𝐧𝐬 𝐔𝐭𝐢𝐥𝐢𝐳𝐚𝐭𝐢𝐨𝐧 𝐌𝐞𝐜𝐡𝐚𝐧𝐢𝐜𝐬 With Q2 capacity guided up 6-8% while simultaneously returning 24 aircraft, exactly how many hours of daily utilization are you targeting for the summer peak to mathematically achieve this? 𝐅𝐮𝐞𝐥 𝐑𝐢𝐬𝐤 𝐌𝐢𝐭𝐢𝐠𝐚𝐭𝐢𝐨𝐧 Jet fuel is guided at an eye-watering $4.25 per gallon for Q2. Have you implemented any financial hedging strategies, or is the airline fully exposed to spot market volatility? 𝐇𝐢𝐝𝐝𝐞𝐧 𝐋𝐢𝐚𝐛𝐢𝐥𝐢𝐭𝐢𝐞𝐬 Does the $73M TSA liability require an immediate cash outlay this year, and are there any other pending audits or regulatory disputes that could trigger similar retroactive charges? 𝐑𝐞𝐯𝐞𝐧𝐮𝐞 𝐐𝐮𝐚𝐥𝐢𝐭𝐲 You expect >20% unit revenue growth in Q2. How much of this is driven by pure base fare increases versus the increased attachment of premium ancillary bundles?
Finsee tweet media
English
0
0
0
479
Finsee
Finsee@Finsee_main·
$PTLO Q1 2026 earnings: Buying Traffic Costs Margins as C-Suite Churns Portillo's broke its four-quarter streak of traffic declines in Q1 2026, with transactions growing 0.8%. However, this top-line victory came at a devastating cost to the bottom line. Heavy promotional activity and a negative product mix crushed average check, sending Restaurant-Level Adjusted EBITDA margins down 170 bps to 19.1%. The margin compression, coupled with elevated labor and operating expenses, pushed the company into a net loss of $0.5 million. Compounding the dismal financial picture is the sudden departure of CFO Michelle Hook on earnings day, just months after Brett Patterson took over as CEO. The company is actively slashing CapEx to stabilize cash flows, but the overarching narrative is that Portillo's is sacrificing its once-premium margins just to keep guests coming through the door. Full article with charts - link in bio 🐂 𝐁𝐮𝐥𝐥 𝐂𝐚𝐬𝐞 • 𝐓𝐫𝐚𝐟𝐟𝐢𝐜 𝐑𝐞𝐯𝐞𝐫𝐬𝐢𝐧𝐠 𝐭𝐨 𝐏𝐨𝐬𝐢𝐭𝐢𝐯𝐞 — After a grueling 2025 where same-restaurant traffic bottomed out at -3.3% in Q4, Q1 transactions grew 0.8%. The Perks loyalty program is effectively driving guest frequency. • 𝐂𝐚𝐩𝐄𝐱 𝐃𝐢𝐬𝐜𝐢𝐩𝐥𝐢𝐧𝐞 — Management is aggressively slashing capital expenditures to $55-$60M in FY26 (down from ~$90M in FY25) by slowing development to 8 units and utilizing smaller, cheaper restaurant formats. 🐻 𝐁𝐞𝐚𝐫 𝐂𝐚𝐬𝐞 • 𝐏𝐫𝐨𝐟𝐢𝐭𝐚𝐛𝐢𝐥𝐢𝐭𝐲 𝐑𝐞𝐯𝐞𝐫𝐬𝐢𝐧𝐠 𝐭𝐨 𝐍𝐞𝐠𝐚𝐭𝐢𝐯𝐞 — Operating income collapsed 56.7% YoY, and Net Income flipped from a $4.0M profit to a $0.5M loss. Earning a positive transaction count required sacrificing pricing power. • 𝐋𝐞𝐚𝐝𝐞𝐫𝐬𝐡𝐢𝐩 𝐈𝐧𝐬𝐭𝐚𝐛𝐢𝐥𝐢𝐭𝐲 — CFO Michelle Hook's sudden departure on earnings day, coupled with a new CEO still identifying growth priorities, creates immense execution risk during a delicate strategic reset. ⚖️ 𝐕𝐞𝐫𝐝𝐢𝐜𝐭: 🔴 Bearish. Positive traffic is the only bright spot in an otherwise bleak print. Net losses, collapsing operating margins, negative product mix, and a sudden CFO exit paint a picture of a company struggling to find its footing. 𝐊𝐞𝐲 𝐓𝐡𝐞𝐦𝐞𝐬 🔴🔴 𝐂𝐅𝐎 𝐃𝐞𝐩𝐚𝐫𝐭𝐮𝐫𝐞 𝐀𝐝𝐝𝐬 𝐭𝐨 𝐋𝐞𝐚𝐝𝐞𝐫𝐬𝐡𝐢𝐩 𝐂𝐡𝐮𝐫𝐧 [NEW] CFO Michelle Hook announced her departure effective immediately on earnings day. While positioned as 'pursuing another opportunity,' an immediate CFO exit alongside a net loss and a recent CEO transition (Brett Patterson joined in Q1) is a massive red flag. It points to internal friction or dissatisfaction with the new strategic direction. 🔴 𝐏𝐫𝐨𝐦𝐨𝐭𝐢𝐨𝐧𝐬 𝐁𝐮𝐲 𝐓𝐫𝐚𝐟𝐟𝐢𝐜, 𝐛𝐮𝐭 𝐃𝐞𝐬𝐭𝐫𝐨𝐲 𝐌𝐚𝐫𝐠𝐢𝐧𝐬 [NEW] Same-restaurant transactions Reversing from -3.3% in 25Q4 to +0.8% in 26Q1 is a critical win. However, Average Check dropped 0.9%. The breakdown shows a 1.0% negative product mix and a meager 0.1% increase in menu prices (net of promotions). Portillo's is discounting heavily to get customers in the door, destroying its Restaurant-Level Adjusted EBITDA margin, which compressed from 20.8% to 19.1% YoY. 🔴 𝐂𝐨𝐦𝐦𝐨𝐝𝐢𝐭𝐲 𝐚𝐧𝐝 𝐋𝐚𝐛𝐨𝐫 𝐈𝐧𝐟𝐥𝐚𝐭𝐢𝐨𝐧 𝐁𝐢𝐭𝐢𝐧𝐠 𝐇𝐚𝐫𝐝 Food, beverage, and packaging costs increased 1.8% due to commodity inflation, while labor expenses surged as a percentage of revenue (26.9% vs 26.6% last year) due to incremental investments in team members. Without the ability to pass these costs through to the consumer via pricing, operating income collapsed 56.7% YoY. 🟢 𝐍𝐞𝐰 𝐔𝐧𝐢𝐭 𝐃𝐞𝐯𝐞𝐥𝐨𝐩𝐦𝐞𝐧𝐭 𝐂𝐨𝐧𝐜𝐞𝐧𝐭𝐫𝐚𝐭𝐞𝐝 𝐢𝐧 𝐓𝐞𝐱𝐚𝐬 Portillo's opened four units in Q1 2026, heavily concentrated in Texas (Fort Worth, Humble, Dallas, El Paso), followed by Frisco in April. These non-comp restaurants contributed $7.7M to the year-over-year revenue increase. However, the Texas market has historically been a margin drag, and management's ability to turn these into highly profitable units remains unproven. 🟢 𝐒𝐡𝐫𝐢𝐧𝐤𝐢𝐧𝐠 𝐭𝐡𝐞 𝐅𝐨𝐨𝐭𝐩𝐫𝐢𝐧𝐭 𝐭𝐨 𝐒𝐚𝐯𝐞 𝐂𝐚𝐩𝐢𝐭𝐚𝐥 Management continues the 'strategic reset' initiated in late 2025. The company will only open 8 units in FY26 (down from 12 planned originally for FY25) and is transitioning to smaller 'Restaurant of the Future 1.0' designs and in-line locations. This discipline is evident in the sharply reduced CapEx guidance. 𝐎𝐭𝐡𝐞𝐫 𝐊𝐏𝐈𝐬 𝐎𝐩𝐞𝐫𝐚𝐭𝐢𝐧𝐠 𝐂𝐚𝐬𝐡 𝐅𝐥𝐨𝐰 (𝟐𝟔𝐐𝟏): $17.6 million Despite reporting a net loss, Operating Cash Flow actually increased YoY (from $9.5M in 25Q1). This was heavily driven by positive working capital changes, particularly from deferred lease incentives ($2.1M) and accrued expenses ($3.0M). It indicates the company is managing liquidity tightly amidst profitability struggles. 𝐆𝐞𝐧𝐞𝐫𝐚𝐥 𝐚𝐧𝐝 𝐀𝐝𝐦𝐢𝐧𝐢𝐬𝐭𝐫𝐚𝐭𝐢𝐯𝐞 𝐄𝐱𝐩𝐞𝐧𝐬𝐞𝐬 (𝟐𝟔𝐐𝟏): $20.4 million G&A increased 7.7% YoY, consuming 11.1% of total revenue. The increase was driven by higher equity-based compensation, advertising, and professional fees, which included $0.5 million in 'dead site costs.' The rising corporate overhead is exacerbating the margin squeeze at the restaurant level. 𝐆𝐮𝐢𝐝𝐚𝐧𝐜𝐞 𝐅𝐘𝟐𝟔 𝐀𝐝𝐣𝐮𝐬𝐭𝐞𝐝 𝐄𝐁𝐈𝐓𝐃𝐀: Flat vs. 2025 Decelerating. FY25 Adjusted EBITDA was $97.3M. Guiding to flat growth implies that new unit contributions and any traffic gains will be entirely wiped out by inflation, discounting, and higher operating costs. It completely erases the 'low-teens' long-term growth algorithm previously touted by former management. 𝐅𝐘𝟐𝟔 𝐑𝐞𝐬𝐭𝐚𝐮𝐫𝐚𝐧𝐭-𝐋𝐞𝐯𝐞𝐥 𝐀𝐝𝐣𝐮𝐬𝐭𝐞𝐝 𝐄𝐁𝐈𝐓𝐃𝐀 𝐌𝐚𝐫𝐠𝐢𝐧: 20.5% to 21.0% Stable compared to FY25 (21.6%), but implies an acceleration from Q1's depressed 19.1%. Achieving this requires a massive operational pivot in the remaining three quarters, either through easing commodity inflation or an abrupt end to promotional discounting. 𝐅𝐘𝟐𝟔 𝐂𝐚𝐩𝐢𝐭𝐚𝐥 𝐄𝐱𝐩𝐞𝐧𝐝𝐢𝐭𝐮𝐫𝐞𝐬: $55 - $60 million Decelerating aggressively. This is a massive cut from the ~$90 million spent in FY24 and FY25. It reflects the scaled-back development plan (8 units vs. 12) and the shift toward smaller, cheaper builds. It protects the balance sheet while the company attempts to fix its core operations. 𝐊𝐞𝐲 𝐐𝐮𝐞𝐬𝐭𝐢𝐨𝐧𝐬 𝐂𝐅𝐎 𝐃𝐞𝐩𝐚𝐫𝐭𝐮𝐫𝐞 𝐂𝐨𝐧𝐭𝐞𝐱𝐭 Michelle Hook has been central to Portillo's public markets transition since the IPO. Why the sudden departure on earnings day, and does this signal disagreements internally regarding the pace of development or the aggressive discounting strategy? 𝐌𝐚𝐫𝐠𝐢𝐧 𝐁𝐫𝐢𝐝𝐠𝐞 𝐟𝐨𝐫 𝐅𝐘𝟐𝟔 With Q1 Restaurant-Level margins printing at 19.1% and check trending negative, what are the specific mechanical steps to reach the 20.5%-21.0% full-year guidance range without sacrificing the hard-won positive traffic? 𝐓𝐞𝐱𝐚𝐬 𝐌𝐚𝐫𝐤𝐞𝐭 𝐕𝐢𝐚𝐛𝐢𝐥𝐢𝐭𝐲 Four of the five new units opened recently are in Texas, a market that significantly dragged margins in 2025. Are these new builds seeing different AUV ramps than the 2024 class, or are they still heavily reliant on margin-dilutive marketing to drive trial?
Finsee tweet media
English
0
1
2
750
Finsee
Finsee@Finsee_main·
$SWX Q1 2026 earnings: Core Utility Thrives as Corporate Drag Evaporates Southwest Gas delivered a highly profitable Q1 despite a massive drop in physical gas deliveries. While consolidated revenue fell 21% YoY to $585M (driven by lower pass-through gas costs), utility Operating Margin grew 3% to $477M. The corporate structure simplification is paying off immediately: with the $550M term loan retired following the Centuri spin-off, HoldCo interest expenses plunged, turning the corporate segment profitable. Guidance for FY26 was affirmed at $4.17-$4.32 per share, pointing to accelerating earnings. The standout forward-looking catalyst is the Great Basin pipeline: a recent open season generated 2.5 Bcf/d of demand for a pipeline designed for only 1.0 Bcf/d. Full article with charts - link in bio 🐂 𝐁𝐮𝐥𝐥 𝐂𝐚𝐬𝐞 • 𝐂𝐨𝐫𝐩𝐨𝐫𝐚𝐭𝐞 𝐃𝐞𝐛𝐭 𝐄𝐫𝐚𝐝𝐢𝐜𝐚𝐭𝐞𝐝 — The Corporate and Administrative segment swung from an $8.6M net loss in 25Q1 to a $0.6M profit this quarter, driven almost entirely by the repayment of corporate bank debt and a $550M term loan. • 𝐑𝐚𝐭𝐞 𝐇𝐢𝐤𝐞𝐬 𝐌𝐚𝐬𝐤 𝐕𝐨𝐥𝐮𝐦𝐞 𝐃𝐫𝐨𝐩𝐬 — Updated rates in Arizona and Nevada added $13.2M to Q1 margin, entirely protecting the bottom line from severe weather-related volume declines. 🐻 𝐁𝐞𝐚𝐫 𝐂𝐚𝐬𝐞 • 𝐒𝐞𝐯𝐞𝐫𝐞 𝐓𝐡𝐫𝐨𝐮𝐠𝐡𝐩𝐮𝐭 𝐂𝐨𝐧𝐭𝐫𝐚𝐜𝐭𝐢𝐨𝐧 — System throughput collapsed 12.7% YoY, led by a near 20% drop in residential usage. Relying purely on rate hikes to offset shrinking organic usage is unsustainable long-term. • 𝐂𝐚𝐥𝐢𝐟𝐨𝐫𝐧𝐢𝐚 𝐑𝐞𝐠𝐮𝐥𝐚𝐭𝐨𝐫𝐲 𝐃𝐫𝐚𝐠 — A delayed general rate case decision in California forced Q1 revenues to remain at 2025 levels, creating a temporary but material earnings headwind. ⚖️ 𝐕𝐞𝐫𝐝𝐢𝐜𝐭: 🟢 Bullish. The pure-play utility transformation is complete, and the financial benefits are immediately visible. Massive pipeline demand and margin protection mechanisms outweigh near-term volume weakness. 𝐊𝐞𝐲 𝐓𝐡𝐞𝐦𝐞𝐬 🟢🟢 𝐆𝐫𝐞𝐚𝐭 𝐁𝐚𝐬𝐢𝐧 𝐃𝐞𝐦𝐚𝐧𝐝 𝐄𝐱𝐩𝐥𝐨𝐝𝐞𝐬 [NEW] Accelerating. The 2028 Great Basin expansion project is seeing unprecedented commercial interest. An April open season received expressions of interest for 2.5 Bcf/d of incremental capacity. This massively exceeds the pipeline's 1.0 Bcf/d current design and the $1.7B baseline capex assumption, morphing this project from a standard expansion into a multi-decade growth engine. 🔴 𝐕𝐨𝐥𝐮𝐦𝐞 𝐂𝐨𝐥𝐥𝐚𝐩𝐬𝐞 𝐂𝐨𝐧𝐭𝐫𝐚𝐝𝐢𝐜𝐭𝐬 𝐆𝐫𝐨𝐰𝐭𝐡 𝐍𝐚𝐫𝐫𝐚𝐭𝐢𝐯𝐞 Decelerating. Management cited 'continued growth' as a Q1 driver (pointing to 1% net customer growth), but physical delivery data contradicts this rosy narrative. Total system throughput dropped 12.7% YoY, heavily dragged by a 19.7% collapse in Residential usage (down to 28.6M dekatherms). While decoupled rates protect margins today, structural declines in consumer usage will inevitably trigger affordability concerns and regulatory pushback on future rate hikes. 🟢 𝐑𝐞𝐠𝐮𝐥𝐚𝐭𝐨𝐫𝐲 𝐄𝐱𝐞𝐜𝐮𝐭𝐢𝐨𝐧 𝐂𝐥𝐨𝐬𝐞𝐬 𝐭𝐡𝐞 𝐋𝐚𝐠 Stable. The company's aggressive rate case strategy is working. Alignments in Arizona and Nevada directly injected $13.2M into Q1 margin. To further close regulatory lag, management recently filed a $101M request in Arizona and a $71M request in Nevada, explicitly demanding formula rate mechanisms to automate future cost recovery. 🔴 𝐂𝐚𝐥𝐢𝐟𝐨𝐫𝐧𝐢𝐚 𝐂𝐚𝐥𝐞𝐧𝐝𝐚𝐫 𝐕𝐨𝐥𝐚𝐭𝐢𝐥𝐢𝐭𝐲 [NEW] Reversing. A delayed general rate case decision in California forced the company to record Q1 revenues at lower 2025 authorized levels. While management tracks the shortfall in a memorandum account for future recovery, this delay negatively impacted Q1 reported earnings and highlights the persistent vulnerability to bureaucratic timelines. ⚪ 𝐈𝐧𝐟𝐫𝐚𝐬𝐭𝐫𝐮𝐜𝐭𝐮𝐫𝐞 𝐌𝐨𝐝𝐞𝐫𝐧𝐢𝐳𝐚𝐭𝐢𝐨𝐧 𝐒𝐡𝐢𝐟𝐭𝐢𝐧𝐠 𝐅𝐨𝐜𝐮𝐬 Stable. Capital allocation is pivoting. The specific Vintage Steel Pipeline replacement program officially concluded in 25Q1, ending its dedicated recovery stream (a $4.7M YoY margin headwind). Capital expenditures ($186.3M this quarter) are now shifting toward broader pipeline capacity reinforcement, franchise requirements, and engineering for the Great Basin project. 🔴 𝐌𝐚𝐜𝐫𝐨: 𝐏𝐫𝐨𝐩𝐞𝐫𝐭𝐲 𝐓𝐚𝐱𝐞𝐬 𝐂𝐫𝐞𝐞𝐩𝐢𝐧𝐠 𝐇𝐢𝐠𝐡𝐞𝐫 [NEW] Decelerating. Broader inflation continues to leak into operating expenses. Taxes other than income taxes rose by $1.3M, strictly driven by higher property tax assessments across all of Southwest Gas's operating jurisdictions. 𝐎𝐭𝐡𝐞𝐫 𝐊𝐏𝐈𝐬 𝐓𝐫𝐚𝐢𝐥𝐢𝐧𝐠 𝟏𝟐-𝐌𝐨𝐧𝐭𝐡 𝐔𝐭𝐢𝐥𝐢𝐭𝐲 𝐑𝐎𝐄: 8.5% Stable. Up from 8.3% at the end of FY25. This metric proves the utility is executing efficiently and earning close to its authorized limits across its major states, validating the pure-play utility strategy. 𝐐𝐮𝐚𝐫𝐭𝐞𝐫𝐥𝐲 𝐂𝐚𝐩𝐢𝐭𝐚𝐥 𝐄𝐱𝐩𝐞𝐧𝐝𝐢𝐭𝐮𝐫𝐞𝐬: $186.3 million Stable. The company is deploying capital steadily to support new customer demand and modernize infrastructure. This run-rate aligns perfectly with the annual guidance of ~$1.25 billion, weighted slightly toward the second half of the year. 𝐆𝐮𝐢𝐝𝐚𝐧𝐜𝐞 𝐅𝐘𝟐𝟔 𝐀𝐝𝐣𝐮𝐬𝐭𝐞𝐝 𝐄𝐏𝐒 𝐟𝐫𝐨𝐦 𝐂𝐨𝐧𝐭𝐢𝐧𝐮𝐢𝐧𝐠 𝐎𝐩𝐞𝐫𝐚𝐭𝐢𝐨𝐧𝐬: $4.17 - $4.32 Accelerating. Affirmed. The midpoint of $4.245 represents a 16% jump from FY25's $3.65 adjusted EPS. This dramatic acceleration is fueled by HoldCo debt elimination, recent rate case victories, and disciplined O&M cost control. 𝐅𝐘𝟐𝟔 𝐂𝐚𝐩𝐢𝐭𝐚𝐥 𝐄𝐱𝐩𝐞𝐧𝐝𝐢𝐭𝐮𝐫𝐞𝐬: ~$1.25 billion Accelerating. Up sharply from the $855 million spent in the Natural Gas Distribution segment in FY25. This represents a massive step-up in rate base investment, heavily driving the projected 9.5% - 11.5% rate base CAGR through 2030. 𝐊𝐞𝐲 𝐐𝐮𝐞𝐬𝐭𝐢𝐨𝐧𝐬 𝐆𝐫𝐞𝐚𝐭 𝐁𝐚𝐬𝐢𝐧 𝐏𝐫𝐨𝐣𝐞𝐜𝐭 𝐒𝐜𝐨𝐩𝐞 Given the 2.5 Bcf/d in expressions of interest for Great Basin, at what point do you revise the $1.7 billion base capex assumption upward, and how much of this demand can be handled without requiring a completely separate secondary pipeline corridor? 𝐓𝐡𝐫𝐨𝐮𝐠𝐡𝐩𝐮𝐭 𝐂𝐨𝐥𝐥𝐚𝐩𝐬𝐞 𝐯𝐬 𝐂𝐨𝐧𝐬𝐞𝐫𝐯𝐚𝐭𝐢𝐨𝐧 Residential throughput fell nearly 20% this quarter. How much of this was strictly weather-driven versus structural demand destruction or energy efficiency conservation from customers reacting to recent rate hikes? 𝐅𝐨𝐫𝐦𝐮𝐥𝐚 𝐑𝐚𝐭𝐞 𝐏𝐮𝐬𝐡𝐛𝐚𝐜𝐤 With formula rate mechanisms requested in both the $101M Arizona and $71M Nevada filings, what happens to your 12-14% EPS CAGR guidance if regulators reject these automated trackers in favor of traditional rate case proceedings?
Finsee tweet media
English
0
0
0
287
Finsee
Finsee@Finsee_main·
$GBLI Q1 2026 earnings: Wildfire Absence Masks a Severe Growth Reversal Global Indemnity returned to profitability in 26Q1, posting $4.1M in net income compared to a $4.1M loss a year ago. However, this recovery is an illusion created entirely by the absence of last year's $15.6M California Wildfire hit. Beneath the surface, the company's 'growth transformation' narrative has hit a wall. Gross written premiums contracted by 1.9%, driven by a stark 5.2% decline in the core Wholesale Commercial segment amid softening property rates. Excluding the wildfire anomaly from the prior year, net income actually halved year-over-year from $8.1M to $4.1M, dragged down by investment portfolio volatility and sticky corporate expenses. The core underlying underwriting margin remains stable (94.9% combined ratio ex-wildfires), but the sudden top-line deceleration heavily undermines the company's previously stated multi-year growth ambitions. Full article with charts - link in bio 🐂 𝐁𝐮𝐥𝐥 𝐂𝐚𝐬𝐞 • 𝐂𝐨𝐫𝐞 𝐔𝐧𝐝𝐞𝐫𝐰𝐫𝐢𝐭𝐢𝐧𝐠 𝐃𝐢𝐬𝐜𝐢𝐩𝐥𝐢𝐧𝐞 𝐈𝐧𝐭𝐚𝐜𝐭 — The company is not chasing bad business to cover up growth issues. The current accident year loss ratio remains exceptionally strong at 54.8%, driving $5.5M in current accident year underwriting income. • 𝐍𝐢𝐜𝐡𝐞 𝐒𝐞𝐠𝐦𝐞𝐧𝐭𝐬 𝐆𝐫𝐨𝐰𝐢𝐧𝐠 — Vacant Express (+4.9%) and Collectibles (+12.6%) continue to provide reliable, uncorrelated growth driven by organic agency expansion and new appointments. 🐻 𝐁𝐞𝐚𝐫 𝐂𝐚𝐬𝐞 • 𝐆𝐫𝐨𝐰𝐭𝐡 𝐄𝐧𝐠𝐢𝐧𝐞 𝐁𝐫𝐨𝐤𝐞𝐧 — The 5.2% drop in Wholesale Commercial premiums completely derails the company's projection of double-digit growth. Management admitted they are facing fierce property rate reductions. • 𝐄𝐥𝐞𝐯𝐚𝐭𝐞𝐝 𝐄𝐱𝐩𝐞𝐧𝐬𝐞 𝐁𝐚𝐬𝐞 — With an expense ratio stuck at 40.3% (up YoY), the company is carrying the corporate overhead of a high-growth company while delivering negative top-line growth, pressuring ROE. ⚖️ 𝐕𝐞𝐫𝐝𝐢𝐜𝐭: 🔴 Bearish. A severe and sudden deceleration in top-line growth combined with high structural costs completely contradicts the 'Project Manifest' growth narrative sold to investors throughout 2025. The margin of safety is thinning. 𝐊𝐞𝐲 𝐓𝐡𝐞𝐦𝐞𝐬 🔴 𝐖𝐡𝐨𝐥𝐞𝐬𝐚𝐥𝐞 𝐂𝐨𝐦𝐦𝐞𝐫𝐜𝐢𝐚𝐥 𝐏𝐥𝐮𝐧𝐠𝐞𝐬 𝐀𝐦𝐢𝐝 𝐒𝐨𝐟𝐭𝐞𝐧𝐢𝐧𝐠 𝐌𝐚𝐫𝐤𝐞𝐭 [NEW] The most alarming data point in the quarter is the sudden contraction of the Wholesale Commercial segment, which fell 5.2% to $61.5M. Throughout 2025, this segment consistently generated 6% to 14% growth. Management explicitly cited 'competitive market conditions, particularly as regards property rate reductions.' This indicates the lucrative E&S property hard market is ending, neutralizing the company's primary growth driver. 🔴 𝐄𝐱𝐩𝐞𝐧𝐬𝐞 𝐑𝐚𝐭𝐢𝐨 𝐑𝐞𝐦𝐚𝐢𝐧𝐬 𝐒𝐭𝐫𝐮𝐜𝐭𝐮𝐫𝐚𝐥𝐥𝐲 𝐄𝐥𝐞𝐯𝐚𝐭𝐞𝐝 The expense ratio edged up to 40.3% from 40.2% a year ago. Management previously justified high expenses (corporate costs of $9.0M this quarter) as necessary investments for 'Project Manifest' to achieve scale. With premiums now shrinking, this elevated cost structure is creating negative operating leverage. The long-term target of 37% looks mathematically out of reach without severe cost-cutting. ⚪ 𝐈𝐧𝐯𝐞𝐬𝐭𝐦𝐞𝐧𝐭 𝐕𝐨𝐥𝐚𝐭𝐢𝐥𝐢𝐭𝐲 𝐃𝐫𝐚𝐠𝐬 𝐃𝐨𝐰𝐧 𝐄𝐚𝐫𝐧𝐢𝐧𝐠𝐬 [NEW] Despite shifting into longer-duration corporate bonds in late 2025, the investment portfolio proved to be a drag. Net investment income fell to $12.2M (down from $14.8M YoY) due to a $2.3M market value decline on a single limited partnership. Additionally, the company suffered mark-to-market hits on fixed income due to rising Treasury rates, pulling annualized investment return down to a mere 1.9% (vs 5.4% in 25Q1). 🟢 𝐀𝐬𝐬𝐮𝐦𝐞𝐝 𝐑𝐞𝐢𝐧𝐬𝐮𝐫𝐚𝐧𝐜𝐞 𝐄𝐱𝐩𝐚𝐧𝐬𝐢𝐨𝐧 𝐂𝐨𝐧𝐭𝐢𝐧𝐮𝐞𝐬 Assumed Reinsurance remains a bright spot, growing 2.5% to $11.2M. While the growth rate has heavily decelerated from the massive 50%+ expansion seen during the initial Valyn Re ramp-up in 2025, it confirms that the 14+ new treaties written over the past 24 months are sticking and providing a baseline of diversified premium. 𝐎𝐭𝐡𝐞𝐫 𝐊𝐏𝐈𝐬 𝐁𝐨𝐨𝐤 𝐕𝐚𝐥𝐮𝐞 𝐏𝐞𝐫 𝐒𝐡𝐚𝐫𝐞: $47.92 Decelerating. BVPS dropped from $48.96 at year-end 2025. The decline was driven by $5.1M in dividend payouts and $2.6M in unrealized fixed-income losses caused by rising Treasury yields. Despite retaining nearly $300M in excess capital for M&A, BVPS has steadily eroded from $49.98 at year-end 2024. 𝐂𝐮𝐫𝐫𝐞𝐧𝐭 𝐀𝐜𝐜𝐢𝐝𝐞𝐧𝐭 𝐘𝐞𝐚𝐫 𝐋𝐨𝐬𝐬 𝐑𝐚𝐭𝐢𝐨: 54.8% Stable. The loss ratio showcases excellent underwriting discipline, comparing favorably to 55.3% in 24Q1 (the last normalized Q1). This indicates that while the company is losing top-line volume, it is walking away from underpriced business rather than lowering underwriting standards to prop up revenue. 𝐆𝐮𝐢𝐝𝐚𝐧𝐜𝐞 𝐅𝐘𝟐𝟔 𝐁𝐞𝐥𝐦𝐨𝐧𝐭 𝐂𝐨𝐫𝐞 𝐆𝐫𝐨𝐬𝐬 𝐖𝐫𝐢𝐭𝐭𝐞𝐧 𝐏𝐫𝐞𝐦𝐢𝐮𝐦𝐬: 15% to 20% Growth (Prior Guidance) Reversing. During Q4 2025, management guided for 15-20% growth in Belmont Core GWP. Given that total GWP shrank 1.9% in Q1 2026 (and Core shrank 1.9% to $96.5M), achieving this annual guidance is highly improbable unless a massive acquisition closes or property rates miraculously harden mid-year. 𝐅𝐘𝟐𝟔 𝐄𝐱𝐩𝐞𝐧𝐬𝐞 𝐑𝐚𝐭𝐢𝐨: Approx. 40.5% (Prior Guidance) Stable. The company previously guided that 2026 would remain elevated at ~40.5% before seeing long-term improvements from scaling. The Q1 result of 40.3% is perfectly in line with this, though the lack of top-line premium growth makes the raw dollar spend harder to justify to investors. 𝐊𝐞𝐲 𝐐𝐮𝐞𝐬𝐭𝐢𝐨𝐧𝐬 𝐆𝐫𝐨𝐰𝐭𝐡 𝐓𝐚𝐫𝐠𝐞𝐭 𝐅𝐞𝐚𝐬𝐢𝐛𝐢𝐥𝐢𝐭𝐲 In Q4 2025, you guided for 15-20% growth in Belmont Core for 2026. Given the 1.9% contraction in Q1 and flat property rates, are you formally retracting that target, or do you have a specific M&A transaction imminent to bridge that gap? 𝐄𝐱𝐩𝐞𝐧𝐬𝐞 𝐑𝐚𝐭𝐢𝐨 𝐀𝐝𝐣𝐮𝐬𝐭𝐦𝐞𝐧𝐭𝐬 With Wholesale Commercial premiums shrinking, the 40.3% expense ratio creates severe negative leverage. If the top line cannot grow in this softer market, what specific dollar-value cost cuts are planned for the corporate expense line? 𝐋𝐢𝐦𝐢𝐭𝐞𝐝 𝐏𝐚𝐫𝐭𝐧𝐞𝐫𝐬𝐡𝐢𝐩 𝐖𝐫𝐢𝐭𝐞-𝐃𝐨𝐰𝐧 You recorded a $2.3 million market value decline on a single LP position but expect a 'full recovery' in Q2. What specifically is the underlying asset of this LP, and what mechanics guarantee this recovery?
Finsee tweet media
English
0
0
1
278
Finsee
Finsee@Finsee_main·
$STIM Q1 2026 earnings: Clinic Growth Masks Legacy Weakness as Margins Compress Neuronetics delivered an 8% YoY revenue increase to $34.5 million in Q1 2026, driven entirely by its acquired Greenbrook clinic business. However, the legacy core engine is stalling: U. S. treatment session revenue reversed to a 5% decline. This structural mix shift toward clinic services dragged gross margins down to 46.9%. While aggressive operating expense control narrowed the net loss and significantly improved cash burn compared to a year ago, the balance sheet remains tight with $19.0 million in total cash. Q2 guidance for 'mid-single digit' growth signals a decelerating top-line trajectory as the company laps the Greenbrook acquisition anniversary. Full article with charts - link in bio 🐂 𝐁𝐮𝐥𝐥 𝐂𝐚𝐬𝐞 • 𝐄𝐱𝐩𝐞𝐧𝐬𝐞 𝐃𝐢𝐬𝐜𝐢𝐩𝐥𝐢𝐧𝐞 𝐢𝐬 𝐖𝐨𝐫𝐤𝐢𝐧𝐠 — Operating expenses fell 6% YoY to $25.1 million. This cost discipline slashed Q1 operating cash burn from $17.0 million last year to $9.4 million this quarter, proving the company can leverage its scale. • 𝐏𝐨𝐥𝐢𝐜𝐲 𝐓𝐚𝐢𝐥𝐰𝐢𝐧𝐝𝐬 𝐄𝐱𝐩𝐚𝐧𝐝 𝐓𝐀𝐌 — Optum/UHC's decision to allow Psychiatric Mental Health Nurse Practitioners (PMHNPs) to administer NeuroStar opens access to nearly 35 million covered lives across 26 states, alleviating psychiatric staffing bottlenecks. 🐻 𝐁𝐞𝐚𝐫 𝐂𝐚𝐬𝐞 • 𝐒𝐭𝐫𝐮𝐜𝐭𝐮𝐫𝐚𝐥 𝐌𝐚𝐫𝐠𝐢𝐧 𝐃𝐞𝐠𝐫𝐚𝐝𝐚𝐭𝐢𝐨𝐧 — As lower-margin clinic revenue outpaces legacy capital and consumable sales, gross margins compressed from 49.2% to 46.9%. Management's FY26 guidance indicates this is the new normal. • 𝐂𝐨𝐫𝐞 𝐂𝐨𝐧𝐬𝐮𝐦𝐚𝐛𝐥𝐞𝐬 𝐚𝐫𝐞 𝐒𝐡𝐫𝐢𝐧𝐤𝐢𝐧𝐠 — Despite a larger installed base and clinic network, U. S. treatment session revenue dropped 5%. This signals potential cannibalization or underutilization across the legacy independent provider network. ⚖️ 𝐕𝐞𝐫𝐝𝐢𝐜𝐭: ⚪ Neutral. Management is executing well on expense control and clinic integration, but the decelerating top-line guidance and shrinking standalone treatment session volumes limit near-term upside. The path to profitability relies entirely on halting the remaining cash burn before the $19M cash balance runs out. 𝐊𝐞𝐲 𝐓𝐡𝐞𝐦𝐞𝐬 🟢 𝐔.𝐒. 𝐂𝐥𝐢𝐧𝐢𝐜𝐬 𝐃𝐫𝐢𝐯𝐢𝐧𝐠 𝐓𝐨𝐩-𝐋𝐢𝐧𝐞 𝐎𝐮𝐭𝐩𝐮𝐭 The Greenbrook clinic network remains the primary growth engine. U. S. clinic revenue grew 15% YoY to $21.5 million, accounting for 62% of total revenue. This shift from a capital equipment manufacturer to a vertically integrated healthcare provider is stable and anchoring the top line. 🟢 𝐍𝐮𝐫𝐬𝐞 𝐏𝐫𝐚𝐜𝐭𝐢𝐭𝐢𝐨𝐧𝐞𝐫 𝐏𝐨𝐥𝐢𝐜𝐲 𝐔𝐧𝐥𝐨𝐜𝐤𝐬 𝐂𝐚𝐩𝐚𝐜𝐢𝐭𝐲 [NEW] A major technological and operational innovation hurdle has been cleared: Optum/UHC/UBH expanded its clinical policy to allow PMHNPs to order and administer NeuroStar Advanced Therapy. This applies to states with full practice authority, reaching ~34.8 million lives. This allows Neuronetics to scale clinic throughput without the prohibitively high costs and scarcity of licensed psychiatrists. ⚪ 𝐀𝐠𝐠𝐫𝐞𝐬𝐬𝐢𝐯𝐞 𝐎𝐩𝐄𝐱 𝐂𝐨𝐧𝐭𝐫𝐨𝐥 𝐈𝐦𝐩𝐫𝐨𝐯𝐞𝐬 𝐁𝐮𝐫𝐧 Management's commitment to cost synergies is accelerating. Q1 operating expenses were $25.1 million, down 6% YoY, driven by reductions in general, administrative, sales, and marketing expenses. This discipline resulted in a $7.6 million YoY reduction in operating cash burn. 🔴 𝐋𝐞𝐠𝐚𝐜𝐲 𝐓𝐫𝐞𝐚𝐭𝐦𝐞𝐧𝐭 𝐒𝐞𝐬𝐬𝐢𝐨𝐧𝐬 𝐑𝐞𝐯𝐞𝐫𝐬𝐢𝐧𝐠 [NEW] Contradicting the bullish narrative of clinic expansion, U. S. treatment session revenue reversed course, falling 5% YoY from $9.6M to $9.1M. If the company is actively cannibalizing independent NeuroStar accounts to feed its company-owned Greenbrook clinics, the underlying health of the legacy consumables business is severely compromised. 🔴 𝐌𝐚𝐫𝐠𝐢𝐧 𝐂𝐨𝐦𝐩𝐫𝐞𝐬𝐬𝐢𝐨𝐧 𝐟𝐫𝐨𝐦 𝐌𝐢𝐱 𝐒𝐡𝐢𝐟𝐭 Gross margin decelerated to 46.9% in Q1 2026, down from 49.2% a year ago and a far cry from the ~75% margins the company enjoyed before acquiring Greenbrook. As service-based revenue overtakes high-margin consumable packs, the company will require significantly higher volume to drop the same dollars to the bottom line. 🔴 𝐃𝐞𝐜𝐞𝐥𝐞𝐫𝐚𝐭𝐢𝐧𝐠 𝐑𝐞𝐯𝐞𝐧𝐮𝐞 𝐆𝐫𝐨𝐰𝐭𝐡 [NEW] After posting triple- and double-digit growth in 2025 due to the Greenbrook acquisition, growth is rapidly decelerating. Q1 landed at 8% YoY, and management guided Q2 for 'mid-single digits'. Furthermore, International revenue collapsed 54% YoY to just $228K, effectively rendering the business a U. S.-only play. ⚪ 𝐂𝐨𝐧𝐬𝐨𝐥𝐢𝐝𝐚𝐭𝐢𝐧𝐠 𝐌𝐞𝐧𝐭𝐚𝐥 𝐇𝐞𝐚𝐥𝐭𝐡 𝐂𝐚𝐫𝐞 𝐃𝐞𝐥𝐢𝐯𝐞𝐫𝐲 From a macro perspective, Neuronetics is positioning itself at the center of the mental health supply chain. By pairing NeuroStar hardware with the Greenbrook clinic footprint and layering in complementary pharmacological treatments like SPRAVATO (esketamine), the company is morphing into a full-stack mental health service provider rather than a pure-play med-tech vendor. 𝐎𝐭𝐡𝐞𝐫 𝐊𝐏𝐈𝐬 𝐎𝐩𝐞𝐫𝐚𝐭𝐢𝐧𝐠 𝐂𝐚𝐬𝐡 𝐅𝐥𝐨𝐰: -$9.4 million A stable improvement from the -$17.0 million burn in Q1 2025. However, this operational burn, combined with a $5.0 million debt principal payment, drove total cash down from $34.1 million at year-end to $19.0 million. The margin for error is shrinking. 𝐍𝐞𝐮𝐫𝐨𝐒𝐭𝐚𝐫 𝐒𝐲𝐬𝐭𝐞𝐦 𝐒𝐡𝐢𝐩𝐦𝐞𝐧𝐭𝐬: 34 units Accelerating slightly compared to 31 units shipped in Q1 2025. Revenue for this segment grew 13% to $3.2 million, implying average selling prices remain stable and healthy in the $90,000 to $94,000 range. 𝐋𝐨𝐧𝐠-𝐓𝐞𝐫𝐦 𝐃𝐞𝐛𝐭, 𝐍𝐞𝐭: $61.3 million Decreased from $65.8 million at the end of 2025 following a $5.0 million principal payment to Perceptive Advisors. This move incurred a $0.5 million extinguishment loss but reduces ongoing interest expense burdens, crucial for a company focused on conserving cash. 𝐆𝐮𝐢𝐝𝐚𝐧𝐜𝐞 𝐐𝟐 𝟐𝟎𝟐𝟔 𝐓𝐨𝐭𝐚𝐥 𝐑𝐞𝐯𝐞𝐧𝐮𝐞: Mid-single digits growth Decelerating significantly. Based on Q2 2025 revenue of $38.1 million, mid-single digit growth implies roughly $39.5 to $40.5 million. This indicates organic volume growth is sluggish following the lapping of the Greenbrook acquisition. 𝐅𝐘𝟐𝟔 𝐓𝐨𝐭𝐚𝐥 𝐑𝐞𝐯𝐞𝐧𝐮𝐞: $160 - $166 million Stable compared to prior long-term targets. The midpoint ($163M) implies roughly 9% YoY growth versus FY25's ~$149 million. Achieving this relies heavily on Q3 and Q4 performance, given the tepid Q1 actuals and Q2 guide. 𝐅𝐘𝟐𝟔 𝐆𝐫𝐨𝐬𝐬 𝐌𝐚𝐫𝐠𝐢𝐧: 47% - 49% Stable vs Q1 2026 actuals (46.9%) but confirms that the high-margin profile of the legacy equipment business is permanently diluted by the clinical service mix. 𝐅𝐘𝟐𝟔 𝐂𝐚𝐬𝐡 𝐅𝐥𝐨𝐰 𝐅𝐫𝐨𝐦 𝐎𝐩𝐞𝐫𝐚𝐭𝐢𝐨𝐧𝐬: Negative $13 - $17 million Accelerating improvement expected in the back half. Because Q1 2026 already consumed $9.4 million, achieving the full-year target of -$13M to -$17M mathematically requires the company to run near cash-flow breakeven for the remaining three quarters of the year. 𝐊𝐞𝐲 𝐐𝐮𝐞𝐬𝐭𝐢𝐨𝐧𝐬 𝐓𝐫𝐞𝐚𝐭𝐦𝐞𝐧𝐭 𝐒𝐞𝐬𝐬𝐢𝐨𝐧 𝐃𝐞𝐜𝐥𝐢𝐧𝐞 𝐌𝐞𝐜𝐡𝐚𝐧𝐢𝐜𝐬 U. S. treatment session revenue dropped 5% despite a 10% increase in system placements and an expanded installed base. Are we seeing direct cannibalization where independent providers are losing patient volume to company-owned Greenbrook locations? 𝐂𝐚𝐬𝐡 𝐑𝐮𝐧𝐰𝐚𝐲 𝐚𝐧𝐝 𝐃𝐞𝐛𝐭 𝐎𝐛𝐥𝐢𝐠𝐚𝐭𝐢𝐨𝐧𝐬 With $19 million in total cash and an implied $3.6M to $7.6M of operating burn remaining for the year, liquidity is tight. What is the minimum cash threshold required by your debt covenants, and what contingency plans are in place if Q4 fails to generate positive cash flow? 𝐍𝐮𝐫𝐬𝐞 𝐏𝐫𝐚𝐜𝐭𝐢𝐭𝐢𝐨𝐧𝐞𝐫 𝐑𝐨𝐥𝐥𝐨𝐮𝐭 𝐓𝐢𝐦𝐞𝐥𝐢𝐧𝐞 The Optum/UHC policy expansion for Nurse Practitioners is a massive TAM unlock. How quickly can this be operationalized across the Greenbrook footprint, and does it require near-term investments in training and credentialing?
Finsee tweet media
English
0
0
1
778
Finsee
Finsee@Finsee_main·
$IPGP Q1 2026 earnings: Top-Line Rebounds, But Margins and 'Advanced' Hype Deflate IPG Photonics delivered a second consecutive quarter of 17% YoY revenue growth, beating expectations on the back of resilient Industrial Solutions demand. However, the top-line success did not flow to the bottom line. GAAP Operating Margin reversed to negative (-2.9%) largely due to a $13.5M settlement to clear all patent litigation with TRUMPF. Even adjusted metrics show strain: Adjusted Gross Margin compressed 220 bps YoY to 37.8% due to relentless tariff pressures. Crucially, management's new reporting structure exposed a break in the growth narrative—while Industrial grew 21%, the newly formed 'Advanced Solutions' segment surprisingly declined 5%, dragged down by defense and micromachining—areas heavily hyped in 2025. Full article with charts - link in bio 🐂 𝐁𝐮𝐥𝐥 𝐂𝐚𝐬𝐞 • 𝐈𝐧𝐝𝐮𝐬𝐭𝐫𝐢𝐚𝐥 𝐂𝐨𝐫𝐞 𝐒𝐡𝐨𝐰𝐢𝐧𝐠 𝐑𝐞𝐚𝐥 𝐌𝐮𝐬𝐜𝐥𝐞 — The legacy business is accelerating. Industrial Solutions (86% of revenue) surged 21% YoY. Book-to-bill firmly above 1.0 indicates this momentum is sustainable in the near term despite elevated macroeconomic uncertainty. • 𝐋𝐢𝐭𝐢𝐠𝐚𝐭𝐢𝐨𝐧 𝐎𝐯𝐞𝐫𝐡𝐚𝐧𝐠 𝐑𝐞𝐦𝐨𝐯𝐞𝐝 — The $13.5M global patent settlement with TRUMPF is a one-time hit that clears a major strategic and financial overhang, freeing up resources and eliminating a recurring legal distraction. 🐻 𝐁𝐞𝐚𝐫 𝐂𝐚𝐬𝐞 • 𝐀𝐝𝐯𝐚𝐧𝐜𝐞𝐝 𝐒𝐨𝐥𝐮𝐭𝐢𝐨𝐧𝐬 𝐌𝐢𝐬𝐬𝐞𝐝 𝐭𝐡𝐞 𝐌𝐞𝐦𝐨 — Management spent 2025 touting the CROSSBOW directed energy system and new micromachining platforms. Yet, Q1 26 Advanced Solutions revenue dropped 5% YoY precisely due to weakness in these two applications. • 𝐓𝐚𝐫𝐢𝐟𝐟𝐬 𝐎𝐮𝐭𝐩𝐚𝐜𝐢𝐧𝐠 𝐌𝐢𝐭𝐢𝐠𝐚𝐭𝐢𝐨𝐧 — Despite a year of supply chain reshuffling to bypass duties, tariffs and higher product costs continue to compress Adjusted Gross Margins (down from 40.0% in 25Q1 to 37.8% today). ⚖️ 𝐕𝐞𝐫𝐝𝐢𝐜𝐭: ⚪ Neutral. The 17% revenue growth and resolution of the TRUMPF litigation are solid wins, but the failure of the Advanced Solutions segment to fire, combined with sticky margin compression, caps the upside. 𝐊𝐞𝐲 𝐓𝐡𝐞𝐦𝐞𝐬 🔴🔴 𝐍𝐚𝐫𝐫𝐚𝐭𝐢𝐯𝐞 𝐁𝐫𝐞𝐚𝐤: 𝐀𝐝𝐯𝐚𝐧𝐜𝐞𝐝 𝐒𝐨𝐥𝐮𝐭𝐢𝐨𝐧𝐬 𝐂𝐨𝐧𝐭𝐫𝐚𝐜𝐭𝐢𝐨𝐧 [NEW] In 2025, management extensively highlighted their CROSSBOW anti-drone system and micromachining launches as primary growth drivers with a massive TAM. With the Q1 26 introduction of the 'Advanced Solutions' segment, there is now clear visibility—and the data contradicts the previous hype. The segment contracted 5% YoY to $37.9M explicitly due to lower revenue in defense and micromachining. If the touted high-margin growth engines are already stalling, the long-term margin recovery story is at risk. 🟢 𝐈𝐧𝐝𝐮𝐬𝐭𝐫𝐢𝐚𝐥 𝐒𝐨𝐥𝐮𝐭𝐢𝐨𝐧𝐬 𝐑𝐞-𝐀𝐜𝐜𝐞𝐥𝐞𝐫𝐚𝐭𝐢𝐧𝐠 [NEW] IPG fundamentally realigned its reporting to highlight 'Industrial Solutions', and the segment delivered. Sales surged 21% YoY to $227.6M. The acceleration was broad-based across welding, cutting, marking, and cleaning applications. This proves that despite macroeconomic jitters, IPG's core value proposition in industrial automation remains highly relevant. 🔴 𝐒𝐭𝐢𝐜𝐤𝐲 𝐓𝐚𝐫𝐢𝐟𝐟 𝐇𝐞𝐚𝐝𝐰𝐢𝐧𝐝𝐬 𝐂𝐨𝐦𝐩𝐫𝐞𝐬𝐬𝐢𝐧𝐠 𝐌𝐚𝐫𝐠𝐢𝐧𝐬 Adjusted Gross Margin fell from 40.0% in 25Q1 to 37.8% in 26Q1. While management managed to lower inventory provisions, the structural drag from tariffs and underlying product costs remains stubbornly high. The Q2 guidance (37-40%) implies this is the new normal, indicating that IPG's operational footprint adjustments have not fully offset geopolitical trade friction. 🟢 𝐍𝐨𝐫𝐭𝐡 𝐀𝐦𝐞𝐫𝐢𝐜𝐚 𝐋𝐞𝐚𝐝𝐬 𝐆𝐞𝐨𝐠𝐫𝐚𝐩𝐡𝐢𝐜 𝐑𝐞𝐛𝐨𝐮𝐧𝐝 Regional performance showed a dramatic reversal in North America, where sales surged 27% YoY. This is a sharp acceleration compared to early 2025 when the region was posting low double-digit declines. Asia also remains resilient, growing 14% YoY, while Europe stabilized at a 4% growth rate. ⚪ 𝐓𝐑𝐔𝐌𝐏𝐅 𝐒𝐞𝐭𝐭𝐥𝐞𝐦𝐞𝐧𝐭 𝐂𝐥𝐞𝐚𝐫𝐬 𝐭𝐡𝐞 𝐀𝐢𝐫 [NEW] IPG booked a $13.5M operating charge to settle and dismiss all worldwide patent litigation with competitor TRUMPF. While this pushed Q1 GAAP operating income to a $7.7M loss, it decisively removes a major strategic distraction. Investors should view this as a clean slate that allows management to redirect legal spend toward R&D. 🟢 𝐌𝐞𝐝𝐢𝐜𝐚𝐥 𝐚𝐧𝐝 𝐒𝐞𝐦𝐢𝐜𝐨𝐧𝐝𝐮𝐜𝐭𝐨𝐫 𝐁𝐫𝐢𝐠𝐡𝐭 𝐒𝐩𝐨𝐭𝐬 While defense and micromachining dragged down Advanced Solutions, management explicitly noted that Medical and Semiconductor applications posted increased sales. This validates the adoption of their next-generation Thulium lasers in urology and recent semiconductor design wins, providing a partial cushion to the segment. 𝐎𝐭𝐡𝐞𝐫 𝐊𝐏𝐈𝐬 𝐀𝐝𝐣𝐮𝐬𝐭𝐞𝐝 𝐄𝐁𝐈𝐓𝐃𝐀 (𝟐𝟔𝐐𝟏): $35.2 million Up 8% YoY from $32.7M in 25Q1, but significantly lagging the 17% top-line revenue growth. This demonstrates negative operating leverage caused by the combined forces of tariff-driven gross margin compression and elevated operating expenses. 𝐂𝐚𝐬𝐡 𝐚𝐧𝐝 𝐒𝐡𝐨𝐫𝐭-𝐓𝐞𝐫𝐦 𝐈𝐧𝐯𝐞𝐬𝐭𝐦𝐞𝐧𝐭𝐬 (𝟐𝟔𝐐𝟏): $812.9 million Total liquidity declined slightly from $839.3M at the end of FY25 ($480.8M cash + $332.1M short-term investments). The balance sheet remains pristine with zero debt, providing ample cushion to absorb working capital fluctuations and the $13.5M TRUMPF settlement payment. 𝐆𝐮𝐢𝐝𝐚𝐧𝐜𝐞 𝐐𝟐 𝟐𝟎𝟐𝟔 𝐑𝐞𝐯𝐞𝐧𝐮𝐞: $260 - $290 million Decelerating. The midpoint of $275M implies a 9.7% YoY growth rate compared to Q2 2025's $250.7M. While this marks a slowdown from Q1's 17% surge, it still represents solid top-line health against ongoing macro uncertainty. 𝐐𝟐 𝟐𝟎𝟐𝟔 𝐀𝐝𝐣𝐮𝐬𝐭𝐞𝐝 𝐆𝐫𝐨𝐬𝐬 𝐌𝐚𝐫𝐠𝐢𝐧: 37.0% - 40.0% Stable. The midpoint of 38.5% shows slight sequential improvement from Q1's 37.8%, but indicates the company is still struggling to decisively clear the 40% threshold due to lingering tariff effects. 𝐐𝟐 𝟐𝟎𝟐𝟔 𝐀𝐝𝐣𝐮𝐬𝐭𝐞𝐝 𝐄𝐏𝐒: $0.25 - $0.55 Accelerating slightly. The midpoint of $0.40 represents an improvement over Q1 2026's $0.29, but illustrates the wide band of profitability outcomes based on revenue scale and manufacturing absorption. 𝐊𝐞𝐲 𝐐𝐮𝐞𝐬𝐭𝐢𝐨𝐧𝐬 𝐓𝐡𝐞 𝐂𝐑𝐎𝐒𝐒𝐁𝐎𝐖 𝐚𝐧𝐝 𝐌𝐢𝐜𝐫𝐨𝐦𝐚𝐜𝐡𝐢𝐧𝐢𝐧𝐠 𝐌𝐢𝐬𝐬 Advanced Solutions declined 5% YoY due to defense and micromachining weakness. Given the intense focus on CROSSBOW and new micromachining product cycles in 2025, was this an order timing issue, a loss of market share, or a broader TAM realization delay? 𝐓𝐑𝐔𝐌𝐏𝐅 𝐒𝐞𝐭𝐭𝐥𝐞𝐦𝐞𝐧𝐭 𝐌𝐞𝐜𝐡𝐚𝐧𝐢𝐜𝐬 Beyond the $13.5M one-time charge, does the global settlement with TRUMPF include any ongoing royalty payments or licensing fees that will impact future cost of goods sold? 𝐏𝐚𝐭𝐡 𝐁𝐚𝐜𝐤 𝐭𝐨 𝟒𝟎%+ 𝐆𝐫𝐨𝐬𝐬 𝐌𝐚𝐫𝐠𝐢𝐧𝐬 With Adjusted Gross Margins pinned below 38%, what specific milestones in your geographic supply chain transition must be met to offset tariff costs and return to a 40%+ margin profile?
Finsee tweet media
English
0
0
1
772
Finsee
Finsee@Finsee_main·
$BTU Q1 2026 earnings: Centurion Stumbles Cause Earnings to Collapse Despite Thermal Strength Peabody delivered a jarring Q1 2026 report where solid top-line revenue growth (+4% YoY) was entirely overshadowed by an operational breakdown at its flagship Centurion mine. Net Income reversed sharply into negative territory, dropping to a $32.4M loss from a $34.4M profit a year ago. The Seaborne Metallurgical segment—long touted by management as the future cash flow engine—swung to a gross loss as costs exploded to $141.72 per ton. While the thermal coal segments outperformed expectations due to macro tailwinds and geopolitical pricing spikes, the severe execution failure on the company's most important growth asset radically alters the 2026 free cash flow narrative. Full article with charts - link in bio 🐂 𝐁𝐮𝐥𝐥 𝐂𝐚𝐬𝐞 • 𝐓𝐡𝐞𝐫𝐦𝐚𝐥 𝐃𝐞𝐦𝐚𝐧𝐝 𝐑𝐞𝐦𝐚𝐢𝐧𝐬 𝐑𝐞𝐬𝐢𝐥𝐢𝐞𝐧𝐭 — Seaborne Thermal capitalized on LNG price spikes linked to Middle East conflicts, driving margins to an impressive 25%. Concurrently, U. S. Thermal segments continue to benefit from structural data center demand, generating over $61M in combined EBITDA. • 𝐏𝐫𝐢𝐜𝐢𝐧𝐠 𝐓𝐚𝐢𝐥𝐰𝐢𝐧𝐝𝐬 𝐟𝐨𝐫 𝐌𝐞𝐭 𝐂𝐨𝐚𝐥 — Despite operational issues, Seaborne Metallurgical realized prices increased 13% sequentially to $138.28 per ton, indicating underlying market strength if Peabody can fix its production bottlenecks. 🐻 𝐁𝐞𝐚𝐫 𝐂𝐚𝐬𝐞 • 𝐂𝐞𝐧𝐭𝐮𝐫𝐢𝐨𝐧 𝐍𝐚𝐫𝐫𝐚𝐭𝐢𝐯𝐞 𝐃𝐞𝐫𝐚𝐢𝐥𝐬 — The highly anticipated Centurion longwall ramp-up failed. Equipment and roof control issues triggered an $80M segment loss and forced management to slash 2026 expected volume by nearly 30% (from 3.5M tons to 2.5M tons). • 𝐀𝐜𝐜𝐞𝐥𝐞𝐫𝐚𝐭𝐢𝐧𝐠 𝐂𝐨𝐬𝐭 𝐈𝐧𝐟𝐥𝐚𝐭𝐢𝐨𝐧 — Costs are spiraling. Seaborne Met costs jumped 20% YoY, and Q2 guidance anticipates further acceleration to $145-$150 per ton. PRB costs are also creeping up, threatening to compress margins to near zero. ⚖️ 𝐕𝐞𝐫𝐝𝐢𝐜𝐭: 🔴 Bearish. Management spent all of 2025 hyping Centurion as a low-cost FCF inflection point. The severe technical issues and massive cost overruns out of the gate destroy that credibility and eclipse the reliable performance of the legacy thermal assets. 𝐊𝐞𝐲 𝐓𝐡𝐞𝐦𝐞𝐬 🔴🔴 𝐂𝐞𝐧𝐭𝐮𝐫𝐢𝐨𝐧 𝐄𝐱𝐞𝐜𝐮𝐭𝐢𝐨𝐧 𝐅𝐚𝐢𝐥𝐮𝐫𝐞 𝐂𝐫𝐮𝐬𝐡𝐞𝐬 𝐌𝐞𝐭 𝐌𝐚𝐫𝐠𝐢𝐧𝐬 [NEW] The long-awaited Centurion longwall commissioning was a disaster. Electrical, mechanical, and roof control issues restricted cutting speeds, resulting in a staggering $80M negative impact on the Seaborne Metallurgical segment. Consequently, operating margins for the segment reversed into the red, with costs per ton ($141.72) drastically exceeding realized revenue ($138.28). This completely contradicts previous quarters' promises of Centurion driving segment costs down and elevating the company's margin profile. 🟢 𝐆𝐞𝐨𝐩𝐨𝐥𝐢𝐭𝐢𝐜𝐬 𝐁𝐮𝐨𝐲 𝐒𝐞𝐚𝐛𝐨𝐫𝐧𝐞 𝐓𝐡𝐞𝐫𝐦𝐚𝐥 The Seaborne Thermal segment acted as a primary buffer against total collapse. Driven by increased Asian demand responding to spiking LNG prices (a direct result of Middle East conflict), the segment beat volume expectations by 0.2 million tons. Margins held stable at a robust 25%, producing $48.5M in Adjusted EBITDA. ⚪ 𝐏𝐑𝐁 𝐌𝐚𝐫𝐠𝐢𝐧𝐬 𝐒𝐪𝐮𝐞𝐞𝐳𝐞𝐝 𝐛𝐲 𝐂𝐨𝐬𝐭𝐬 [NEW] While Powder River Basin (PRB) volumes (21.2M tons) benefited from strong U. S. electricity demand, margin compression is a serious red flag. Costs per ton rose to $12.53 (vs $12.18 a year ago), driven by equipment maintenance. With Q2 PRB costs guided to $13.00-$13.50 against an average price of $13.50, this segment's margin is decelerating toward breakeven. 🟢 𝐂𝐫𝐢𝐭𝐢𝐜𝐚𝐥 𝐌𝐢𝐧𝐞𝐫𝐚𝐥𝐬 𝐚𝐬 𝐚 𝐋𝐚𝐭𝐞𝐧𝐭 𝐎𝐩𝐭𝐢𝐨𝐧 Peabody continues to push its rare earth element (REE) narrative, emphasizing promising germanium concentrations found through expanded PRB drilling. While still early-stage and lacking commercial revenue, the aggressive pursuit of federal funding positions this as a strategic long-term pivot to extract value from legacy thermal footprints. 𝐎𝐭𝐡𝐞𝐫 𝐊𝐏𝐈𝐬 𝐅𝐫𝐞𝐞 𝐂𝐚𝐬𝐡 𝐅𝐥𝐨𝐰 (𝟐𝟔𝐐𝟏): $(55.4) million Reversing to negative. Calculated as $30.0M in Operating Cash Flow minus $85.4M in CapEx. This is a sharp deterioration from $49.5M in FCF a year ago (25Q1), exposing how the operational disruptions at Centurion are draining cash rather than generating it as previously forecasted. 𝐓𝐨𝐭𝐚𝐥 𝐋𝐢𝐪𝐮𝐢𝐝𝐢𝐭𝐲: $1,303.8 million Stable. Peabody maintains a robust balance sheet with $492.5M in cash and equivalents, plus $811.3M in restricted cash/collateral. Despite the net loss and cash burn this quarter, the company retains ample runway to fix operational issues without immediate financing stress. 𝐆𝐮𝐢𝐝𝐚𝐧𝐜𝐞 𝐅𝐘𝟐𝟔 𝐂𝐞𝐧𝐭𝐮𝐫𝐢𝐨𝐧 𝐕𝐨𝐥𝐮𝐦𝐞: 2.5 million tons Decelerating sharply. Previously guided in 2025 to reach 3.5 million tons in 2026. The delay of the next longwall move to early 2027 effectively lops 1 million premium tons off the annual forecast, heavily degrading expected full-year profitability. 𝟐𝟔𝐐𝟐 𝐒𝐞𝐚𝐛𝐨𝐫𝐧𝐞 𝐌𝐞𝐭 𝐂𝐨𝐬𝐭𝐬: $145 - $150 per ton Accelerating costs. Up from an already bloated $141.72 in Q1, and drastically higher than the $117.66 reported a year ago. This implies the segment will likely remain unprofitable in Q2 unless benchmark prices surge significantly. 𝟐𝟔𝐐𝟐 𝐒𝐞𝐚𝐛𝐨𝐫𝐧𝐞 𝐓𝐡𝐞𝐫𝐦𝐚𝐥 𝐕𝐨𝐥𝐮𝐦𝐞: 3.0 million tons Stable sequentially compared to 3.0 million tons in Q1. Expected costs of $57-$62 per ton imply a slight sequential margin squeeze compared to Q1's impressive $50.26 cost performance, likely due to a mix shift with unpriced higher ash product. 𝟐𝟔𝐐𝟐 𝐏𝐑𝐁 𝐌𝐚𝐫𝐠𝐢𝐧 𝐏𝐫𝐨𝐟𝐢𝐥𝐞: $0.00 - $0.50 per ton implied Decelerating. With a fixed price expectation of $13.50 and guided costs of $13.00-$13.50, Peabody is guiding PRB margins to razor-thin levels, emphasizing the urgency of cost containment in the domestic thermal fleet. 𝐊𝐞𝐲 𝐐𝐮𝐞𝐬𝐭𝐢𝐨𝐧𝐬 𝐂𝐞𝐧𝐭𝐮𝐫𝐢𝐨𝐧 𝐒𝐭𝐫𝐮𝐜𝐭𝐮𝐫𝐚𝐥 𝐈𝐧𝐭𝐞𝐠𝐫𝐢𝐭𝐲 You cited 'temporary equipment and roof control challenges' at Centurion. Given the delay of the next longwall move to 2027, are you confident these strata issues are geologically isolated, or is this a structural downgrade to the mine plan? 𝐒𝐞𝐚𝐛𝐨𝐫𝐧𝐞 𝐌𝐞𝐭 𝐏𝐫𝐨𝐟𝐢𝐭𝐚𝐛𝐢𝐥𝐢𝐭𝐲 With Q2 Seaborne Met costs guided to $145-$150 per ton and realizations at roughly ~75% of index, the segment appears poised for another loss. At what benchmark price does this segment return to breakeven under the revised mine plan? 𝐏𝐑𝐁 𝐌𝐚𝐫𝐠𝐢𝐧 𝐂𝐨𝐦𝐩𝐫𝐞𝐬𝐬𝐢𝐨𝐧 Q2 PRB guidance implies margins approaching zero. Is this purely a function of concentrated maintenance timing, or are there structural cost creep elements taking hold in the Powder River Basin?
Finsee tweet media
English
0
0
1
717
Finsee
Finsee@Finsee_main·
$CCJ Q1 2026 earnings: Profitability Surges on Pricing Shield, but Intentional Volume Deceleration Looms Cameco delivered a massive bottom-line beat in Q1 2026, with Adjusted EPS surging 193% to $0.47 and Adjusted EBITDA climbing 44% to $509 million. The underlying story is one of ruthless 'supply discipline.' The company is deliberately capping production and shrinking 2026 sales volume guidance (29-32M lbs vs 33M lbs in 2025) to force utilities into higher-priced, long-term contracts. This patience is paying off: USD realized prices climbed 6% YoY, shielding the company from market volatility. However, the quarter wasn't flawless—Operating Cash Flow abruptly reversed to negative $22 million, and Fuel Services margins experienced sharp compression. Full article with charts - link in bio 🐂 𝐁𝐮𝐥𝐥 𝐂𝐚𝐬𝐞 • 𝐏𝐫𝐢𝐜𝐢𝐧𝐠 𝐏𝐨𝐰𝐞𝐫 𝐢𝐧 𝐀𝐜𝐭𝐢𝐨𝐧 — The contract portfolio is functioning exactly as designed. Despite utilities deferring long-term contracting, Cameco's average USD realized price increased 6% to $66.21/lb. Gross profit in the Uranium segment jumped 28% to $259M. • 𝐖𝐞𝐬𝐭𝐢𝐧𝐠𝐡𝐨𝐮𝐬𝐞 𝐆𝐫𝐨𝐰𝐭𝐡 𝐄𝐧𝐠𝐢𝐧𝐞 — The 49% stake in Westinghouse continues to validate the acquisition thesis. Adjusted EBITDA (Cameco's share) rose 33% YoY to $122M, driven by steady core business performance and an expanding pipeline for new AP1000 reactor builds. 🐻 𝐁𝐞𝐚𝐫 𝐂𝐚𝐬𝐞 • 𝐍𝐞𝐠𝐚𝐭𝐢𝐯𝐞 𝐂𝐚𝐬𝐡 𝐅𝐥𝐨𝐰 𝐂𝐨𝐧𝐭𝐫𝐚𝐝𝐢𝐜𝐭𝐬 𝐄𝐚𝐫𝐧𝐢𝐧𝐠𝐬 — Despite reporting $131M in Net Income, Operating Cash Flow collapsed to negative $22M from positive $110M a year ago. This was driven by a $190M buildup in accounts receivable and $177M in cash tax payments. • 𝐅𝐮𝐞𝐥 𝐒𝐞𝐫𝐯𝐢𝐜𝐞𝐬 𝐌𝐚𝐫𝐠𝐢𝐧 𝐒𝐪𝐮𝐞𝐞𝐳𝐞 — The Fuel Services segment showed alarming deterioration. Average realized prices fell 14%, driving a 28% drop in Adjusted EBITDA to $54M. The Adjusted EBITDA margin compressed sharply from 56% to 40%. ⚖️ 𝐕𝐞𝐫𝐝𝐢𝐜𝐭: 🟢 Bullish. Management has the balance sheet ($1.1B in cash, $1B undrawn revolver) to play a waiting game. By deliberately holding back supply and contracting below replacement rates, they are squeezing the market. The short-term cash flow and margin blips are acceptable costs for capturing superior long-term contract economics. 𝐊𝐞𝐲 𝐓𝐡𝐞𝐦𝐞𝐬 🟢🟢 𝐒𝐭𝐫𝐢𝐜𝐭 𝐒𝐮𝐩𝐩𝐥𝐲 𝐃𝐢𝐬𝐜𝐢𝐩𝐥𝐢𝐧𝐞 𝐎𝐯𝐞𝐫 𝐕𝐨𝐥𝐮𝐦𝐞 Cameco is executing a deliberate strategy of supply constraint. Management refuses to 'front-run demand' with uncommitted pounds. McArthur River/Key Lake and Cigar Lake production is capped, and total 2026 uranium sales volume guidance implies a YoY contraction (midpoint 30.5M lbs vs 33M lbs in 2025). This artificial scarcity is designed to force utilities to accept higher floors ($70s) and ceilings ($130+) in upcoming long-term contract negotiations. 🟢 𝐖𝐞𝐬𝐭𝐢𝐧𝐠𝐡𝐨𝐮𝐬𝐞 𝐄𝐱𝐩𝐚𝐧𝐝𝐢𝐧𝐠 𝐓𝐨𝐭𝐚𝐥 𝐀𝐝𝐝𝐫𝐞𝐬𝐬𝐚𝐛𝐥𝐞 𝐌𝐚𝐫𝐤𝐞𝐭 Westinghouse is transforming from a services business into a high-growth infrastructure engine. The IP settlement with Korea shifted a major competitor into a collaborator, unlocking markets like Czechia for new AP1000 builds. Management frames every new AP1000 reactor as an immediate $400M-$600M EBITDA injection during construction, followed by 80-100 years of captive core servicing revenue. 🔴 𝐎𝐩𝐞𝐫𝐚𝐭𝐢𝐧𝐠 𝐂𝐚𝐬𝐡 𝐅𝐥𝐨𝐰 𝐃𝐞𝐜𝐨𝐮𝐩𝐥𝐞𝐬 𝐟𝐫𝐨𝐦 𝐍𝐞𝐭 𝐈𝐧𝐜𝐨𝐦𝐞 [NEW] A major red flag buried in the stellar earnings beat: Operating Cash Flow reversed from $110M generated in 25Q1 to $22M consumed in 26Q1. This massive $132M negative swing contradicts the narrative of record profitability. It was primarily driven by a $190M surge in accounts receivable and heavily front-loaded cash tax payments ($177M paid in the quarter). If collections do not normalize in Q2, this could signal working capital strain. 🔴 𝐅𝐮𝐞𝐥 𝐒𝐞𝐫𝐯𝐢𝐜𝐞𝐬 𝐌𝐚𝐫𝐠𝐢𝐧 𝐂𝐨𝐦𝐩𝐫𝐞𝐬𝐬𝐢𝐨𝐧 [NEW] The Fuel Services segment abruptly shifted from a growth driver to a laggard. Despite a 17% increase in sales volume (2.8M kgU), segment revenue fell 1% and Adjusted EBITDA plummeted 28% YoY. Management attributed this to a lower average realized price ($48.53 vs $56.64) tied to legacy contract mix and a strengthening Canadian dollar. The Adjusted EBITDA margin decelerated dramatically to 40% from 56% a year ago. ⚪ 𝐌𝐚𝐜𝐫𝐨 𝐑𝐢𝐬𝐤: 𝐓𝐚𝐫𝐢𝐟𝐟𝐬 𝐚𝐧𝐝 𝐓𝐫𝐚𝐝𝐞 𝐔𝐧𝐜𝐞𝐫𝐭𝐚𝐢𝐧𝐭𝐲 Management explicitly cited growing macro risks, including the potential for U. S. tariffs on Canadian energy products and a new Section 232 investigation into critical minerals. While uranium has largely been exempt under CUSMA structures, the geopolitical volatility remains a persistent overhang on long-term contracting dynamics. 🟢 𝐓𝐞𝐜𝐡𝐧𝐨𝐥𝐨𝐠𝐢𝐜𝐚𝐥 𝐈𝐧𝐧𝐨𝐯𝐚𝐭𝐢𝐨𝐧 𝐯𝐢𝐚 𝐆𝐥𝐨𝐛𝐚𝐥 𝐋𝐚𝐬𝐞𝐫 𝐄𝐧𝐫𝐢𝐜𝐡𝐦𝐞𝐧𝐭 (𝐆𝐋𝐄) Cameco's 49% stake in GLE represents a strategic leap into next-generation SILEX laser enrichment technology. Having derisked the science (TRL-6), the focus has shifted to commercial scalability (TRL 7-9). The primary near-term catalyst is the U. S. Department of Energy (DOE) tails re-enrichment project by 2030, which management views as an 'aboveground mine' capable of producing 4-5 million pounds of equivalent uranium annually without touching a shovel. ⚪ 𝐆𝐀𝐀𝐏 𝐍𝐞𝐭 𝐋𝐨𝐬𝐬𝐞𝐬 𝐚𝐭 𝐖𝐞𝐬𝐭𝐢𝐧𝐠𝐡𝐨𝐮𝐬𝐞 While Westinghouse generates strong Adjusted EBITDA ($122M Cameco share), it reported a GAAP net loss of $46M for the quarter. This persistent GAAP unprofitability is driven by heavy purchase accounting inventory revaluations and a $97M D&A burden stemming from the acquisition price. Until these acquisition-related amortizations clear, Westinghouse will remain a drag on Cameco's consolidated statutory net income. 𝐎𝐭𝐡𝐞𝐫 𝐊𝐏𝐈𝐬 𝐂𝐑𝐀 𝐓𝐚𝐱 𝐃𝐢𝐬𝐩𝐮𝐭𝐞 𝐒𝐞𝐜𝐮𝐫𝐢𝐭𝐲: $559 Million Stable. Canada Revenue Agency continues to hold $209M in cash and $350M in letters of credit tied to ongoing transfer pricing disputes for tax years 2007-2018. While Cameco secured favorable Supreme Court rulings for 2003-2006, the timeline for recovering these locked-up capital reserves remains uncertain, representing a massive, trapped liquidity pool. 𝐉𝐕 𝐈𝐧𝐤𝐚𝐢 𝐂𝐨𝐧𝐭𝐫𝐢𝐛𝐮𝐭𝐢𝐨𝐧 (𝐀𝐝𝐣𝐮𝐬𝐭𝐞𝐝 𝐄𝐁𝐈𝐓𝐃𝐀): $115 Million Accelerating. The equity earnings from the Kazakh joint venture surged to $115M from $42M in 25Q1. This was heavily influenced by the timing of sales, demonstrating the volatile but highly lucrative nature of the Inkai asset. A post-quarter dividend of US$124M was secured, bolstering Cameco's cash reserves. 𝐆𝐮𝐢𝐝𝐚𝐧𝐜𝐞 𝐅𝐘𝟐𝟔 𝐂𝐨𝐧𝐬𝐨𝐥𝐢𝐝𝐚𝐭𝐞𝐝 𝐑𝐞𝐯𝐞𝐧𝐮𝐞: $3.13 - $3.37 Billion Decelerating. The $3.25B midpoint implies a ~6.6% YoY contraction compared to FY25's actual revenue of $3.48B. This top-line shrinkage is entirely intentional, driven by management's refusal to layer in low-margin volume just to show growth. 𝐅𝐘𝟐𝟔 𝐔𝐫𝐚𝐧𝐢𝐮𝐦 𝐒𝐚𝐥𝐞𝐬 𝐕𝐨𝐥𝐮𝐦𝐞: 29.0 - 32.0 Million lbs Decelerating. The midpoint of 30.5M lbs is down from the 33.0M lbs sold in FY25. This deliberate volume constriction is the primary driver of the lower revenue guidance. 𝐅𝐘𝟐𝟔 𝐖𝐞𝐬𝐭𝐢𝐧𝐠𝐡𝐨𝐮𝐬𝐞 𝐀𝐝𝐣𝐮𝐬𝐭𝐞𝐝 𝐄𝐁𝐈𝐓𝐃𝐀 (𝐂𝐚𝐦𝐞𝐜𝐨 𝐒𝐡𝐚𝐫𝐞): US$370 - US$430 Million Reversing. Down from the massive US$780M generated in 2025. However, this is expected: 2025 results were heavily skewed by a one-time US$170M payment related to the Czech Dukovany project. Adjusted for that anomaly, the core servicing business is expected to remain stable, aligned with historic 16-19% margins. 𝐅𝐘𝟐𝟔 𝐅𝐮𝐞𝐥 𝐒𝐞𝐫𝐯𝐢𝐜𝐞𝐬 𝐏𝐫𝐨𝐝𝐮𝐜𝐭𝐢𝐨𝐧: 13.0 - 14.0 Million kgU Stable. In line with the 14.0M kgU produced in FY25, indicating that Port Hope operations have reached a steady-state capacity utilization rhythm. 𝐊𝐞𝐲 𝐐𝐮𝐞𝐬𝐭𝐢𝐨𝐧𝐬 𝐖𝐨𝐫𝐤𝐢𝐧𝐠 𝐂𝐚𝐩𝐢𝐭𝐚𝐥 𝐒𝐭𝐫𝐚𝐢𝐧 Accounts receivable spiked by $190M in Q1, driving Operating Cash Flow into negative territory. Is this purely an artifact of backend-loaded quarter sales timing, or are there extended payment terms creeping into the new contracts? 𝐅𝐮𝐞𝐥 𝐒𝐞𝐫𝐯𝐢𝐜𝐞𝐬 𝐌𝐚𝐫𝐠𝐢𝐧 𝐅𝐥𝐨𝐨𝐫 Adjusted EBITDA margins in Fuel Services plummeted from 56% to 40%. Is this the new baseline due to legacy contract mechanics, or should we expect a recovery in H2 2026 as older contracts roll off? 𝐖𝐞𝐬𝐭𝐢𝐧𝐠𝐡𝐨𝐮𝐬𝐞 𝐍𝐞𝐰 𝐁𝐮𝐢𝐥𝐝 𝐂𝐨𝐧𝐯𝐞𝐫𝐬𝐢𝐨𝐧𝐬 The $80B U. S. government partnership is a massive headline, but when will this non-binding political framework translate into actual, binding, long-lead item orders that show up in the Westinghouse backlog? 𝐉𝐕 𝐈𝐧𝐤𝐚𝐢 𝐋𝐨𝐠𝐢𝐬𝐭𝐢𝐜𝐚𝐥 𝐑𝐞𝐬𝐢𝐥𝐢𝐞𝐧𝐜𝐞 Given the ongoing geopolitical tension and sulfuric acid shortages in Kazakhstan, how confident is management in the logistics of transporting the remaining 4.2M lb 2026 purchase allocation via the Trans-Caspian route before year-end?
Finsee tweet media
English
0
0
3
590
Finsee
Finsee@Finsee_main·
$ET Q1 2026 earnings: Record EBITDA Surge Masks Bottom-Line Drag Energy Transfer reported a blowout quarter for its top-line operating metrics, with Adjusted EBITDA surging 20% YoY to $4.94 billion and volumes hitting records across the NGL and crude value chains. This momentum prompted management to raise full-year EBITDA guidance to $18.4 billion at the midpoint. However, beneath the surface, the story is more complex. The EBITDA surge was disproportionately driven by the Sunoco LP segment, fueled by acquisitions and a $102 million one-time inventory gain. Meanwhile, Net Income to common partners actually declined 5% YoY to $1.25 billion, squeezed by a 17% jump in interest expense, higher depreciation, and a massive increase in income attributed to noncontrolling interests. The operational business is thriving, particularly in supplying natural gas to data centers, but debt costs and outside ownership are diluting the returns flowing to common unitholders. Full article with charts - link in bio 🐂 𝐁𝐮𝐥𝐥 𝐂𝐚𝐬𝐞 • 𝐃𝐚𝐭𝐚 𝐂𝐞𝐧𝐭𝐞𝐫 & 𝐏𝐨𝐰𝐞𝐫 𝐌𝐞𝐠𝐚𝐩𝐫𝐨𝐣𝐞𝐜𝐭𝐬 𝐀𝐜𝐜𝐞𝐥𝐞𝐫𝐚𝐭𝐢𝐧𝐠 — The company is successfully contracting massive new infrastructure. Projects like the $5.6 billion Desert Southwest pipeline and the bidirectional Hugh Brinson pipeline position ET as the premier natural gas supplier for the AI and power generation boom. • 𝐍𝐆𝐋 𝐕𝐚𝐥𝐮𝐞 𝐂𝐡𝐚𝐢𝐧 𝐃𝐨𝐦𝐢𝐧𝐚𝐧𝐜𝐞 — Volume throughput is accelerating rapidly. NGL and refined product terminal volumes jumped 19%, NGL exports rose 19%, and fractionation volumes hit records, proving the integrated system's pricing power and scale. 🐻 𝐁𝐞𝐚𝐫 𝐂𝐚𝐬𝐞 • 𝐄𝐫𝐨𝐬𝐢𝐨𝐧 𝐨𝐟 𝐏𝐚𝐫𝐭𝐧𝐞𝐫 𝐏𝐫𝐨𝐟𝐢𝐭𝐚𝐛𝐢𝐥𝐢𝐭𝐲 — Despite a massive $839 million YoY jump in Adjusted EBITDA, Net Income attributable to partners fell. A $138 million increase in interest expense and a $331 million leap in noncontrolling interest deductions are eating the gains. • 𝐌𝐚𝐬𝐬𝐢𝐯𝐞 𝐂𝐚𝐩𝐄𝐱 𝐄𝐥𝐞𝐯𝐚𝐭𝐞𝐬 𝐄𝐱𝐞𝐜𝐮𝐭𝐢𝐨𝐧 𝐑𝐢𝐬𝐤 — Management bumped 2026 growth capital guidance to $5.5B–$5.9B. Managing the construction of massive multi-state pipelines introduces intense regulatory, inflationary, and timeline risks to the balance sheet. ⚖️ 𝐕𝐞𝐫𝐝𝐢𝐜𝐭: ⚪ Cautiously Bullish. The underlying volumetric growth and aggressive capture of data center demand are undeniably strong. Yet, investors must recognize that the headline 20% EBITDA growth is heavily distorted by Sunoco acquisitions and doesn't fully translate to the bottom line due to heavy debt loads. 𝐊𝐞𝐲 𝐓𝐡𝐞𝐦𝐞𝐬 🟢🟢 𝐃𝐚𝐭𝐚 𝐂𝐞𝐧𝐭𝐞𝐫 & 𝐏𝐨𝐰𝐞𝐫 𝐃𝐞𝐦𝐚𝐧𝐝 𝐅𝐮𝐞𝐥𝐬 𝐏𝐢𝐩𝐞𝐥𝐢𝐧𝐞 𝐄𝐱𝐩𝐚𝐧𝐬𝐢𝐨𝐧 [NEW] Management is aggressively converting the AI and power generation 'gold rush' into contracted infrastructure. Key growth engines include the Desert Southwest Pipeline (upsized to 48-inch, 2.3 Bcf/d capacity) and the Hugh Brinson Pipeline. They also announced a new agreement to support the Nexus Hubbard Campus, an AI hyperscale facility powered by behind-the-meter natural gas generation. This creates a highly visible, multi-decade cash flow runway. 🟢 𝐒𝐮𝐧𝐨𝐜𝐨 𝐋𝐏 𝐀𝐜𝐪𝐮𝐢𝐬𝐢𝐭𝐢𝐨𝐧 𝐒𝐩𝐫𝐞𝐞 𝐃𝐢𝐬𝐭𝐨𝐫𝐭𝐬 𝐑𝐮𝐧-𝐑𝐚𝐭𝐞 The 'Investment in Sunoco LP' segment was the heaviest lifter this quarter, with Adjusted EBITDA skyrocketing 87% to $858 million. This acceleration was driven by the Parkland and TanQuid acquisitions, coupled with a $102 million one-time gain on the sale of inventory. While highly accretive, investors should adjust run-rate expectations downward, as the one-time inventory gain will not repeat. 🔴 𝐌𝐢𝐝𝐬𝐭𝐫𝐞𝐚𝐦 𝐒𝐞𝐠𝐦𝐞𝐧𝐭 𝐏𝐫𝐨𝐟𝐢𝐭𝐬 𝐋𝐚𝐠 𝐕𝐨𝐥𝐮𝐦𝐞 𝐆𝐫𝐨𝐰𝐭𝐡 A clear red flag emerged in the Midstream segment: while gathered volumes grew 6%, Segment Adjusted EBITDA reversed direction, falling 4% YoY to $887 million. The drop was caused by lower NGL and natural gas prices (a $25 million hit) and the absence of a $160 million non-recurring gain from Winter Storm Uri recognized in the prior-year period. This highlights the segment's lingering sensitivity to commodity prices despite higher throughput. 🔴 𝐈𝐧𝐭𝐞𝐫𝐞𝐬𝐭 𝐁𝐮𝐫𝐝𝐞𝐧 𝐒𝐮𝐩𝐩𝐫𝐞𝐬𝐬𝐢𝐧𝐠 𝐍𝐞𝐭 𝐈𝐧𝐜𝐨𝐦𝐞 [NEW] Energy Transfer is paying a heavy toll for its debt-funded growth. Interest expense net of capitalized interest rose 17% YoY to $947 million for the quarter. Total long-term debt has now crept up to $69.3 billion. If interest costs remain near $1 billion per quarter, it creates a hard ceiling on the amount of operational growth that can flow through to common unitholders. ⚪ 𝐋𝐚𝐤𝐞 𝐂𝐡𝐚𝐫𝐥𝐞𝐬 𝐋𝐍𝐆 𝐎𝐟𝐟𝐢𝐜𝐢𝐚𝐥𝐥𝐲 𝐒𝐮𝐬𝐩𝐞𝐧𝐝𝐞𝐝 [NEW] Demonstrating capital discipline, management officially suspended development of the Lake Charles LNG project. Capital is being reallocated toward a backlog of pipeline projects that offer a 'more attractive risk/return profile.' This macro pivot confirms that ET is choosing the immediate, highly contracted returns of domestic data center/power supply over the complex, capital-intensive global LNG export market. 🟢 𝐈𝐧𝐭𝐞𝐠𝐫𝐚𝐭𝐞𝐝 𝐍𝐆𝐋 𝐕𝐚𝐥𝐮𝐞 𝐂𝐡𝐚𝐢𝐧 𝐁𝐮𝐢𝐥𝐝𝐨𝐮𝐭 The NGL segment is stable and growing. The Gateway NGL Pipeline debottlenecking entered service, feeding the Mont Belvieu fractionation complex. To support future export expansion, ET is constructing a massive 3-million-barrel ethane storage cavern (due H2 2027) and extended the majority of its Nederland ethane export agreements by 10 years into 2041. 𝐎𝐭𝐡𝐞𝐫 𝐊𝐏𝐈𝐬 𝐃𝐢𝐬𝐭𝐫𝐢𝐛𝐮𝐭𝐚𝐛𝐥𝐞 𝐂𝐚𝐬𝐡 𝐅𝐥𝐨𝐰 (𝐃𝐂𝐅) 𝐭𝐨 𝐏𝐚𝐫𝐭𝐧𝐞𝐫𝐬: $2.70 billion Accelerating. DCF grew 17% YoY from $2.31 billion, easily covering the $1.16 billion in limited partner distributions. The strong coverage ratio allows ET to fund a significant portion of its $1.53 billion quarterly growth CapEx from operating cash flows, rather than relying entirely on new debt. 𝐋𝐨𝐧𝐠-𝐓𝐞𝐫𝐦 𝐃𝐞𝐛𝐭: $69.3 billion Stable but elevated. Up slightly from $68.3 billion at the end of 2025. The company issued $3.0 billion in senior notes in January to refinance existing debt. Revolver capacity remains healthy at $3.45 billion, but the sheer size of the debt load continues to drive nearly $1 billion in quarterly interest expense. 𝐆𝐮𝐢𝐝𝐚𝐧𝐜𝐞 𝐅𝐘 𝟐𝟎𝟐𝟔 𝐀𝐝𝐣𝐮𝐬𝐭𝐞𝐝 𝐄𝐁𝐈𝐓𝐃𝐀: $18.2 - $18.6 billion Accelerating. Management raised the guidance range from the previous $17.45B - $17.85B. The new midpoint of $18.4 billion represents robust double-digit YoY growth from 2025 levels, heavily aided by the recent Sunoco and USAC acquisitions, alongside organic pipeline volume momentum. 𝐅𝐘 𝟐𝟎𝟐𝟔 𝐆𝐫𝐨𝐰𝐭𝐡 𝐂𝐚𝐩𝐢𝐭𝐚𝐥 𝐄𝐱𝐩𝐞𝐧𝐝𝐢𝐭𝐮𝐫𝐞𝐬: $5.5 - $5.9 billion Accelerating. Up from roughly $5.0 billion in prior expectations. The aggressive step-up is driven by natural gas network projects, including the upsized Desert Southwest Pipeline and the Hugh Brinson Pipeline. While this sets up long-term revenue, it heightens near-term execution and balance sheet risks. 𝐊𝐞𝐲 𝐐𝐮𝐞𝐬𝐭𝐢𝐨𝐧𝐬 𝐒𝐮𝐧𝐨𝐜𝐨 𝐋𝐏 𝐍𝐨𝐫𝐦𝐚𝐥𝐢𝐳𝐞𝐝 𝐑𝐮𝐧-𝐑𝐚𝐭𝐞 Sunoco LP drove a massive EBITDA beat this quarter, aided by a $102M one-time inventory gain and recent acquisitions. What is the normalized quarterly EBITDA run-rate we should model for this segment for the rest of 2026? 𝐌𝐚𝐧𝐚𝐠𝐢𝐧𝐠 𝐭𝐡𝐞 𝐈𝐧𝐭𝐞𝐫𝐞𝐬𝐭 𝐁𝐮𝐫𝐝𝐞𝐧 Interest expense is approaching $1 billion per quarter and absorbing a large portion of operating profit growth. With $5.5B+ in growth CapEx planned for 2026, what is your strategy to prevent rising debt costs from continually suppressing net income to common partners? 𝐋𝐚𝐤𝐞 𝐂𝐡𝐚𝐫𝐥𝐞𝐬 𝐋𝐍𝐆 𝐓𝐞𝐫𝐦𝐢𝐧𝐚𝐥 𝐀𝐥𝐭𝐞𝐫𝐧𝐚𝐭𝐢𝐯𝐞 𝐔𝐬𝐞𝐬 With the Lake Charles LNG development officially suspended to prioritize higher-return domestic pipeline projects, are you actively seeking third-party buyers for the site, or considering alternative industrial uses for the footprint? 𝐌𝐢𝐝𝐬𝐭𝐫𝐞𝐚𝐦 𝐂𝐨𝐦𝐦𝐨𝐝𝐢𝐭𝐲 𝐒𝐞𝐧𝐬𝐢𝐭𝐢𝐯𝐢𝐭𝐲 The Midstream segment saw EBITDA decline 4% YoY despite a 6% volume increase, partially due to a $25M hit from lower commodity prices. How much commodity price sensitivity remains unhedged in your revised $18.4 billion EBITDA guidance for the year?
Finsee tweet media
English
0
0
0
660
Finsee
Finsee@Finsee_main·
$CMI Q1 2026 earnings: Guidance Raised as Data Center Boom Masks Legacy Truck Weakness Cummins is riding two completely different economic waves. Overall revenue grew 3% YoY to $8.4B, and management confidently raised FY26 guidance across the board. The bullishness stems from an absolute explosion in the Power Systems segment, where data center backup demand drove margins to a staggering 29.5%. However, the core Engine and Components segments remain bogged down by a cyclical trough in the North American truck market, suffering steep margin compression. Furthermore, bottom-line earnings dropped 21% as Cummins took a $199M charge to exit the low-pressure fuel cell business—a necessary amputation for the bleeding Accelera segment. Full article with charts - link in bio 🐂 𝐁𝐮𝐥𝐥 𝐂𝐚𝐬𝐞 • 𝐍𝐨𝐫𝐭𝐡 𝐀𝐦𝐞𝐫𝐢𝐜𝐚𝐧 𝐓𝐫𝐮𝐜𝐤 𝐁𝐨𝐭𝐭𝐨𝐦𝐢𝐧𝐠 — CEO Jennifer Rumsey explicitly stated that the North American truck market has 'begun to improve from a cyclical low.' This turning point is the primary catalyst for the raised 2026 revenue guidance. • 𝐃𝐚𝐭𝐚 𝐂𝐞𝐧𝐭𝐞𝐫 𝐒𝐞𝐜𝐮𝐥𝐚𝐫 𝐓𝐚𝐢𝐥𝐰𝐢𝐧𝐝 — Power Systems is operating in a different universe. With data center demand continuously outstripping expectations, the segment achieved near 30% margins, proving Cummins is successfully monetizing the AI infrastructure boom. 🐻 𝐁𝐞𝐚𝐫 𝐂𝐚𝐬𝐞 • 𝐋𝐞𝐠𝐚𝐜𝐲 𝐌𝐚𝐫𝐠𝐢𝐧𝐬 𝐇𝐚𝐥𝐯𝐞𝐝 — Engine segment EBITDA margin plummeted to 10.4% from 16.5% a year ago. Even as volume recovers, recovering that lost pricing power and operational leverage will take time. • 𝐀𝐜𝐜𝐞𝐥𝐞𝐫𝐚 𝐑𝐞𝐦𝐚𝐢𝐧𝐬 𝐚 𝐂𝐚𝐬𝐡 𝐒𝐢𝐧𝐤 — Despite exiting the low-pressure fuel cell business, Accelera still posted a $277M EBITDA loss (including the $199M charge). The pivot to zero-emissions continues to heavily dilute overall company profitability. ⚖️ 𝐕𝐞𝐫𝐝𝐢𝐜𝐭: 🟢 Bullish. While the Engine segment is currently lagging, the macro environment is shifting in Cummins' favor. Raising full-year guidance in Q1 signals immense confidence. Power Systems is a proven cash cow, and management is finally taking the axe to Accelera's structural losers. 𝐊𝐞𝐲 𝐓𝐡𝐞𝐦𝐞𝐬 🟢 𝐏𝐨𝐰𝐞𝐫 𝐒𝐲𝐬𝐭𝐞𝐦𝐬: 𝐓𝐡𝐞 𝐂𝐫𝐨𝐰𝐧 𝐉𝐞𝐰𝐞𝐥 Power Systems is accelerating dramatically. Revenues jumped 19% YoY to $2.0B, and EBITDA surged to $577M. The 29.5% margin is a massive expansion from 23.6% a year ago. Management cited unabated demand for power generation from data centers in North America, China, and Asia Pacific as the primary catalyst. This is no longer just a cyclical segment; it is a structural growth engine. 🔴 𝐄𝐧𝐠𝐢𝐧𝐞 𝐒𝐞𝐠𝐦𝐞𝐧𝐭 𝐃𝐢𝐬𝐜𝐨𝐧𝐧𝐞𝐜𝐭 The Engine segment is decelerating and acting as a heavy anchor on consolidated results. Sales fell 4% YoY to $2.7B, driven by a 12% drop in North American revenues. More concerning is the margin collapse: EBITDA margin cratered from 16.5% in 25Q1 to 10.4% in 26Q1. This highlights extreme negative operating leverage when North American medium- and heavy-duty truck volumes contract. 🟢 𝐀𝐜𝐜𝐞𝐥𝐞𝐫𝐚 𝐏𝐫𝐮𝐧𝐢𝐧𝐠: 𝐄𝐱𝐢𝐭𝐢𝐧𝐠 𝐋𝐨𝐰-𝐏𝐫𝐞𝐬𝐬𝐮𝐫𝐞 𝐅𝐮𝐞𝐥 𝐂𝐞𝐥𝐥𝐬 [NEW] Management is forcefully responding to the hydrogen market's deterioration. Following $458M in electrolyzer-related write-downs in 2025, Cummins took a $199M charge in Q1 to complete the sale of its low-pressure fuel cell business and settle related obligations. This disciplined approach to cutting perpetual loss-makers is painful now but will protect long-term margins. ⚪ 𝐂𝐡𝐢𝐧𝐚 𝐑𝐞𝐜𝐨𝐯𝐞𝐫𝐲 𝐁𝐨𝐨𝐬𝐭𝐢𝐧𝐠 𝐈𝐧𝐭𝐞𝐫𝐧𝐚𝐭𝐢𝐨𝐧𝐚𝐥 𝐑𝐞𝐯𝐞𝐧𝐮𝐞𝐬 [NEW] While North America struggled, international revenues provided a crucial offset, increasing 16% YoY globally. Management specifically highlighted stronger demand in China across multiple segments—Engine (+22% international sales largely due to China construction), Components (+6% international sales), and Power Systems. This geographical diversification is actively cushioning the domestic cyclical trough. 🔴 𝐖𝐨𝐫𝐤𝐢𝐧𝐠 𝐂𝐚𝐩𝐢𝐭𝐚𝐥 𝐂𝐨𝐧𝐬𝐮𝐦𝐢𝐧𝐠 𝐂𝐚𝐬𝐡 𝐅𝐥𝐨𝐰 [NEW] A potential red flag in the cash flow statement: Operating Cash Flow came in at $309M, significantly trailing the $680M Consolidated Net Income. This divergence was primarily driven by a massive $678M sequential spike in Accounts Receivable. While this could just be the timing of billings tied to the 16% jump in international sales, a working capital build of this magnitude requires close monitoring in Q2. 🟢 𝐕𝐨𝐜𝐚𝐭𝐢𝐨𝐧𝐚𝐥 𝐚𝐧𝐝 𝐈𝐧𝐟𝐫𝐚𝐬𝐭𝐫𝐮𝐜𝐭𝐮𝐫𝐞 𝐇𝐚𝐫𝐝𝐰𝐚𝐫𝐞 𝐈𝐧𝐭𝐞𝐠𝐫𝐚𝐭𝐢𝐨𝐧 [NEW] Cummins is securing its footprint in heavy infrastructure hardware. The company successfully integrated the new X10 engine into the Mack Granite Chassis, locking in a critical vocational truck platform ahead of upcoming 2027 EPA emissions standards. 𝐎𝐭𝐡𝐞𝐫 𝐊𝐏𝐈𝐬 𝐃𝐢𝐬𝐭𝐫𝐢𝐛𝐮𝐭𝐢𝐨𝐧 𝐒𝐞𝐠𝐦𝐞𝐧𝐭 𝐑𝐞𝐯𝐞𝐧𝐮𝐞: $3.12 billion Accelerating. Up 7% YoY, heavily driven by increased demand for power generation products, especially in data center applications. Segment EBITDA margin expanded to 14.2% from 12.9%, proving that downstream parts and service attached to the data center boom are highly lucrative. 𝐀𝐝𝐣𝐮𝐬𝐭𝐞𝐝 𝐄𝐁𝐈𝐓𝐃𝐀 𝐌𝐚𝐫𝐠𝐢𝐧: 17.7% Stable. When stripping out the $199M special charge for the fuel cell exit, adjusted EBITDA margin came in at 17.7%, essentially flat vs the 17.9% reported in the prior year. This proves that Power Systems and Distribution strength completely offset the severe weakness in the Engine business. 𝐆𝐮𝐢𝐝𝐚𝐧𝐜𝐞 𝐅𝐘𝟐𝟔 𝐑𝐞𝐯𝐞𝐧𝐮𝐞 𝐆𝐫𝐨𝐰𝐭𝐡: +8% to +11% Accelerating. Raised significantly from the prior outlook of +3% to +8%. Considering Q1 revenue only grew 3%, this implies a massive acceleration in the back three quarters of 2026, resting entirely on the expectation that the North American truck market is recovering from its cyclical low. 𝐅𝐘𝟐𝟔 𝐄𝐁𝐈𝐓𝐃𝐀 𝐌𝐚𝐫𝐠𝐢𝐧: 17.75% to 18.50% Accelerating. Increased from the previous range of 17.0% to 18.0%. This excludes the Q1 Accelera charges. Achieving the midpoint (18.1%) requires the Engine segment to recover its historical operating leverage as truck volumes return, alongside sustained pricing power in Power Systems. 𝐊𝐞𝐲 𝐐𝐮𝐞𝐬𝐭𝐢𝐨𝐧𝐬 𝐄𝐧𝐠𝐢𝐧𝐞 𝐌𝐚𝐫𝐠𝐢𝐧 𝐒𝐭𝐫𝐮𝐜𝐭𝐮𝐫𝐚𝐥 𝐃𝐚𝐦𝐚𝐠𝐞? Engine segment margins collapsed by 600 basis points YoY despite only a 4% sales decline. How much of this is pure volume deleveraging versus pricing concessions, and what is the exact volume threshold needed to return to 15%+ margins? 𝐀𝐜𝐜𝐨𝐮𝐧𝐭𝐬 𝐑𝐞𝐜𝐞𝐢𝐯𝐚𝐛𝐥𝐞 𝐒𝐩𝐢𝐤𝐞 Accounts Receivable increased by $678 million in Q1, heavily suppressing operating cash flow. Was this strictly due to the timing of international sales in China, or are there extended payment terms being offered to incentivize orders? 𝐅𝐮𝐭𝐮𝐫𝐞 𝐨𝐟 𝐀𝐜𝐜𝐞𝐥𝐞𝐫𝐚 After exiting the low-pressure fuel cell business and halting commercial electrolyzer activity in late 2025, what exactly remains in the Accelera portfolio? Is management targeting a specific timeline to break-even, or should investors expect continued nine-figure write-downs?
Finsee tweet media
English
0
0
1
421
Finsee
Finsee@Finsee_main·
$AGCO Q1 2026 earnings: Top-Line Rebounds, But Deep Regional Margin Fractures Emerge AGCO delivered a striking 14.3% YoY revenue jump to $2.34B, reversing a year-long trajectory of top-line contraction. Adjusted EPS more than doubled to $0.94. However, the headline beats mask a severely polarized business. The Europe/Middle East (EME) segment is single-handedly carrying the company, printing near-record 16.2% operating margins. Meanwhile, profitability in the Americas has completely collapsed, with North America (NA) and Latin America (LATAM) posting staggering -12.5% and -19.3% operating margins, respectively. A strategic decision to sell its NA finance joint venture stake for $190M will fund an immediate $350M share repurchase program, helping management lift the FY26 EPS outlook to ~$6.00. Full article with charts - link in bio 🐂 𝐁𝐮𝐥𝐥 𝐂𝐚𝐬𝐞 • 𝐄𝐮𝐫𝐨𝐩𝐞 𝐢𝐬 𝐚 𝐏𝐫𝐨𝐟𝐢𝐭 𝐉𝐮𝐠𝐠𝐞𝐫𝐧𝐚𝐮𝐭 — The EME segment is exhibiting Accelerating strength. Sales grew 20.3% YoY (9.0% constant currency) and operating income jumped by $104.6M. The 16.2% operating margin proves AGCO's ability to extract immense value from favorable regional product mixes. • 𝐀𝐠𝐠𝐫𝐞𝐬𝐬𝐢𝐯𝐞 𝐂𝐚𝐩𝐢𝐭𝐚𝐥 𝐑𝐞𝐭𝐮𝐫𝐧𝐬 — Selling the US/Canada finance JV stake unlocks $190M, directly funding a $350M Q2 buyback. Coupled with a dividend increase, management is engineering EPS growth independent of end-market macro conditions. 🐻 𝐁𝐞𝐚𝐫 𝐂𝐚𝐬𝐞 • 𝐓𝐡𝐞 𝐀𝐦𝐞𝐫𝐢𝐜𝐚𝐬 𝐀𝐫𝐞 𝐁𝐥𝐞𝐞𝐝𝐢𝐧𝐠 𝐂𝐚𝐬𝐡 — NA operating margins fell to -12.5% and LATAM plummeted to -19.3%. Tariffs, softer industry demand, and negative pricing are destroying regional unit economics, casting a shadow over the global margin profile. • 𝐔𝐧𝐝𝐞𝐫𝐥𝐲𝐢𝐧𝐠 𝐑𝐞𝐭𝐚𝐢𝐥 𝐌𝐚𝐫𝐤𝐞𝐭 𝐑𝐞𝐦𝐚𝐢𝐧𝐬 𝐖𝐞𝐚𝐤 — Despite AGCO's revenue growth, macro retail sales show Decelerating demand. Brazil combine volumes collapsed 38% YoY, and NA tractor sales fell 8%, meaning AGCO's top-line beat may be driven more by favorable comps and dealer restock timing than genuine end-user demand recovery. ⚖️ 𝐕𝐞𝐫𝐝𝐢𝐜𝐭: ⚪ Neutral. Management is pulling the right levers—cutting costs, repurchasing shares, and leaning on European strength—to manufacture EPS growth. However, the catastrophic margin deterioration in North and South America makes the current earnings structure highly fragile. 𝐊𝐞𝐲 𝐓𝐡𝐞𝐦𝐞𝐬 🔴🔴 𝐀𝐦𝐞𝐫𝐢𝐜𝐚𝐬 𝐌𝐚𝐫𝐠𝐢𝐧 𝐂𝐨𝐥𝐥𝐚𝐩𝐬𝐞 [NEW] A severe Reversing trend in regional profitability. In Q1 2026, NA operating income dropped $26.8M YoY, plunging margins to -12.5%. LATAM fared even worse, with operating income dropping $47.4M and margins collapsing to -19.3%. This contradicts the positive narrative of AGCO's top-line recovery: in NA, sales actually grew 10% YoY, yet the segment lost money. Management blamed higher tariff-related input costs in NA, and a toxic cocktail of 30.3% lower constant-currency sales and negative pricing in LATAM. 🟢 𝐄𝐮𝐫𝐨𝐩𝐞 (𝐄𝐌𝐄) 𝐒𝐭𝐚𝐛𝐢𝐥𝐢𝐳𝐞𝐬 𝐭𝐡𝐞 𝐒𝐡𝐢𝐩 EME remains AGCO's operational anchor, demonstrating a Stable and highly profitable trajectory. Q1 sales grew 20.3% to $1.6B (9.0% constant currency), driven by higher volumes and strong high-horsepower tractor sales in Germany and the UK. With operating margins at 16.2%, EME is generating more than enough profit ($259M) to cover the losses in the Americas and fund corporate overhead. 🟢 𝐒𝐭𝐫𝐚𝐭𝐞𝐠𝐢𝐜 𝐃𝐢𝐯𝐞𝐬𝐭𝐢𝐭𝐮𝐫𝐞 𝐅𝐮𝐧𝐝𝐬 𝐈𝐦𝐦𝐞𝐝𝐢𝐚𝐭𝐞 𝐁𝐮𝐲𝐛𝐚𝐜𝐤𝐬 [NEW] Management executed a shrewd capital engineering move: selling its 49% equity interest in AGCO Finance LLC (US/Canada) to Rabobank for $190M. This optimized regulatory capital efficiency and freed up cash, which management is immediately deploying into a $350M share repurchase program in Q2 2026. This Accelerating pace of buybacks serves as a massive EPS support mechanism. 🔴 𝐌𝐚𝐜𝐫𝐨 𝐖𝐞𝐚𝐤𝐧𝐞𝐬𝐬: 𝐑𝐞𝐭𝐚𝐢𝐥 𝐒𝐚𝐥𝐞𝐬 𝐏𝐥𝐮𝐧𝐠𝐞 The macro backdrop remains deeply challenging. Decelerating farmer profitability, high financing costs, and ample global crop supplies continue to suppress demand. Q1 2026 industry retail unit sales were overwhelmingly negative: NA Combines (-7%), NA Tractors (-8%), Brazil Combines (-38%), and Brazil Tractors (-10%). Only Western Europe tractors showed life (+7%). ⚪ 𝐏𝐫𝐞𝐜𝐢𝐬𝐢𝐨𝐧 𝐀𝐠 𝐚𝐧𝐝 𝐇𝐢𝐠𝐡-𝐇𝐨𝐫𝐬𝐞𝐩𝐨𝐰𝐞𝐫 𝐎𝐮𝐭𝐩𝐞𝐫𝐟𝐨𝐫𝐦𝐚𝐧𝐜𝐞 Despite weak industry unit sales, AGCO managed to outpace the market. A key driver is the ongoing mix shift toward high-horsepower equipment (specifically in NA and EME) and the sustained adoption of smart farming technologies. As farmers try to navigate breakeven crop prices, they are prioritizing efficiency technologies over basic fleet replacement, validating AGCO's 'Farmer-First' portfolio strategy. 🔴 𝐓𝐚𝐫𝐢𝐟𝐟 𝐂𝐨𝐬𝐭𝐬 𝐄𝐫𝐨𝐝𝐞 𝐆𝐫𝐨𝐬𝐬 𝐏𝐫𝐨𝐟𝐢𝐭 The ongoing US tariff situation remains a significant operational headwind. Management explicitly cited tariff-related input costs as the primary reason NA margins turned negative despite 10% top-line growth. While AGCO has mitigation actions and sourcing strategies in place, they are currently insufficient to protect regional profitability. 𝐎𝐭𝐡𝐞𝐫 𝐊𝐏𝐈𝐬 𝐎𝐩𝐞𝐫𝐚𝐭𝐢𝐧𝐠 𝐂𝐚𝐬𝐡 𝐅𝐥𝐨𝐰 (𝟐𝟔𝐐𝟏): -$410.4 million Decelerating. Cash burn nearly doubled compared to the -$212.2M reported in 25Q1. This massive outflow was heavily driven by a $284.1M buildup in inventory and a $254.2M reduction in accrued expenses. Management needs to prove this is merely seasonal timing and production alignment, rather than a structural buildup of unsold goods. 𝐆𝐮𝐢𝐝𝐚𝐧𝐜𝐞 𝐅𝐘𝟐𝟔 𝐍𝐞𝐭 𝐒𝐚𝐥𝐞𝐬: $10.5 - $10.7 billion Stable. This implies moderate top-line growth compared to the estimated ~$9.8B in FY25 (assuming the company hit its latest prior-year targets). Volume is expected to remain relatively flat to slightly lower, meaning any revenue growth will be completely dependent on pricing and favorable currency translation. 𝐅𝐘𝟐𝟔 𝐀𝐝𝐣𝐮𝐬𝐭𝐞𝐝 𝐄𝐏𝐒: ~$6.00 Accelerating. The outlook was raised to approximately $6.00. This implies solid bottom-line growth, driven primarily by cost controls, positive pricing, and the newly announced $350M share repurchase program shrinking the denominator. 𝐅𝐘𝟐𝟔 𝐀𝐝𝐣𝐮𝐬𝐭𝐞𝐝 𝐎𝐩𝐞𝐫𝐚𝐭𝐢𝐧𝐠 𝐌𝐚𝐫𝐠𝐢𝐧: 7.5% - 8.0% Stable. Guidance implies a slight improvement or flat performance compared to the ~7.5% generated in FY25. Achieving this will require EME to maintain its historically high margins while management attempts to staunch the severe bleeding in the NA and LATAM segments. 𝐊𝐞𝐲 𝐐𝐮𝐞𝐬𝐭𝐢𝐨𝐧𝐬 𝐓𝐢𝐦𝐞𝐥𝐢𝐧𝐞 𝐟𝐨𝐫 𝐀𝐦𝐞𝐫𝐢𝐜𝐚𝐬 𝐌𝐚𝐫𝐠𝐢𝐧 𝐑𝐞𝐜𝐨𝐯𝐞𝐫𝐲 North America and LATAM posted severe operating margin losses in Q1 despite divergent top-line trends. What is the specific timeline and operational bridge required to return both regions to historical mid-single-digit profitability? 𝐎𝐩𝐞𝐫𝐚𝐭𝐢𝐧𝐠 𝐂𝐚𝐬𝐡 𝐅𝐥𝐨𝐰 𝐁𝐮𝐫𝐧 Q1 operating cash flow burn worsened significantly to -$410 million, driven by inventory build. Are these intentional inventory positions ahead of the planting season, or a symptom of dealer network bottlenecks? 𝐅𝐮𝐭𝐮𝐫𝐞 𝐉𝐨𝐢𝐧𝐭 𝐕𝐞𝐧𝐭𝐮𝐫𝐞 𝐌𝐨𝐧𝐞𝐭𝐢𝐳𝐚𝐭𝐢𝐨𝐧 Following the sale of the NA finance joint ventures to Rabobank for $190 million, management noted they will evaluate similar agreements globally. What is the potential timeline and cash value for divesting remaining global JV stakes? 𝐓𝐚𝐫𝐢𝐟𝐟 𝐌𝐢𝐭𝐢𝐠𝐚𝐭𝐢𝐨𝐧 𝐄𝐟𝐟𝐢𝐜𝐚𝐜𝐲 Tariff-related input costs drove North America into negative margin territory despite 10% revenue growth. Are current mitigation strategies (sourcing changes, pricing) fundamentally capable of offsetting these costs in H2 2026, or is this a structural margin reset for the region?
Finsee tweet media
English
0
1
2
592
Finsee
Finsee@Finsee_main·
$LIND Q1 2026 earnings: Record Occupancy Drives Strong Revenue, But Margin Headwinds Emerge Lindblad delivered a strong start to 2026, with revenue growing 16% YoY to $208M and generating positive net income of $6.0M. The core driver was an all-time high occupancy rate of 93%, up from 89% a year ago. However, the top-line success masks margin pressures in the core Lindblad segment, where Adjusted EBITDA grew just 6% due to higher voyage costs and the final step-up in National Geographic royalties. In contrast, the Land Experiences segment was the breakout star, doubling its operating profit. Forward guidance implies a decelerating growth trajectory for the full year. Full article with charts - link in bio 🐂 𝐁𝐮𝐥𝐥 𝐂𝐚𝐬𝐞 • 𝐔𝐧𝐩𝐫𝐞𝐜𝐞𝐝𝐞𝐧𝐭𝐞𝐝 𝐃𝐞𝐦𝐚𝐧𝐝 — Achieving 93% occupancy on expanded capacity shows tremendous pricing power and brand strength. Guests are absorbing higher prices, with net yields up 7% to $1,631. • 𝐋𝐚𝐧𝐝 𝐄𝐱𝐩𝐞𝐫𝐢𝐞𝐧𝐜𝐞𝐬 𝐁𝐫𝐞𝐚𝐤𝐨𝐮𝐭 — The Land segment is exhibiting massive operating leverage. Revenue grew 14%, but Adjusted EBITDA surged 88% YoY, diversifying profits away from the capital-intensive cruise segment. 🐻 𝐁𝐞𝐚𝐫 𝐂𝐚𝐬𝐞 • 𝐒𝐭𝐫𝐮𝐜𝐭𝐮𝐫𝐚𝐥 𝐂𝐨𝐬𝐭 𝐈𝐧𝐜𝐫𝐞𝐚𝐬𝐞𝐬 — The core Lindblad segment is facing a margin ceiling. The final royalty rate step-up from National Geographic, combined with higher voyage operating costs, severely restricted EBITDA growth to just 6%. • 𝐆𝐫𝐨𝐰𝐭𝐡 𝐃𝐞𝐜𝐞𝐥𝐞𝐫𝐚𝐭𝐢𝐨𝐧 — After a year of ~20% revenue growth in FY25, FY26 guidance implies top-line growth decelerating to mid-single digits (~7%), suggesting the post-pandemic occupancy recovery tailwind has played out. ⚖️ 𝐕𝐞𝐫𝐝𝐢𝐜𝐭: ⚪ Neutral. Lindblad is executing its strategy flawlessly—filling ships at record prices. But with occupancy mathematically capped near 93-95% and structural royalties eating into incremental cruise margins, future earnings growth will heavily depend on the smaller Land segment and capital-intensive new ship deployments. 𝐊𝐞𝐲 𝐓𝐡𝐞𝐦𝐞𝐬 🟢 𝐋𝐚𝐧𝐝 𝐄𝐱𝐩𝐞𝐫𝐢𝐞𝐧𝐜𝐞𝐬 𝐎𝐩𝐞𝐫𝐚𝐭𝐢𝐧𝐠 𝐋𝐞𝐯𝐞𝐫𝐚𝐠𝐞 [NEW] The Land Experiences segment has transformed from an ancillary offering into a major profit driver. Revenue grew 14% to $55.5M, but disciplined pricing and itinerary changes catapulted operating income 127% YoY to $5.0M. Adjusted EBITDA surged 88%. This segment requires less capital than the cruise division and is proving to be highly accretive to the bottom line. 🟢 𝐑𝐞𝐜𝐨𝐫𝐝 𝐎𝐜𝐜𝐮𝐩𝐚𝐧𝐜𝐲 𝐌𝐞𝐞𝐭𝐬 𝐇𝐢𝐠𝐡 𝐏𝐫𝐢𝐜𝐢𝐧𝐠 Lindblad's dynamic pricing and enhanced online booking channels successfully pushed occupancy to 93%—the highest in company history. Crucially, they achieved this without sacrificing price integrity; Net Yield per Available Guest Night increased 7% to $1,631. This demonstrates exceptional demand inelasticity for their core adventure product. 🔴 𝐂𝐨𝐫𝐞 𝐒𝐞𝐠𝐦𝐞𝐧𝐭 𝐌𝐚𝐫𝐠𝐢𝐧 𝐂𝐨𝐦𝐩𝐫𝐞𝐬𝐬𝐢𝐨𝐧 [NEW] While total company EBITDA grew 16%, the Lindblad cruise segment EBITDA only grew 6% (despite 16% revenue growth). The culprit: a structural headwind from the final royalty rate step-up under the National Geographic agreement, alongside higher voyage operational costs. This indicates negative operating leverage in the core business. ⚪ 𝐒𝐭𝐫𝐨𝐧𝐠 𝐂𝐚𝐬𝐡 𝐂𝐨𝐧𝐯𝐞𝐫𝐬𝐢𝐨𝐧 𝐚𝐧𝐝 𝐁𝐚𝐥𝐚𝐧𝐜𝐞 𝐒𝐡𝐞𝐞𝐭 Operating cash flow remained robust, generating $49.5M in Q1 primarily driven by strong forward bookings (unearned passenger revenues rose to $399.1M). Cash balances swelled to $321.1M against $675M in debt, providing management with ample dry powder for future accretive acquisitions or share repurchases. 🔴 𝐌𝐚𝐜𝐫𝐨 𝐚𝐧𝐝 𝐆𝐞𝐨𝐩𝐨𝐥𝐢𝐭𝐢𝐜𝐚𝐥 𝐒𝐞𝐧𝐬𝐢𝐭𝐢𝐯𝐢𝐭𝐲 CEO Natalya Leahy explicitly noted the 'complex macro and geopolitical environment.' Given the high price point of Lindblad's expedition cruises, the company remains highly sensitive to global economic volatility or geopolitical shocks that could disrupt international travel corridors. 𝐎𝐭𝐡𝐞𝐫 𝐊𝐏𝐈𝐬 𝐍𝐞𝐭 𝐘𝐢𝐞𝐥𝐝 𝐩𝐞𝐫 𝐀𝐯𝐚𝐢𝐥𝐚𝐛𝐥𝐞 𝐆𝐮𝐞𝐬𝐭 𝐍𝐢𝐠𝐡𝐭: $1,631 Accelerating slightly vs expectations. Up 7% YoY, driven by higher base pricing and a favorable mix of itineraries. This metric continues to highlight strong consumer willingness to pay for premium expedition experiences despite broader economic concerns. 𝐔𝐧𝐞𝐚𝐫𝐧𝐞𝐝 𝐏𝐚𝐬𝐬𝐞𝐧𝐠𝐞𝐫 𝐑𝐞𝐯𝐞𝐧𝐮𝐞𝐬 (𝐁𝐚𝐜𝐤𝐥𝐨𝐠): $399.2 million Stable and growing. Up sequentially from $361.5M at the end of FY25, providing excellent visibility into future revenue recognition and underscoring the success of their expanded booking curve strategies. 𝐒𝐡𝐚𝐫𝐞 𝐑𝐞𝐩𝐮𝐫𝐜𝐡𝐚𝐬𝐞𝐬: $23.0 million total to date Management continues to utilize its $35M authorization, retiring 875k shares and 6M warrants. With $12M remaining on the authorization and cash piling up, investors should watch for potential re-authorizations. 𝐆𝐮𝐢𝐝𝐚𝐧𝐜𝐞 𝐅𝐘𝟐𝟔 𝐓𝐨𝐮𝐫 𝐑𝐞𝐯𝐞𝐧𝐮𝐞𝐬: $800 - $850 million Decelerating. Using the midpoint ($825M) against FY25's $771M, this implies ~7% YoY growth. This represents a significant slowdown from the ~20% growth achieved in FY25, indicating that the 'catch-up' occupancy recovery phase is complete and future growth must rely on new capacity or pure price hikes. 𝐅𝐘𝟐𝟔 𝐀𝐝𝐣𝐮𝐬𝐭𝐞𝐝 𝐄𝐁𝐈𝐓𝐃𝐀: $130 - $140 million Decelerating. The midpoint of $135M implies ~7% YoY growth versus the $126.2M generated in FY25. With revenue and EBITDA guided to grow at roughly the same pace, management implies margin expansion will be flat for the year, largely due to the National Geographic royalty step-up. 𝐊𝐞𝐲 𝐐𝐮𝐞𝐬𝐭𝐢𝐨𝐧𝐬 𝐎𝐜𝐜𝐮𝐩𝐚𝐧𝐜𝐲 𝐂𝐞𝐢𝐥𝐢𝐧𝐠 With occupancy reaching an all-time high of 93%, how much further room is there to optimize yield management before hitting the absolute structural limit of fleet capacity? 𝐍𝐚𝐭𝐢𝐨𝐧𝐚𝐥 𝐆𝐞𝐨𝐠𝐫𝐚𝐩𝐡𝐢𝐜 𝐑𝐨𝐲𝐚𝐥𝐭𝐲 𝐈𝐦𝐩𝐚𝐜𝐭 Can you quantify the exact margin headwind in basis points caused by the final royalty rate step-up under the National Geographic agreement, and how do you plan to offset this structurally going forward? 𝐋𝐚𝐧𝐝 𝐄𝐱𝐩𝐞𝐫𝐢𝐞𝐧𝐜𝐞𝐬 𝐄𝐱𝐩𝐚𝐧𝐬𝐢𝐨𝐧 Given the massive 88% EBITDA growth in the Land Experiences segment, are you evaluating shifting more capital allocation toward M&A in this space rather than capital-intensive cruise ship additions? 𝐂𝐚𝐩𝐢𝐭𝐚𝐥 𝐑𝐞𝐭𝐮𝐫𝐧 𝐒𝐭𝐫𝐚𝐭𝐞𝐠𝐲 With over $320M in liquidity and only $12M remaining on the current repurchase authorization, what is the board's view on instituting a larger buyback program versus holding cash for new builds or acquisitions?
Finsee tweet media
English
0
0
1
327