Mike Hoerger, PhD MSCR MBA@michael_hoerger
PMC COVID-19 Forecasting Model, Nov 18, 2024
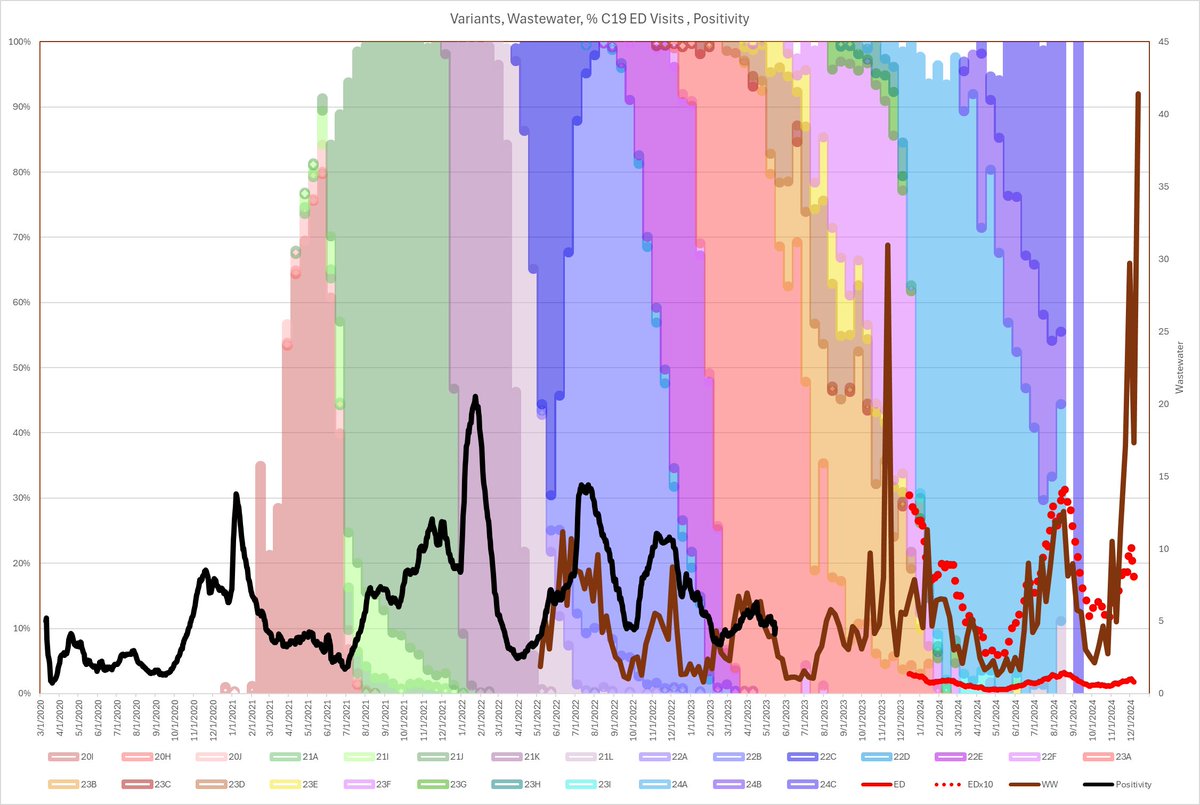
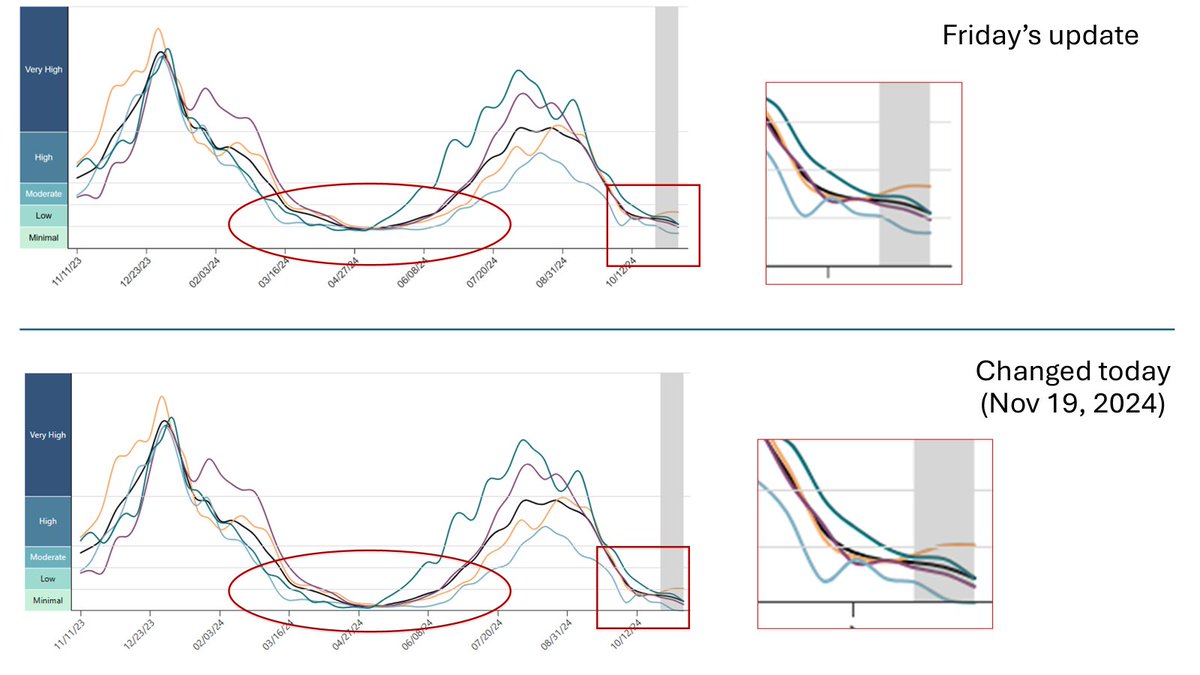
Here's our year-over-year graph of U.S. Covid transmission with 1-month forecast.
I'm going to walk you through why 2024 is atypical and 4 realistic scenarios for the winter.
Atypical Transmission in 2024
Our model predicts forward transmission based on two main components: 1) Historical median levels of transmission for a particular day of the year, and 2) the last 4 weeks of transmission patterns, which maps current transmission to the "usual" shape of waves to project forward.
2024 has shown atypical departures from these model assumptions in several respects:
🔹Summer wave later than typical
🔹Summer peak flatter than usual
🔹Summer wave coinciding with back-to-school
🔹Back-to-school meaning more children infected, meaning the peak shown is an underestimate, as wastewater underestimates transmission in kids
🔹Atypically steep decline in transmission
🔹Atypically later lull
All of this creates a lot more uncertainty surrounding the size and shape of the winter wave, in my view. Last year, transmission mostly tracked the median, typically a touch higher, so the anticipated picture of the winter wave was more certain, even in early November. This winter is more uncertain.
Here, I describe 4 realistic scenarios.
Scenario 1: The Model Holds Strong. Transmission picks up quite rapidly (as shown in the dashed line), catching up, or reverting toward the median of prior years. The wave looks similar to the median or perhaps Y3 (yellow line). It peaks around 1.3-1.5 million daily infections and has more transmission on the back end of the peak than leading into the peak, just like prior waves.
Scenario 2: Best Case. The wave picks up a little more slowly than shown and peaks lower (1 million/day at peak). The shape of the wave is similar, just smaller. This is still a very bad scenario, but good in the relative sense that it could have been much worse. Lots of suffering, but much less than last year.
Scenario 3: Bad Back-to-School. The peak hits somewhere in between #1 and #2 (1.0-1.3 million daily infections), but the total number of infections remains high due to prolonged high transmission, like with the recent summer wave. This would be troubling in that transmission would be very high during back to school. A subset of children just infected in August might get reinfected and experience bad outcomes.
Scenario 4: The Jelly Roll. Dr. Eastman (@jlerollblues) has a very nice highly-granular model that makes much fewer assumptions surrounding the day of the year. You can see a preview here:
x.com/AnciraBecky/st…
It suggests a peak about a week later than PMC's estimate of New Year's Eve, but with limited increase in transmission throughout much of December. Think: cool, cool, cool, HOT.
Each of these scenarios seem reasonable. I lean toward #3. Right now, our so-called "1-month" forecast is actually nearly a 6-week forecast because the wastewater data are being reported so slowly and with such sizable retroactive corrections. The model will update as new data come in, and we will have a better sense of the scenario around December 1. By December 15, that will be even clearer. I encourage people to think through each of the scenarios and implications for travel, family gatherings, and back-to-school precautions, especially given so much uncertainty.
Info for new readers:
For those unfamiliar with the PMC model, find full weekly reports for the past 14+ months at pmc19.com/data
The models combine data from IHME, Biobot, and CDC to use wastewater to estimate case levels (r = .93 to .96) and forecast levels the next month based on typical (median) levels for that date and recent patterns of changes in transmission the past 4 weeks.
Our work has been cited in top scientific journals and media outlets, which are fully sourced in a detailed technical appendix at pmc19.com/data/PMC_COVID…
Examples include JAMA Onc, JAMA-NO, BMC Public Health, Time, People, TODAY, the Washington Post, the Institute for New Economic Thinking, Salon, Forbes, the New Republic, Fox, CBS, and NBC. See pgs 10-11 at the above link.
We will have a pre-print out in the next month or two documenting very compelling evidence for the validity of using wastewater to estimate case rates.