@BigBoyOrderflow @MMT_Official_ @anthdm I would be interested to test your indicator and the related set-up in MMT
English
Gerinvest
14 posts


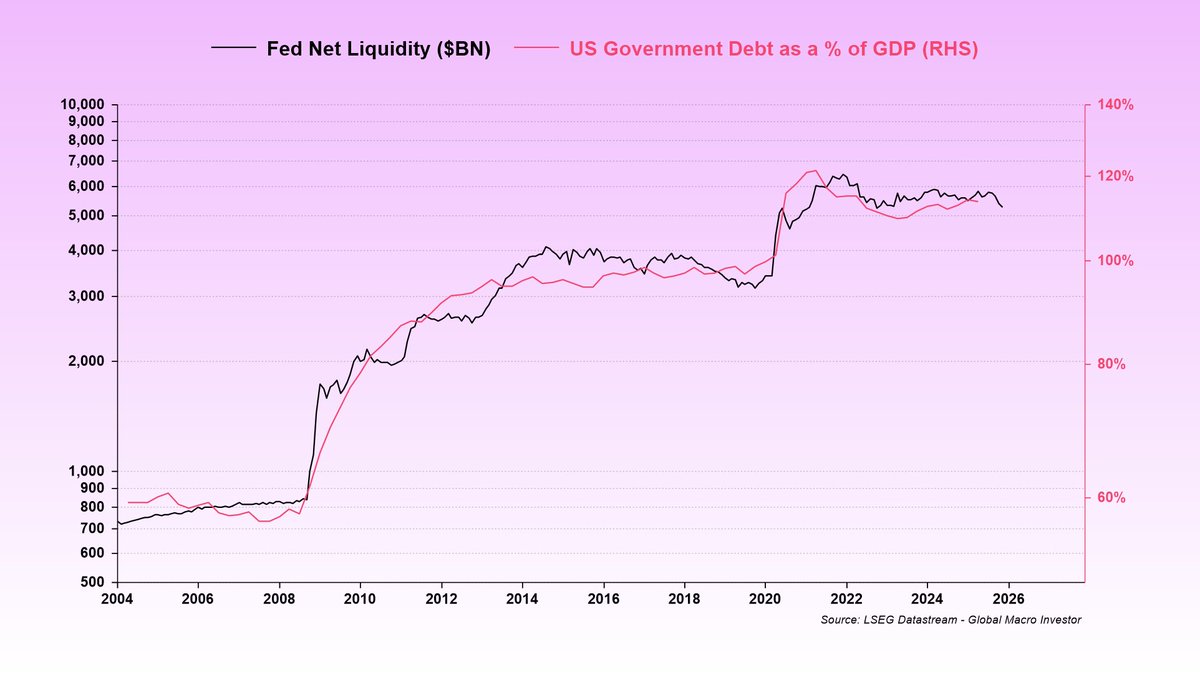
To be clear: Global #Liquidity is not M2. It is broader and constructed differently, eg. includes repo & shadow banks. And, far bigger than #CentralBanks. Also level is still inching higher, but growth rate has skidded since last Fall.