DeepValue Signals@DVSignals
$SILVER: probably the single most important chart analysis to read this weekend.
If you want a balanced read, keep reading...
This is exactly why I push back on the simplistic “trendline break = fresh breakout” view
On silver, I see many drawing a very straightforward line across the highs on a linear/log chart, pointing to the recent move through it, and calling it confirmation. That is far too simplistic. A break of one line, by itself, does not imply a fresh impulsive breakout. It needs far more rigorous analysis, cross-checking structure, momentum, Fibonacci, relative strength, miner confirmation, and broader context.
For those who have followed me for a while: you know I am generally NOT an Elliott Wave guy. But on this specific chart, I do think it offers a useful framework to explain both the structure and the psychology. Not because it is some perfect science, but because it can help simplify what the market may be doing here.
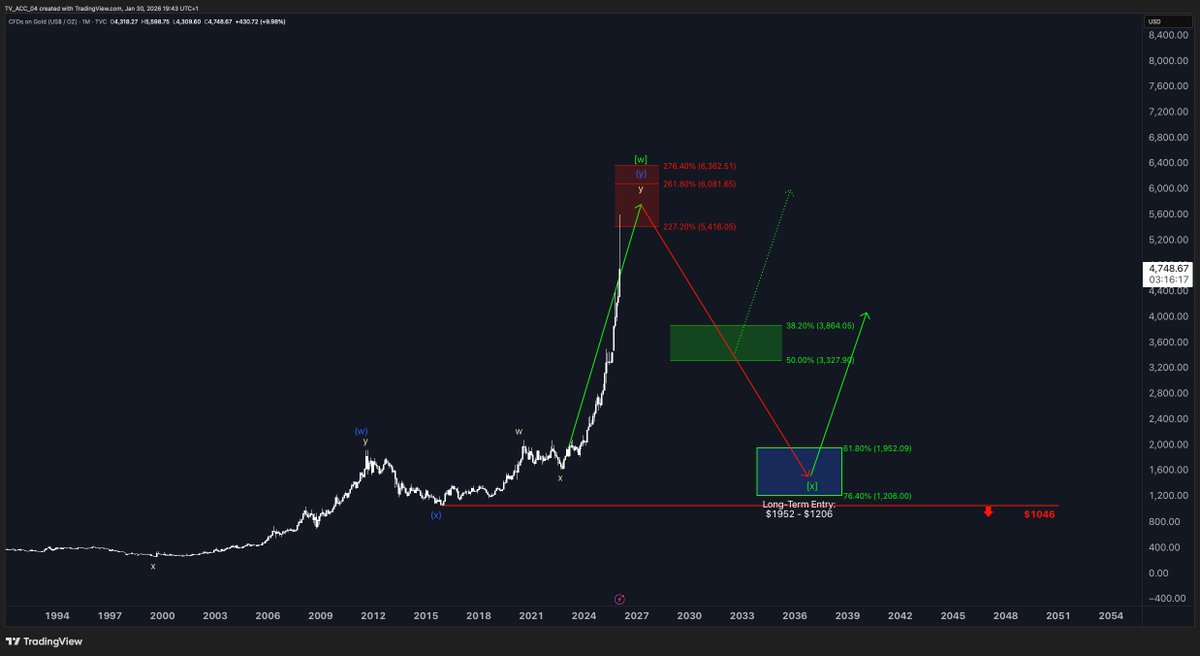
The basic idea is straightforward: wave 1 down, wave 2 bounce, wave 3 down, wave 4 bounce, wave 5 down.
And right now, what silver appears to be doing is behaving much more like a wave 4 than the start of some powerful new leg higher.
That matters, because wave 3 is usually the brutal recognition phase. That is when the market starts to accept that the prior uptrend is damaged. The move gets sharper, confidence gets hit, and price starts doing real technical damage. We saw that.
Then comes wave 4, the false-hope phase.. It tends to be choppy, overlapping, frustrating, and just constructive enough to pull people back in. It often looks better on surface-level analysis than it really is. That fits very well with what I think we are seeing now: a recovery that looks encouraging to many, but structurally still carries bear-flag / corrective bounce characteristics.
That is also very similar to the earlier phase (wave 2) where I said: be careful. Same near 89. That got pushback too. Yet those caution calls mattered. And this broader framework is also part of how I was able to lean constructive again closer to 61...
Now look at where we are: this bounce has pushed into the 0.618 Fibonacci retrace, and we are now bear flagging. On the more zoomed-in charts, silver actually looks vulnerable, not strong, contrary to popular belief. Miners are not really confirming in the way I would want to see for a genuine breakout. And the recent move in GSR still looks more like a fake move than a resolved shift.
So my primary view, until proven otherwise, remains that this is still a corrective advance inside a damaged structure.
For that to change, I would want to see a clean push above 80, with the current bear-pattern break sitting closer to 81.50, and real acceptance there not just a wick through it. Friday’s breakdown was severe enough that one brief poke higher does not suddenly repair the chart..
So, long story short: I am not dismissing the possibility that silver can recover further. But I am also not going to pretend that a simple line break on a basic chart suddenly means the all-clear has been given. Right now, the wave 4 psychology fits: enough bounce to create hope, not enough evidence yet to prove that the broader bearish structure is gone.
And if this really is wave 4, then wave 5; the final flush, the final disappointment, the move that catches late bulls leaning the wrong way, may still be missing.
RT and share if this gave you value. These free posts take enormous amounts of time to produce...