Sabitlenmiş Tweet
Matthew Gross
3.3K posts

@HurricaneAddict
Fascinated by extreme weather and the extreme events that come with it. (Any fantasy hour maps posted are for entertainment & learning purposes, not forecasts.)


Mysterious ‘cold blob’ in the Atlantic suggests the AMOC is weakening A patch of ocean south-east of Greenland is the only place on Earth that is cooling, and it could be a sign that the warm water “conveyor belt” in the Atlantic is slowing down newscientist.com/article/252907… docs.google.com/document/d/1JV…


Famine is coming


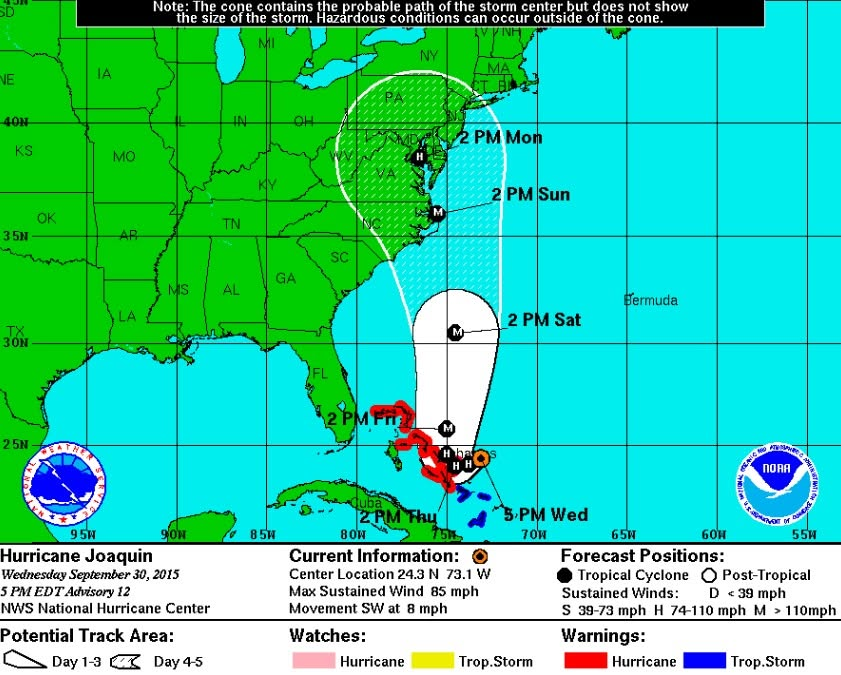
Despite the early season hype...not seeing anything to be concerned about!

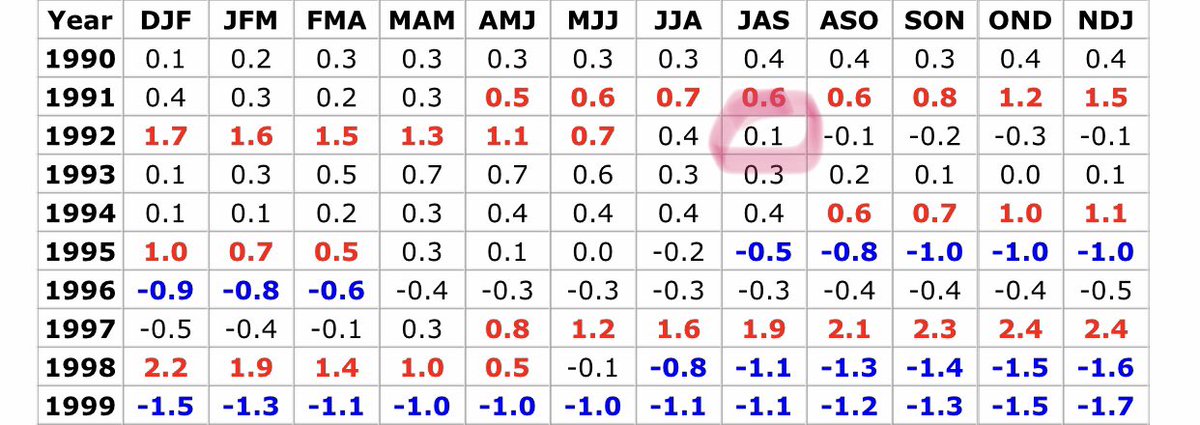
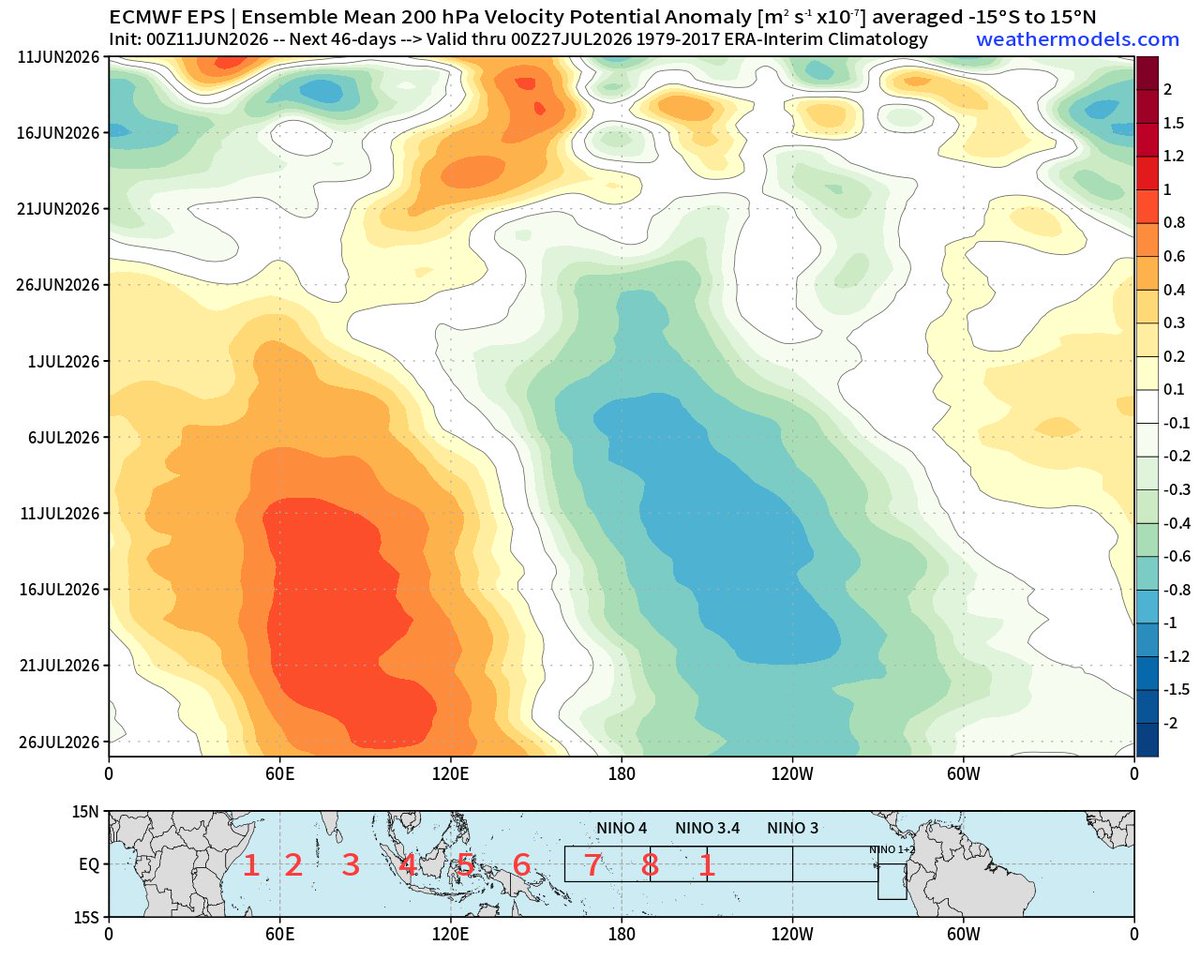
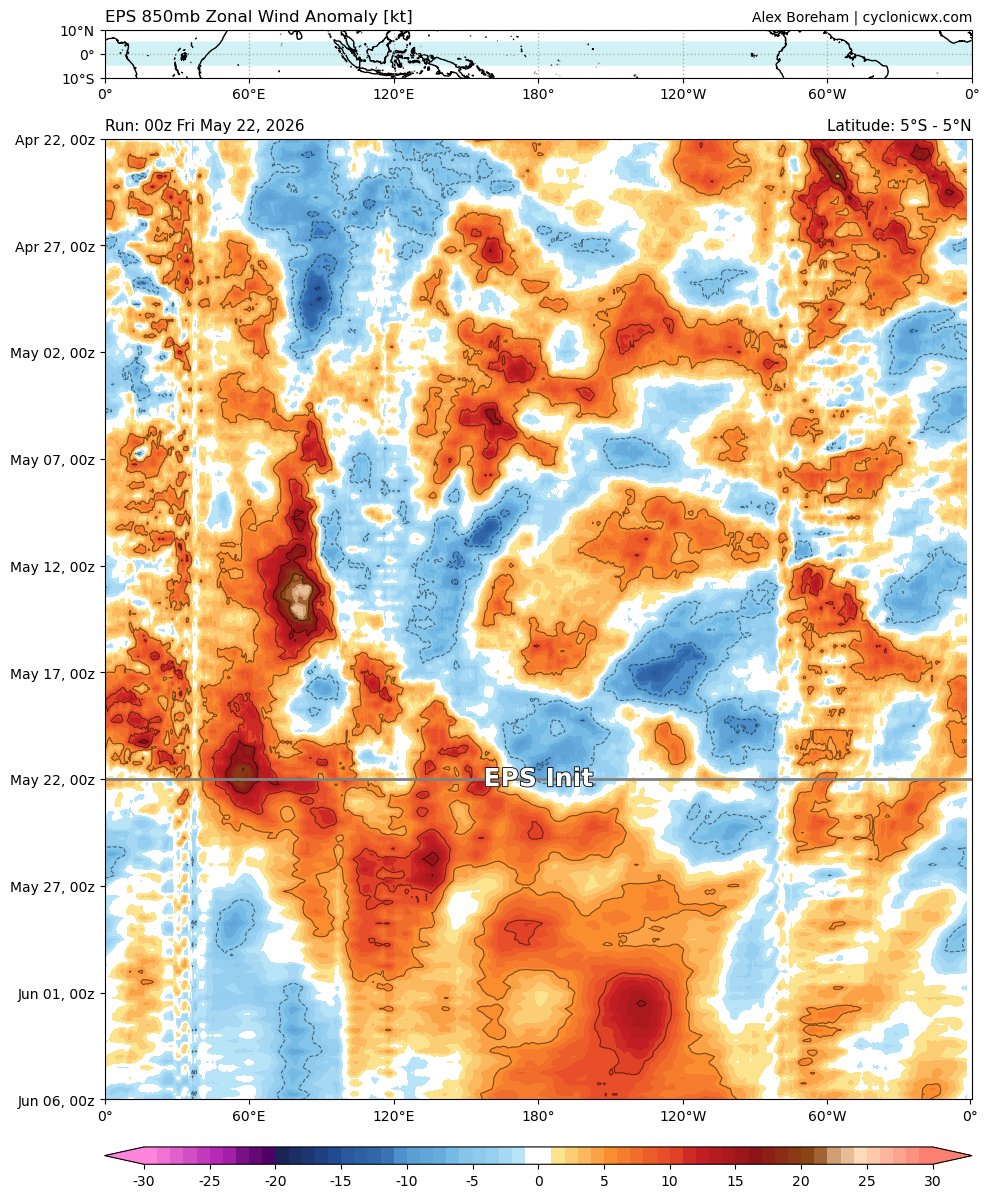
2026 and 1997 are El Niño twins. But they didn't always look alike. Subsurface ocean warmth developed faster in 1997, but 2026 caught up following a record-breaking Kelvin wave that formed in April. A new westerly wind burst into June will keep these two years neck and neck.


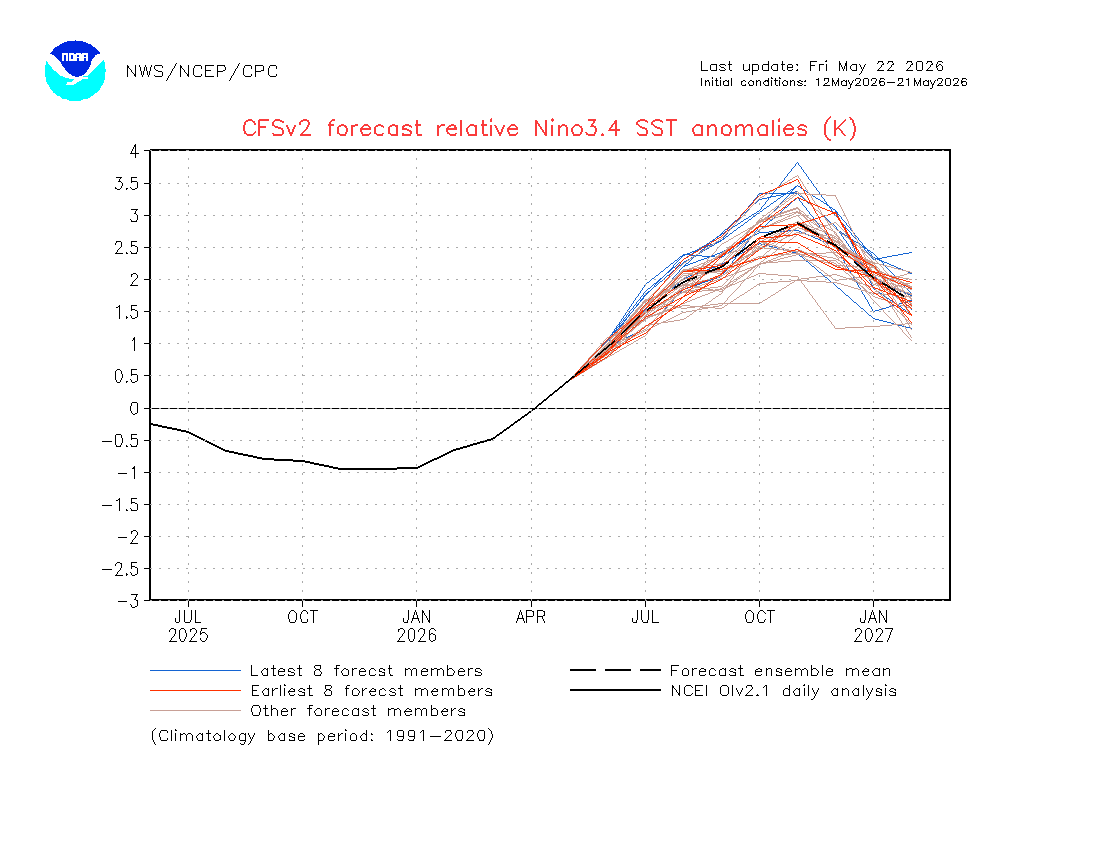
Lurking below the surface in the equatorial Pacific is possibly the most impressive blob of above average ocean temperatures we've ever recorded since we've had the ability to measure this stuff. When that enormous concentration of bath water reaches the surface over the coming weeks and months, it's going to release devastating consequences around the globe throughout the second half of the year. Get ready for severe droughts in parts of South America, Africa, and Australia, devastating monsoons in southern China, and a roaring southern jet all winter long in North America. When you combine this with the fertilizer crisis bubbling as a byproduct of current global events, there's going to be crop failure on a level most of us have never seen during the closing months of 2026. Hard to see how we avoid widespread deadly famines across multiple stretches of the planet at this point.