

JakeX
36 posts


要全面开打了。川普总统刚才连发多贴,都是剑指伊朗。
这次绝不能再让他们抱幻想了——我指的是伊朗的幕后操纵黑手。歼灭伊朗邪恶政权,刻不容缓!



中文

$COPPER / $SILVER
Another ratio chart I’ve posted several times, especially in the second half of ’25.
And honestly, ask yourself this: would you ignore an asset that is sitting near the lower side of a long-term relative channel, looks historically depressed versus silver, and is now starting to show a bullish micro-structure / potential breakout?
This does not mean silver has to fall. Both copper and silver can (and will) eventually rise together.
But on a relative basis, this chart suggests copper may have a very real chance to outperform silver over the coming months / years if the breakout holds.
That said, there is room for both in a portfolio.
Silver for monetary / precious metals torque.
Copper for industrial / electrification / supply-demand exposure.
Different roles. Same commodity bull market.

English

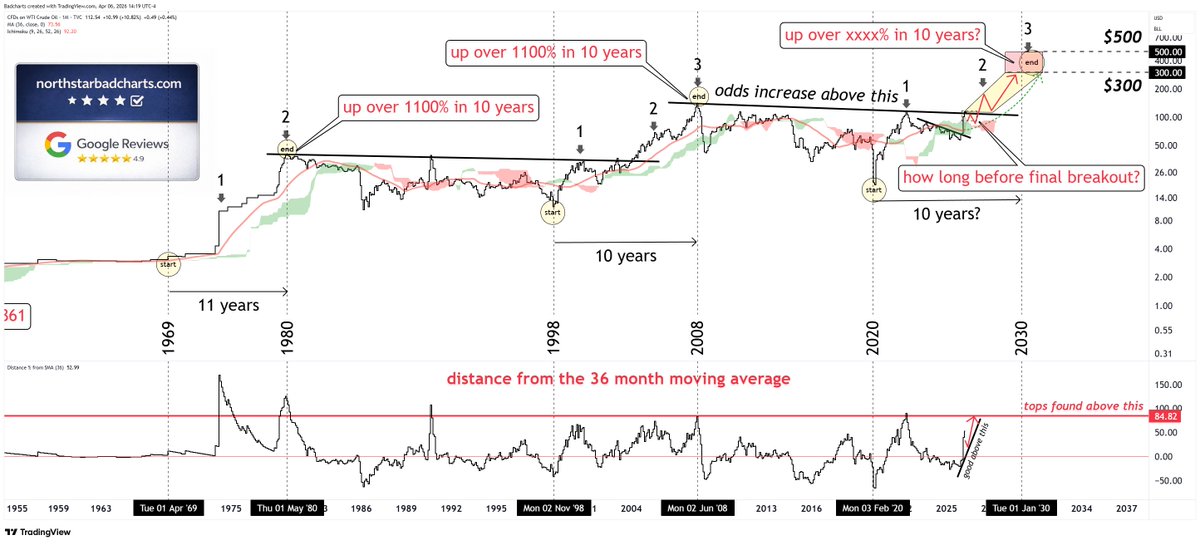
No need to get emotional about why crude oil can OR cannot go up.
Just be smart about it, and follow what the price chart is trying to tell you.
$300 to $500 is still quite possible after the breakout.
English


Mid-Week Macro
The missile exchange between Israel and Iran appears to be over. This has caused oil prices to drop to $65, and the S&P 500 to rally back above 6000. This feels like a top to me on Wall Street, with a lot of bullishness and euphoria. I keep hearing analysts speak optimistically that inflation is under control, interest rates are coming down, and there will be no recession. They are only focusing on the positive data, but there is plenty of negative data they are ignoring.
In two weeks, on July 9th, the pause in tariffs will be lifted. I'm expecting Trump to hold firm on high tariffs. Wall Street is expecting him to be Mr Taco (Trump Always Chickens Out). I'm expecting at least one significant trade war, and the average tariff to be at least 15% (the average was 2.5% in 2024). These tariffs are not a nothing-burger, and I doubt that the economy is strong enough to overcome them.
Where are the green shoots in the economy? AI? That's probably a net-negative as companies like Microsoft lay off thousands of employees and replace them with AI. Housing/Construction? Nope. Autos? Nope. Small business growth? Nope. Retail? Nope. Restaurants? Nope. Government jobs? Nope. I don't see any green shoots. The economy is muddling along and slowing.
Gold continues to track the S&P 500. This began in early 2024 and has been a strong correlation. This is an odd correlation that makes little sense. Historically, this does not happen. When the stock market took off in 2012 and 2013, gold plunged. That is more of the norm. Why is gold so strong with a strong stock market? My take is that the stock market is the poser. Gold is sniffing out real economic problems (massive government debt, Triffin's Dilemma, inflation, de-dollarization, etc). Gold knows that the stock market is in a bubble.
Silver is finally making some noise. It closed today at $36.23 and has been over $35 for more than two weeks. However, even at $36, the GSR is at an elevated 92. So, silver continues to underperform. Some think silver is breaking out here, but I think it is a bull trap. Silver is not ready to run yet. It will need a fear trade for that outcome (the stock market to stop going up). Expect gold, silver, and the miners to correct one more time before we are off to the races.
English

@FirstSquawk FAKE NEWS, what a coincidence both WSJ and IRANWIRE publish this news almost same time

English

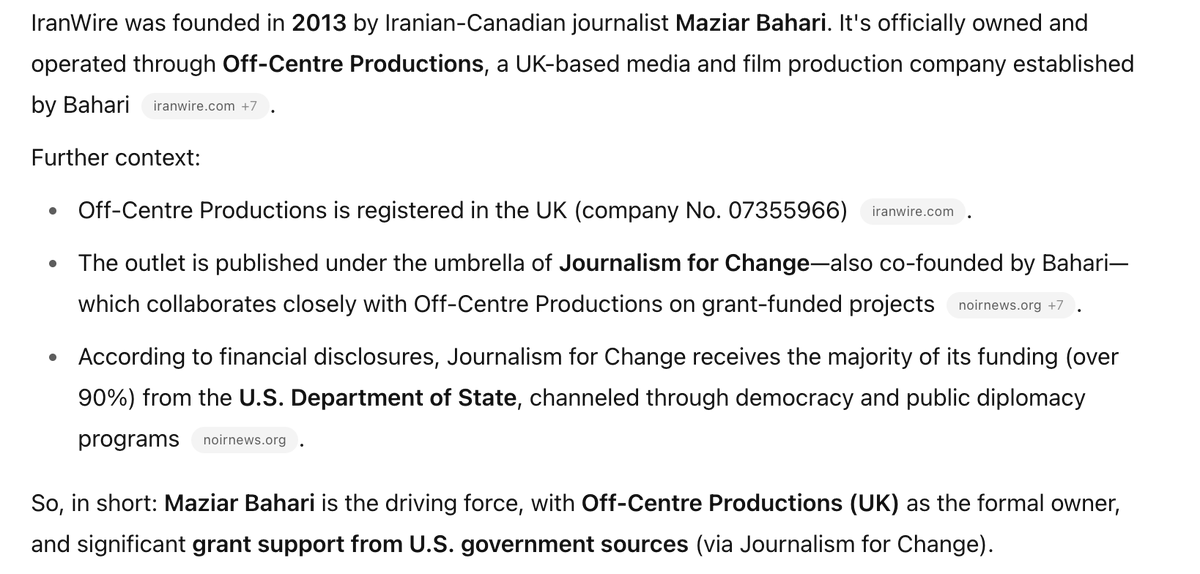
TEHRAN READY TO ABANDON ENRICHMENT BUT NEEDS A FACE-SAVING EXIT - IRANWIRE
English
asked chatgpt who's behind IRANWIRE and where is it getting funding from... aparantly fake news. #oil
*Walter Bloomberg@DeItaone
TEHRAN READY TO ABANDON ENRICHMENT BUT NEEDS A FACE-SAVING EXIT: IRANWIRE In an exclusive interview, a high-ranking Iranian diplomat revealed that Iran’s military and political leadership are prepared to give up uranium enrichment to preserve the regime. “But we need a face-saving solution,” said the diplomat, who spoke on condition of anonymity.
English
@joshyoung Trump will probably do the same when oil hit 120 dollars per barrel as he hates high oil prices so much
English
Good thing our leaders were forward looking and built up large Strategic Petroleum Reserves!
😳 Biden:
x.com/Josh_Young_1/s…
Josh Young@JoshYoung
Too bad Biden sold off our SPR
English
OPEC+ countries have been dropping rigs and adding back to their supply quotas. We may be close to testing their true spare capacity.
Josh Young@JoshYoung
Narrative: the Saudis are flooding the oil market with OPEC+ Reality: Saudi Aramco dropping rigs
English
@joshyoung yet you voted for this retard destroying domestic oil business.
English
And now Trump is demanding payment from the EU for past "unfair trade". Like reparations?
This is drifting further and further from Trump campaign promises and stated economic policy goals.
English
Reciprocal tariffs, with the goal of achieving lower mutual trade barriers and interventions, could work.
Trying to use tariffs to eliminate trade deficits is very different, and is likely to be highly destructive if followed through.
Jack Farley@JackFarley96
Trump tripling down on his insistence that he won't make a deal until trade deficits go away...
English

DeepSeek老板梁文锋,被包装成投资天才;员工罗福莉,被包装成AI天才少女。如果梁文锋是投资天才,又有吓死华尔街的DeepSeek,幻方量化2024年业绩,为何大幅跑输A股大盘?梁文锋究竟干嘛的?主要利用A股散户占比高(约60%),玩杀猪盘的。怎么玩?以后细说。罗福莉就是杀猪盘的道具,已高薪被小米从DeepSeek挖角。罗福莉之前在阿里达摩院,就是孵化数学天才少女姜萍的地方。据传小米CEO雷军亲自出手,也让罗福莉声名大噪。罗福莉很享受AI天才少女人设,说明她一点都不天才。
中文
@AgWxMan1 @Holy_Helicity the problem with this is that the map is based on 1984-2009 weather data. It would be interesting to understand what does the last 5 year look like
English

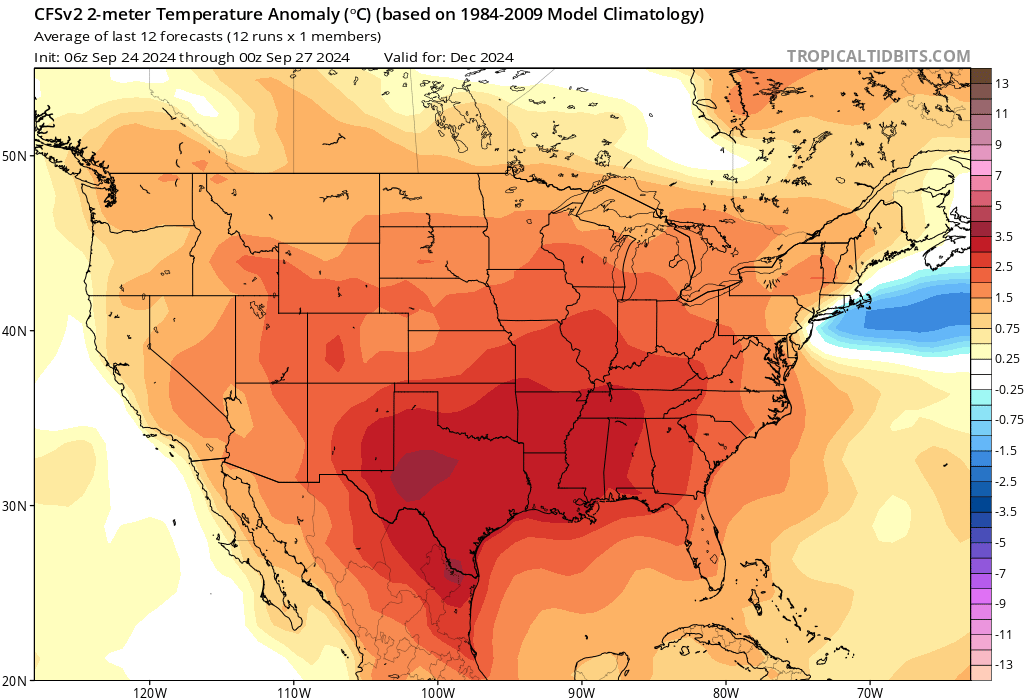


Final estimate for this Thursday’s #natgas storage report is +39.
It feels like we will never see above “average” temperatures again. Weak wind was the saving grace for the report week, but that’s already done.
English
@PaulSaladino7 instead of annualized demand, average over season is more accurate.
English
If #natgas domestic demand was 92 BCFd and net export was 15 BCFd over a 12 month period, you would need to produce 107 BCFd over the same period to keep storage unchanged relative to where it was at the beginning. If you produce 102 BCFd on avg over that period, you have to withdraw (or inject less) an extra 5 BCFd from storage to cover the difference.
Assuming this all happened at perfectly “normal” weather and everything else could be held equal, this is what it means to be 5 BCFd tight. I’m looking at smaller slivers of time than a 12 month period.
English
@PaulSaladino7 How much tighter compared to 5 year avg is the main question, or are we actually looser than 5 year avg?
English
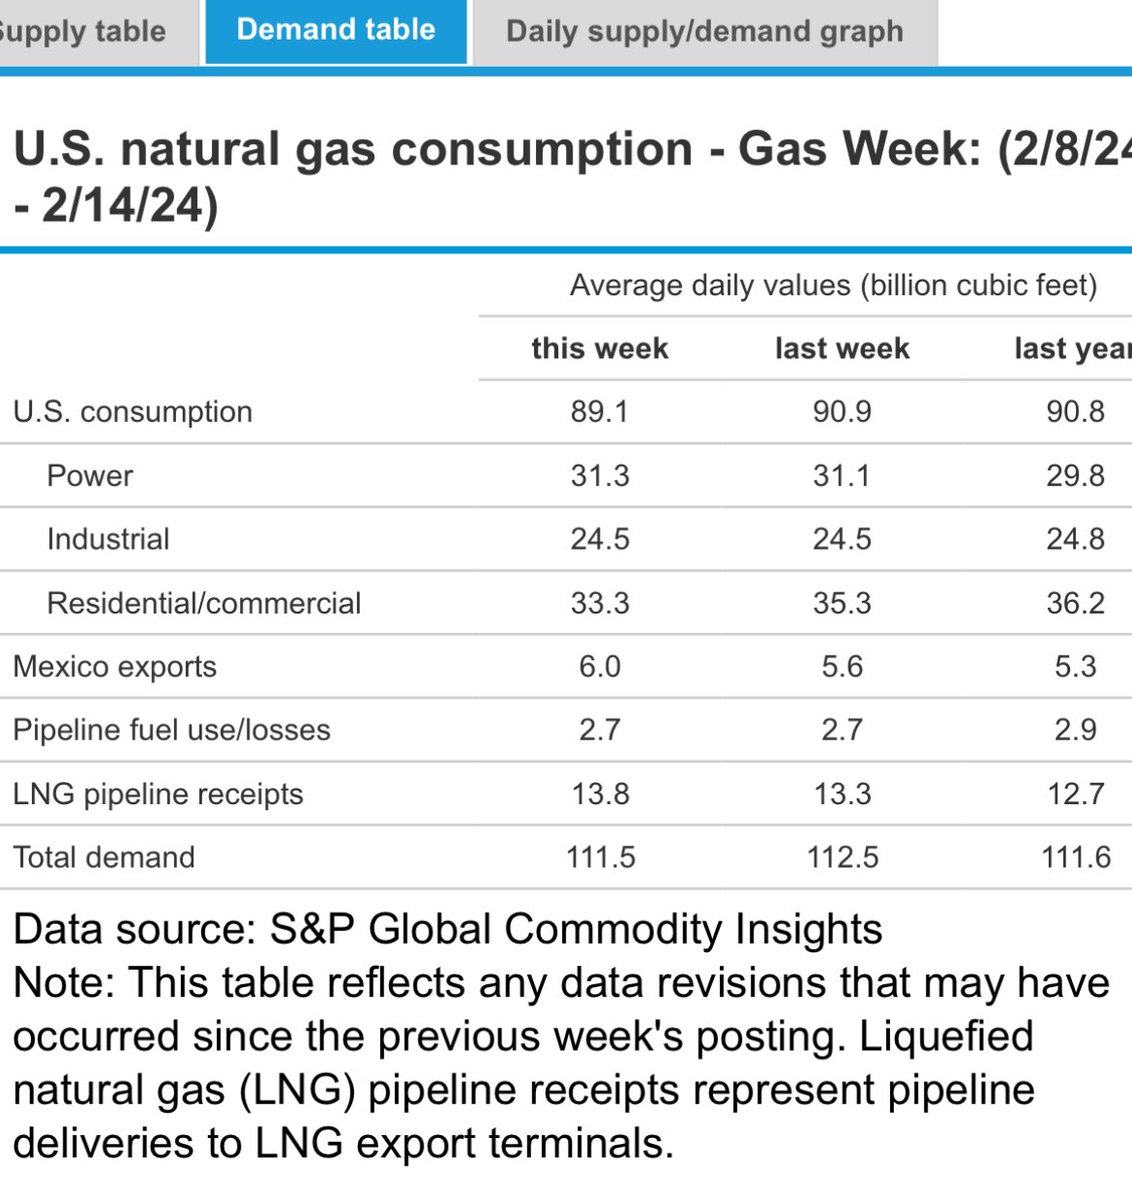
With the miserable weather, domestic #natgas demand happened to be right at ~91 for the storage report week, .6 BCFd below my annual avg. 104.4 prod, 0 net pipe export, and LNG at only 13.3.
All that adds up to a super loose supply/demand balance of… 2.3 BCFd TIGHT
Hmmm 🤔

English
JakeX retweetledi
