Crypto Waterman@Waterman_crypto
Do you know this chart predicted all the major $BTC move for the past 12 years, with one exception? Let’s dive in 👇
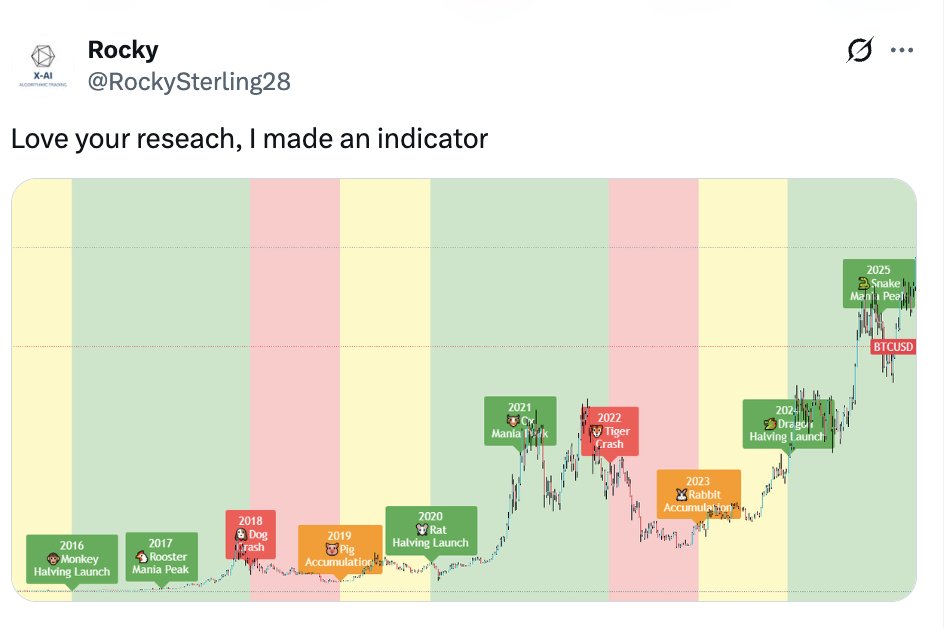
Green Circle 🟢: Go, Major Trend Up. (Bullish)
Yellow Circle 🟡: Caution:
(From past data, yellow should be slightly bullish)
Red Circle 🔴 : Stop: Major Trend Down. (Bearish)
Annual Returns:
2013 (Green): +3358% (Correct)
2014. (Red): -74.7%% (Correct)
2015: (Yellow): +76.9% (Correct)
2016: (Green): +142.1% (Correct)
2017: (Green): +1005.9% (Correct)
2018: (Red): -66.1% (Correct)
2019: (Yellow): +143.0% (Correct)
2020 (Green): +472.8% (Correct)
2021: (Green): -19.6% (Wrong) (But if you calculate from 2021 Jan 1st to 12/31 you get +59.71%)
2022: (Red): -40.8% (Correct)
2023: (Yellow): +105.9%(Correct)
2024: (Green): +111.4%(Correct)
People often make fun of using astrology to predict markets, but it is very accurate predicting macro moves.
So what does this conclude?
1. Best time to sell $BTC is when we enter “Red Circle”
2. Best time to buy $BTC is at the end of “Red Circle” year and beginning of the “Yellow Circle” year
3. We are 2 months until we enter the horse year, which is a RED CIRCLE. Horse year is also a very bearish year for Rat (BTC). I do believe Q1 will be big. Read all my post to understand them.
Don’t forget this saying…
“Millionaires don’t use astrology. Billionaires do”
*** calculated by lunar years ***