youtu.be/pxs2MuqvH3w
New vid for the new site on "Price Distributions". "Price Distributions" is a statistical framework I use to tell what regime we are in, what my bias should be (trend vs mean reversion), and when to time my entries. It uses percent net change from open to close of various time windows to calculate samples and derive data from said sample.
@ProbableChris@undercovrjunkie@NQStats What indicator or oscillator is this? What exactly are you comparing 20 day (blue) is on average the previous days or? sorry, I'm confused.
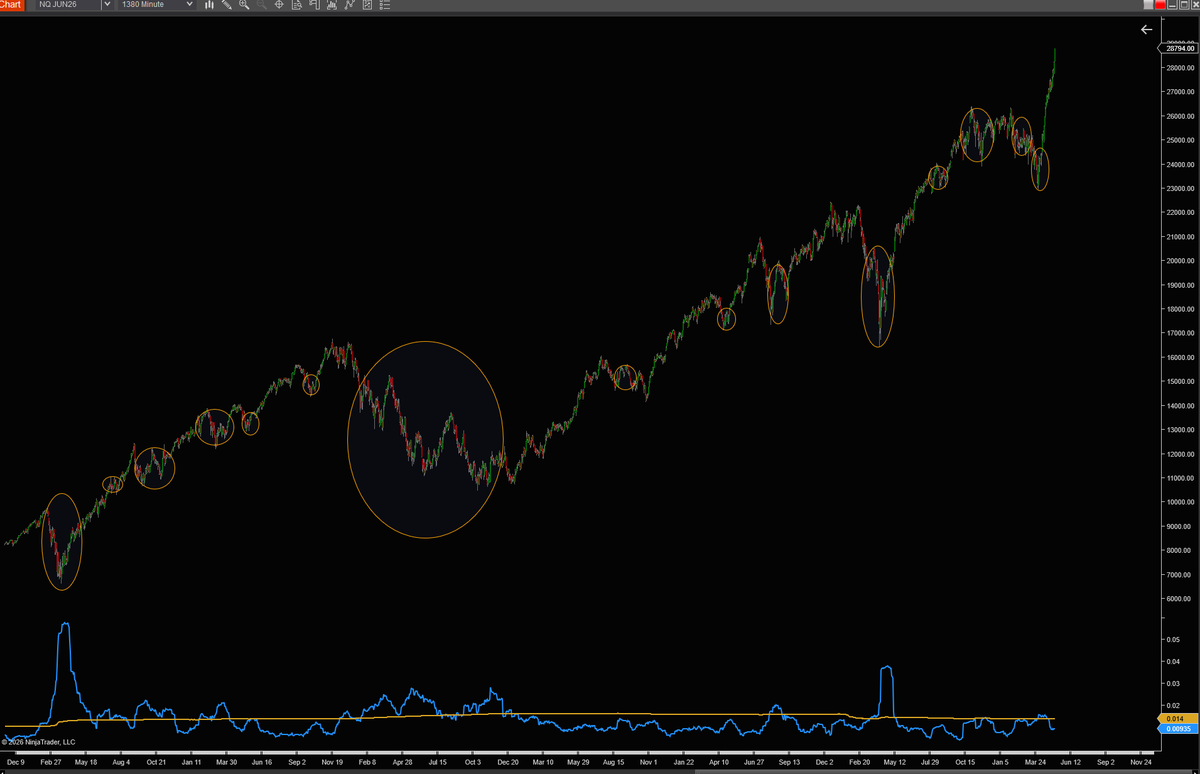
Im personally not concerned with the strength of the regime, I just want to know what regime we are in. The attached picture shows a lower indicator that displays the 5yr (gold) vs the 20-day (blue). When the 20d > 5yr or when they are relatively similar in value, I have circled the associated price bars.
You can see in these circles the market is rather choppy, resulting in range bound days, favoring mean reversion. Outside of those circles we are mostly in trend regimes that would favor a intra day trend play. Its a simple way to answer the question of "does today favor mean reversion or trend continuation plays."
@mentfxofficial you changed ur strategy 3 times, confusing 90% of your students, from pure wyckoff, to SSC, to now a moving average flushouts moving to stocks. You was also a pure forex trader now a stocks trader?. please stick to 1.. you made a mentorship while learning to trade urself.
real education transforms actions permanently.
poor education keeps you stuck constantly wondering what's going on.
staying stuck should NOT be the norm.
so don't let it be.
mentfx.com