Chris™

5.1K posts

Chris™ banner
Chris™

Chris™

@ProbableChris

I trade $NQ using statistical models, probabilistic frameworks, and custom tools built based on my market perspective. Creator of https://t.co/fGgQW2gwBn

Katılım Kasım 2016
136 Takip Edilen7.2K Takipçiler
Sabitlenmiş Tweet
Chris™
Chris™@ProbableChris·
I started clicking buttons on charts in 2007. In that time, I have learned that there is no "best strategy", there is just how you view the market, and what edge you can extract from those views. Edge generates alpha. Process allows the edge to be utilized. Performance comes from your ability to follow your process. My coding/math brain gravitated towards a statistical approach, which overtime lead to creating various concepts, frameworks, and ideas. nqstats.com is a free resource I created to catalog some of those things.
English
4
6
116
7.6K
matt
matt@BroadDayDre·
@ProbableChris @NQStats I actually am starting a free ai for alpha …it’s based on your willingness to give out enough for people to study and learn from…so it has everything people need not gate keeping…
English
1
0
1
22
matt
matt@BroadDayDre·
I reverse engineer the rules prop firms have to then research for alpha. I have had incredible success doing this.. Everyone posts the green screenshot and hides the method. Here’s the method. Bot marks every clock-hour’s high/low, then fades the break back to the midpoint. Sell the top, buy the bottom, OCO so one cancels the other, hard stop one full range out, one position at a time. Ran it live on ZN + 6E on my funded account today. Two winners — and the plumbing was clean: OCO cancelled on every fill, stops attached every time, it re-armed itself for the next hour with zero touch. The part nobody says out loud: that’s ONE session. Today proved the mechanics, not the edge. Whether it prints over a real sample is a different question — and I’ll post that decay too, green or red. Not selling signals. Building the thing that shows you the backtest and the live decay, and lets you trade it yourself.
matt tweet mediamatt tweet media
English
1
0
0
37
matt
matt@BroadDayDre·
@NQStats x @ProbableChris learned a lot from you , just applying frameworks and archetypes to different assets 🏌🏾‍♂️🙏
English
1
0
1
29
Alohagreen 🔺🌹
Alohagreen 🔺🌹@MattCosbie·
@ProbableChris Chris thanks so much for sharing. You are very much appreciated. For the larger data sets like 5 year etc are you doing anything with Python or is it all in NT8? Also where/who are you getting your data from. I have been driving some amazing results with Claude and NT8.
English
1
0
0
62
Chris™
Chris™@ProbableChris·
"Market Regimes" getting added soon to an NQ Stats near you. This will focus on how to identify market regimes, why it matters, how to use the information, etc.
Chris™ tweet media
Chris™@ProbableChris

Why Market Regimes Matter If you want to know when to widen/shorten your stops, when to use bigger/smaller risk, when to use mean reversion frameworks vs trend continuation frameworks.....knowing the market regime you are trading in is how you can determine the answers to those questions. The market will always move from periods of compressed distribution to elevated distribution. Think of this simply as low volatility vs high volatility. When the market has been slow grind trending for awhile, you are in a compressed distribution. When the market has been creating big outlier days for awhile, you are in an elevated distribution. Elevated Regime: Here the market is active, its more volatile. High realized volatility usually accompanies directional conviction, news, or repricing. Moves extend further than they normally would, which punishes early fades. But elevated vol also produces the largest reversion spikes (exhaustion reversals), so mean reversion here is higher-reward and far higher-risk, and timing-dependent. In elevated regimes, expect wider moving bars, stops would be better placed wider or if not moved wider potentially using less $ risk, and the strategies you employ should be able to leverage this elevated volatility. Compressed Regime: Here the market is less volatile, you will see slow moving range days or slow grinding trend days. Low realized volatility means price is coiling in a tight range overall. Compression is also the setup before an expansion move. Volatility clusters, so a quiet regime is "storing" energy. In compressed regimes, expect smaller overall range within bars, stops can be tighter, and the strategies you employ here should not be trying to capture large moves because that is not the norm in compressed regimes. There are various ways to analyze the market and detect what regime you are in. I collect a 5yr baseline of distribution which gives me the +/- SDEV value. I than compare that baseline to the last rolling 10-days distribution, and view this data for the last 6 month, providing me with a chart. This shows me how recent price has been trading against historical price, as it pertains to market norms. I can also see when price is starting to come out of compression into an elevated state, or when price is reverting from an elevated state and falling into compression. Seeing this in the form of a chart allows me to start to make plans and assumptions and adjust my risk and strategies according. One strategy with one risk profile is not applicable to all market regimes. Elevated, actively expanding, compressed, actively compressing....these are the 4 regimes I focus on and they tell me how I should treat the Day, the New York AM, and each individual hour. You can apply this framework to anytime time based range.


English
9
0
101
8.4K
Chris™
Chris™@ProbableChris·
@nicholaskent Agree my friend. I have lately just been reflecting on what is actually important, and whats not. Its rather enlightening.
English
1
0
9
507
Nicholas-Kent
Nicholas-Kent@nicholaskent·
There are few, actually no better things in this world than my daughter coming home, giving me a massive cuddle, and getting to kiss her on the forehead. Contrary to how it feels as a goal-oriented person, there’s no destination, nowhere to get to or arrive at. There are moments like these, and our ability to be fully present for them may be the only thing worth achieving in the end.
English
1
0
22
910
Displacement Trades
Displacement Trades@iamdisplacement·
Traders who have become Profitable, what's your secret ?
English
120
12
162
50.3K
Chris™
Chris™@ProbableChris·
@roandthatsit The webpage will have all the necessary information once its built.
English
0
0
2
125
RO
RO@roandthatsit·
@ProbableChris Will you make an indicator for this or will share the data so one can build it?
English
1
0
0
112
Chris™
Chris™@ProbableChris·
@Jiminnj77 ehh, if you search X for "AM TBR" Im sure a few have replicated it
English
0
0
0
90
Jim E
Jim E@Jiminnj77·
@ProbableChris So Clean! Is this indicator available anywhere?
English
1
0
1
72
Chris™
Chris™@ProbableChris·
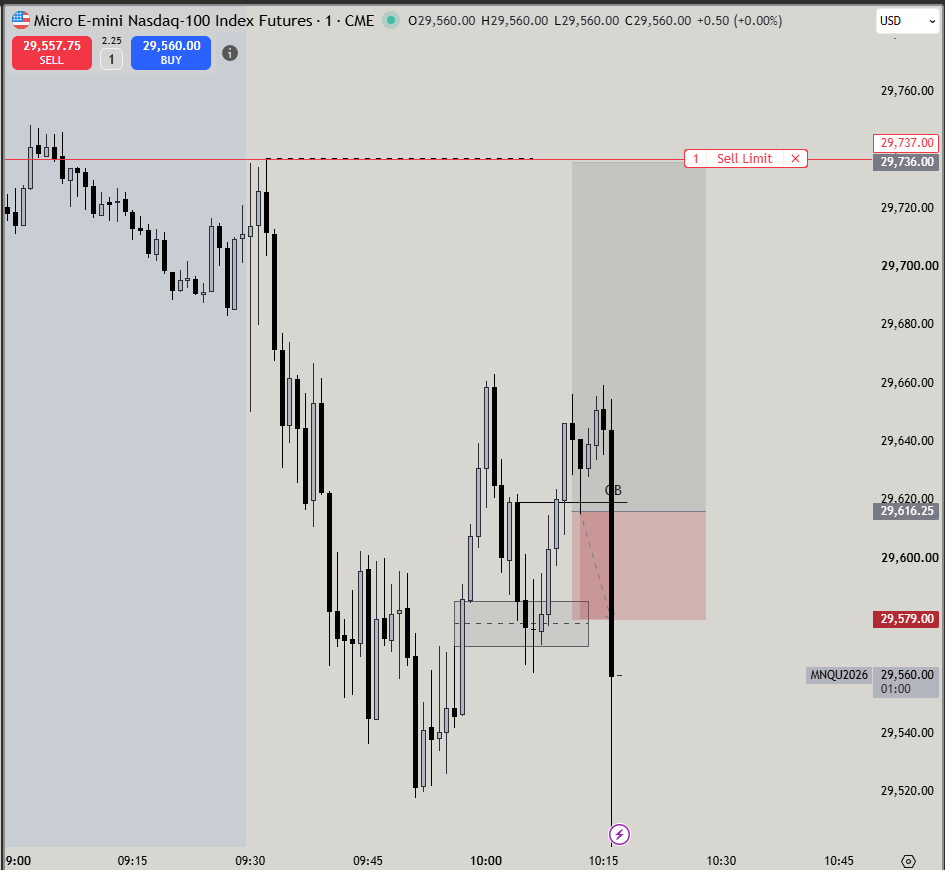
Solid +2r on the AM TBR this morning. Will see what the rest of the New York morning presents, but 2r before market open, on a Monday..... just going to be patient.
Chris™ tweet media
English
9
1
75
3.3K
ClouTy
ClouTy@VClouette·
This is not even funny anymore bro wtf
ClouTy tweet media
English
157
24
995
62.1K
Chris™
Chris™@ProbableChris·
@IgorKrnic Stop is based on the entry function I am using to enter the trade, not based on the data from the AM TBR data set.
English
1
0
0
146
Igor Krnic
Igor Krnic@IgorKrnic·
@ProbableChris I made an indicator out of your video and did some backtest and it is awesome. But I would like to ask on how do you determine where to put stop loss i order to calculate risk?
English
1
0
1
157
Chris™
Chris™@ProbableChris·
@JericoQuek The data provided on nqstats.com is from a 10yr backtest. There will naturally be periods of higher volatility, this is just the market being the market.
English
0
0
1
66
jerico_
jerico_@JericoQuek·
@ProbableChris Hi Chris, the IB range has been regularly breaking past 200 points lately. Based on your parameters, is the 175 points or less rule from your Feb 2026 post still a hard cap, or is there an updated range we should look out for?
English
1
0
0
25
Chris™
Chris™@ProbableChris·
I put together the following example strategy simply to demonstrate how a few straightforward requirements built around a statistical edge can be used to form a strategy. probablechris.com/a-baseline-ib-…
English
8
13
173
17.2K
Chris™
Chris™@ProbableChris·
Lance Breitstein 🇺🇸🌎@TheOneLanceB

EXPOSED: @TRADESBYSCI IS A FRUAD AND I’LL DONATE $1M IF PROVEN WRONG TradesBySci is one of the biggest scammers in the trading space. In fact, I’m so confident in my analysis that I will donate $500k to charity and $500k to one of his followers if Sci provides a VERIFIABLE independent audit or starts using a REAL broker and verifies his trading via @Kinfo. No more talk, no more screenshots, just one independent verification. As someone whose results have been independently verified and audited, I know how difficult it is to produce elite trading performance. That’s exactly why extraordinary claims require extraordinary evidence. My video exposé explains: -Why Sci’s story is BS. -Why the data he screenshots is fake, proves nothing, and is mathematically impossible (which is obvious to anyone that isn’t a dumbass). -How Sci uses a sketchy offshore CFD broker to monetize his audience even when he claims he “sells nothing”. -How Sci uses bot farms to fight the countless scammer accusations. -Why this harms the young, gullible (mostly black) men that idolize and look up to him. If I’m wrong, I put my money where my mouth is. If I’m right, the hundreds of thousands of aspiring traders following this fraud deserve to know the truth. The ball is in Sci’s court. CC: @imantradingYT @realnouratta youtu.be/87iSNJsb05U?si…

QME
0
0
17
1.8K
Ram
Ram@ramtrades28·
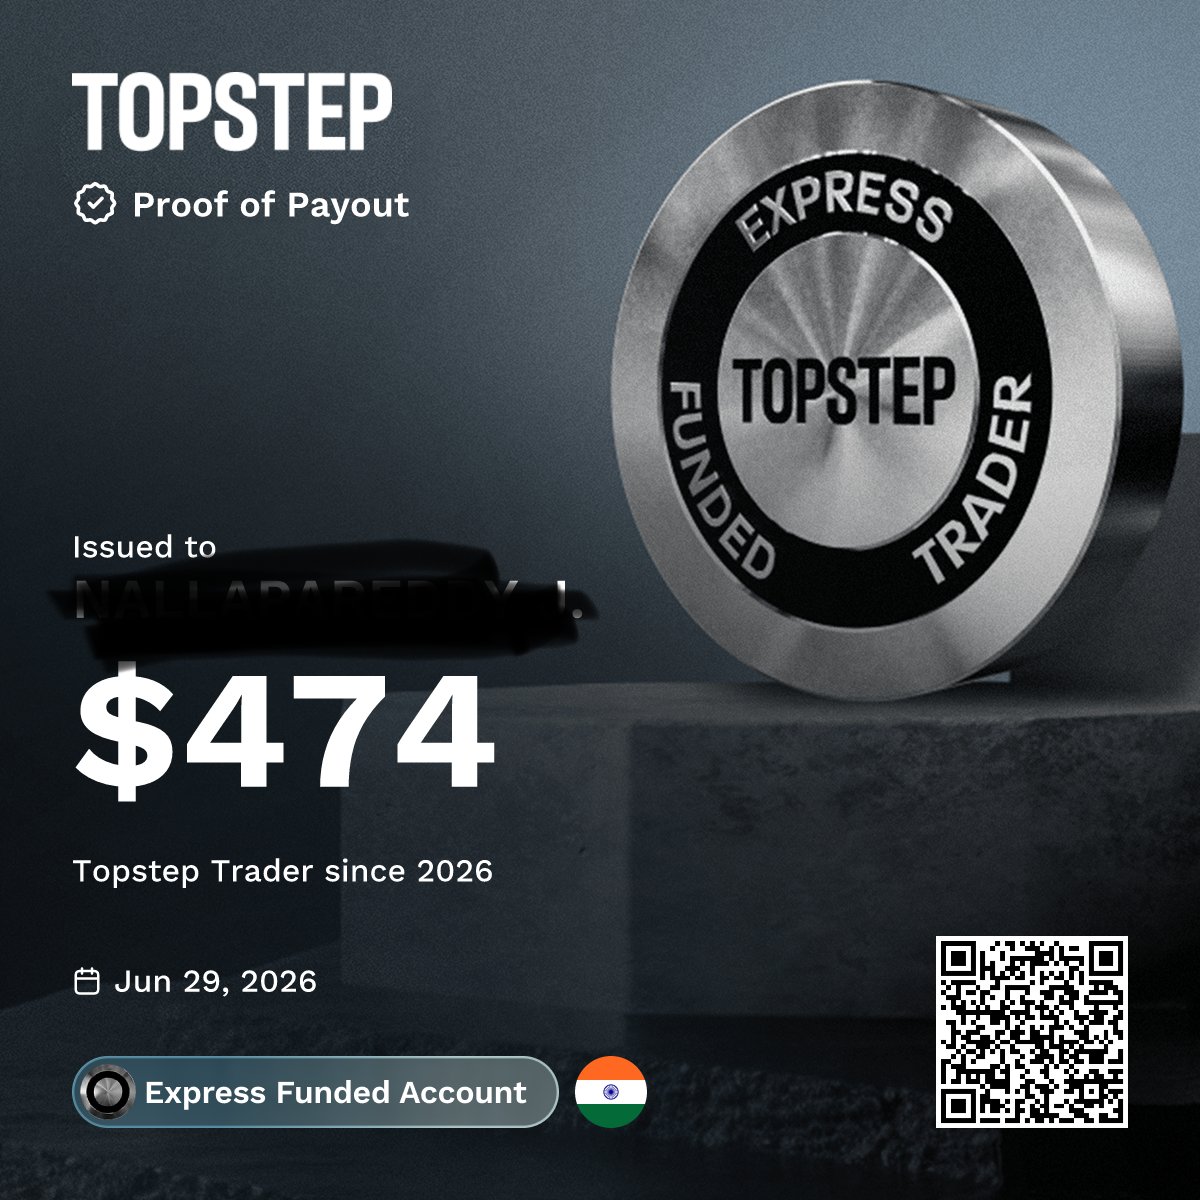
My first-ever payout! I've blown a lot of evals and funded accounts. I kept searching for the "perfect" strategy, but eventually realized that everything comes down to risk management in trading. I still battle revenge trading and oversizing, but @Topstep's risk settings (DLL and position size limits) have helped me stay disciplined and in control. Still long way to go.
Ram tweet media
English
11
1
23
2.5K
Chris™
Chris™@ProbableChris·
@kidnicarus these are price distributions from a rolling 20-day sample. You can learn more about price distributions at nqstats.com
English
0
0
0
91
Chris™
Chris™@ProbableChris·
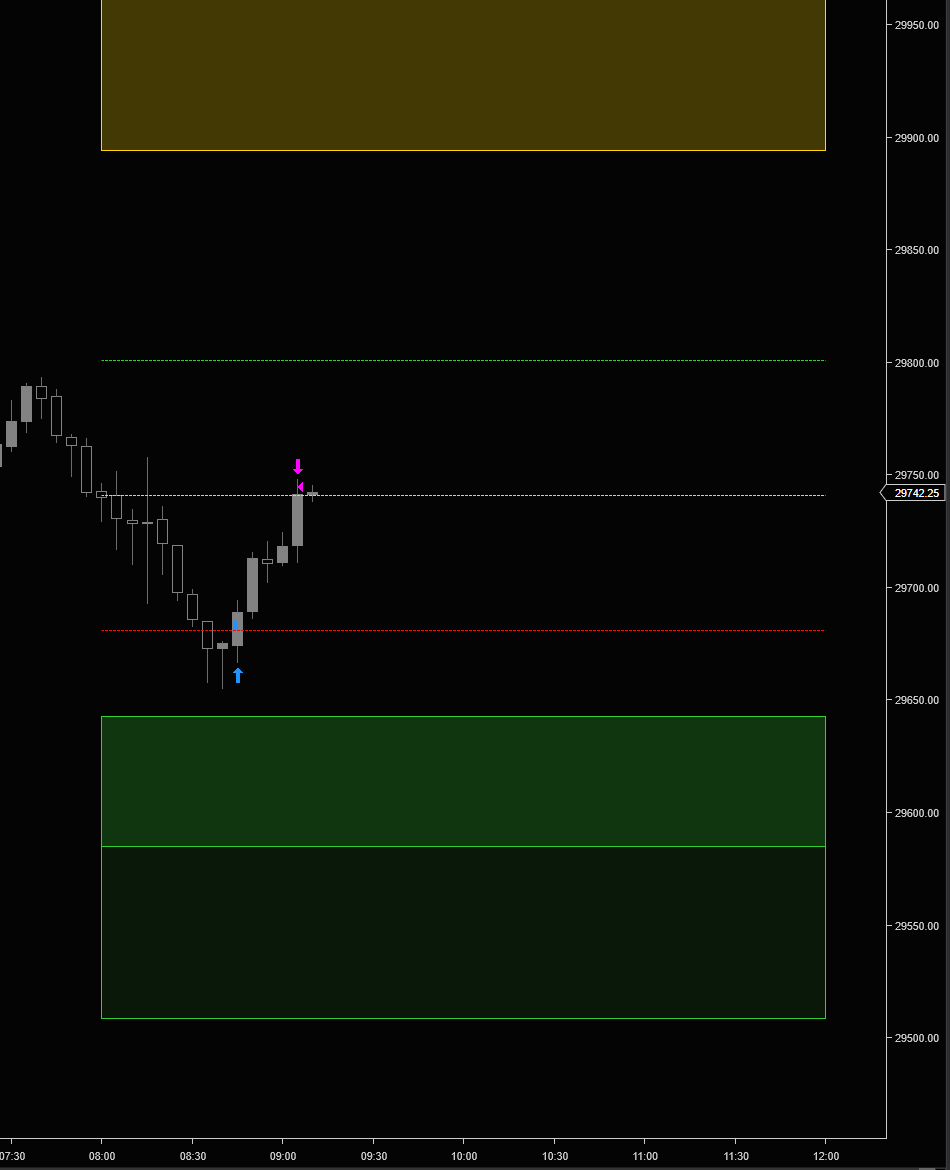
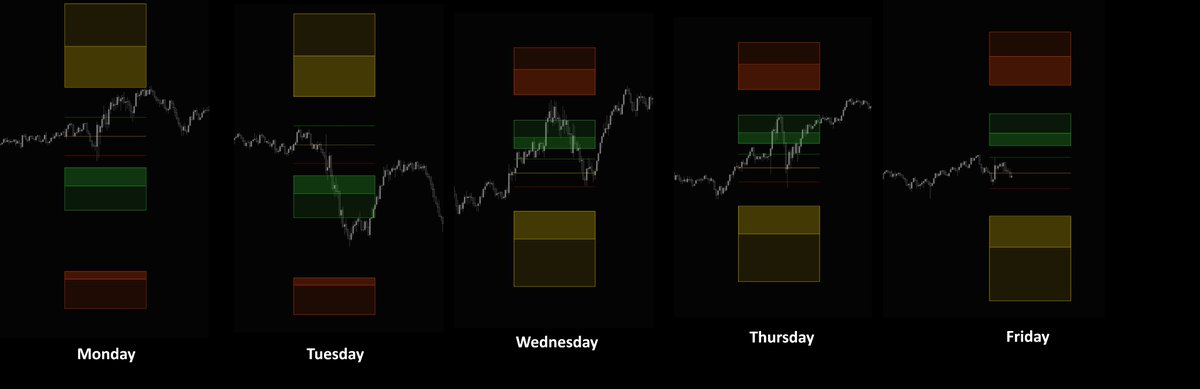
What did the "AM TBR" data look like this week? Monday, gave a clean -0.25 tap and bounce back to TBR Open. Did not dig much into the MAE, so entering on these feels a bit "front running", but the push higher took it to MFE. Tuesday, +0.25 came close but wasnt tagged, -0.25 ended up getting tagged and diving beyond the 95th percentile and stalling there until TBR close. Wednesday, nice push into +0.25 and up into the high percentile of reverted MAE, than a retrace to TBR Open. Thursday, push into +0.25 and ug into the 95th percentile of reverted MAE, formed a clean pivot and retraced to TBR open. Friday, very quick tap of +0.25 and retrace to TBR open leaving no room really for any viable entry, and an entry would of been front running the expected MAE. ------------- Many variations of how someone could of leveraged this data, and from a statistical hit rate perspective, it was 80%. Thursdays setup was the only one I traded, the only one that was clean enough for a trade. Wednesday could of potentially worked too, just seemed choppy at the top.
Chris™ tweet media
Chris™@ProbableChris

New module added to NQ Stats "AM TBR" - nqstats.com/am_tbr.html Have been meaning to get this added to the site, just haven't had time. This is time based range data I use pretty much every day as a confluence/filter for trades taken typically before NY open. The idea is simple, collect a rolling 20-day price distribution of the 8am-12pm time based range. If you aren't familiar with price distributions, check out that section on the site. This rolling distro is used to get the +/- 0.25 sdev values, which are the trigger points. Which ever is hit first, either the + or - 0.25, this creates the expectation of reversion back to the TBR Open (8am open). The site provides total reversion metrics and by-the-hour metrics. I specifically focus on reversions within the first hour (8am hour), as that has the highest hit rate. MAE for reverted and non-reverted events is provided, as well as the MFE beyond the TBR Open, derived from 10yrs of data. You will find various other data pieces on the site, but here is what it looks like on a chart. Video coming soon....

English
5
0
55
6.2K
Chris™
Chris™@ProbableChris·
I combine some price action concepts/candle patterns with some custom tools I made. Entry criteria/triggers need to be unique to you, because its a single component of your overall strategy. Mimicking someone elses entry function, without the full complete process, will not yield the results you seek.
English
0
0
3
144
andrii
andrii@anrew_bart·
@ProbableChris What your triggers to enter trades. Not only in AM TBR trade, but others IB, noon curve etc. Asking how to no get swept and then rage when price go in right direction.
English
1
0
2
117