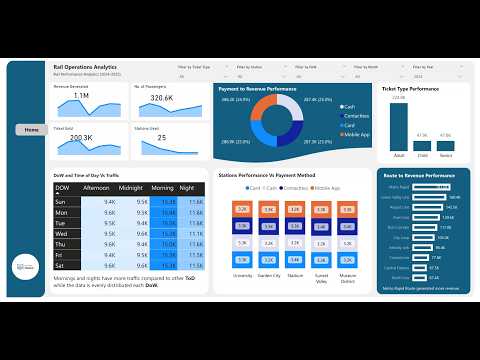
Joseph Opene
1.3K posts

Joseph Opene
@Joseph_opene
Lead Consultant @jiovynixlimited | Helping Businesses Work Smarter/Faster| Data Analytics / Engineer, Power BI, Automation| 7 YOE| Microsoft & Google Certified


Most people still clean Excel data like it is 2012. Copy. Paste. Trim. Filter. Fix errors. Repeat the same steps next week. It feels productive. But it is one of the fastest ways to waste time as an analyst. The real upgrade is this: Use Power Query once, then let it clean your data every time with one click. That shift looks small. It is not. Because the moment you stop cleaning data manually, you stop acting like a spreadsheet operator and start working like a systems thinker. Here’s the difference. Let’s say every Monday you receive a sales file with: - extra spaces - wrong date formats - blank rows - duplicate records - inconsistent column names - numbers stored as text Most people fix all of that by hand. Again. And again. And again. It works... Until: - the file gets bigger - you make a mistake - someone else has to repeat your process - management wants the report faster - you realize 3 hours of your week is disappearing into avoidable work That is the trap. Manual cleaning gives you control. Power Query gives you leverage. With Power Query, you clean the file once, save the transformation steps, and next time the new raw file drops in, you hit Refresh. - Same cleaning. - Same logic. - Far less effort. - Far fewer errors. What happens when you do this right? You get: - faster reporting - more consistent outputs - fewer human mistakes - easier handovers - more time for actual analysis What happens when you do not? You stay stuck doing low value work that feels busy but does not move your career forward. And this is the part many analysts miss: The goal is not to become faster at repetitive work. The goal is to eliminate repetitive work. That is how you create room for better thinking: - trend analysis - root cause investigation - forecasting - decision support Real example: Imagine you spend 2 hours every week manually cleaning branch sales data. That is about 8 hours a month. About 96 hours a year. That is over 4 full days gone on a task Power Query could automate. Now multiply that across: - sales reports - inventory files - HR records - finance exports - customer logs You do not have a data problem. You have a workflow problem. Best move? Start using Power Query for any task you repeat more than once. If the cleaning steps are predictable, they should be automated. That is the standard. The analysts who grow fastest are not the ones doing more manual work. They are the ones building processes that keep working without them. Clean once. Refresh forever. #PowerQuery #Excel #DataAnalytics #BusinessIntelligence #DataCleaning #AnalyticsTips #ExcelTips #DataAnalyst #ReportingAutomation #PowerBI


We recently worked on a Rail Operations Analytics project in the Data Analyst Playbook Community, focusing on answering real business and data questions using a simulated dataset. This project was designed to be beginner-friendly, helping aspiring data analysts understand how to approach real-world problems step by step. In this project, we didn’t just build dashboards; we focused on understanding the business problem first. Key areas explored: • Passenger traffic patterns and peak demand • Revenue analysis across routes and stations • Identifying operational inefficiencies • Translating business questions into data-driven insights One key takeaway: Tools don’t make you a data analyst; your ability to solve business problems does. This is the approach we emphasise in the Data Analyst Playbook Community, learning analytics through real-world scenarios, even as a beginner. If you're building your data analytics skills, focus less on visuals and more on thinking like a business analyst. youtu.be/7eIta0NhJkU #dataanalytics #datavisualization #PowerBI #BusinessIntelligence


You know that feeling when you're tracking your money on paper, and by day 3, you've already lost the receipt, forgotten where you put the notebook, and somehow spent $50 on "miscellaneous"? Yeah... me too. So I decided to build something better. I've been trying to follow the 50/30/20 rule with my finances: 50% for Needs (rent, food, bills) 30% for Wants (that third coffee, concert tickets, random Amazon purchases) 20% for Savings (future me will be so proud) But here's the thing, how do you know you're staying within those buckets if you're not tracking everything? You don't. And that's where the chaos begins. What I Built: A Budget Tracker That Actually Works I wanted something simple. No complicated apps. No syncing to my bank account (honestly, that scares me a little). Just a clean Excel sheet where I could: Log income when it comes in Log expenses as they happen Instantly see which category I'm spending in Know when to STOP spending in a category So I opened Excel and started building. The Features 🗓️ Mini Calendar Add-In Because typing dates manually is so 2010. Now I just click, and the date appears. Simple. Satisfying. Two Macro Buttons I hate repetitive work. So I created two buttons: Income Button – Click it, and your income gets logged instantly into the table below. Date, source, amount. Done. Expense Button – Same energy. Add what you spent, pick the category (Need, Want, or Savings), and it drops right into the expense tracker. No more copying and pasting. No more "I'll do it later" (spoiler: later never comes). Smart Category Tracking Every expense gets tagged: Needs – The non-negotiables Wants – The "treat yourself" moments Savings – The future fund Once I have enough data, I'll know exactly where my money is going. And more importantly, when to stop in a category before I blow the budget. I'm not stopping here. Always up to something.Today it's a budget tracker.Tomorrow? Who knows. But if it solves a problem and makes life 1% easier, it's worth building. What are you working on right now? Drop it in the comments, I'd love to see what other builders are creating. 👇 #Excel #Budgeting #PersonalFinance #AlwaysBuilding #MicrosftExcel #VBA


We started the second cohort of the Data Analyst Playbook Community this week, and it has been an exciting start. 🚀 In our first session, we introduced students to the importance of business understanding when approaching data problems. One of the biggest mistakes new analysts make is jumping straight into tools without first understanding the business context behind the data. We discussed how great analysts think: • What problem is the business trying to solve? • What decisions will be made from the analysis? • What metrics truly matter to stakeholders? To put this into practice, we introduced a realistic Rail Operations Analytics case study. Students will work with a large multi-table dataset simulating a rail company’s operations, including passenger traffic, ticket sales, routes, stations, and pricing. Their task this week is to: • Build a proper data model • Analyse traffic patterns and peak demand • Evaluate route and station performance • Generate business insights that could improve operations and revenue The goal is simple: move beyond dashboards and start thinking like real business analysts. If you're interested in learning Data Analytics, and real-world problem solving, you can still join the cohort. Send me a message if you'd like to be part of the Data Analyst Playbook Community. #dataanalytics #dataanalystplaybook


Do you know Something lives in your house. It doesn't pay rent. You've probably seen it , but you don't really care about it, But it has killed 1,191 Nigerians in six years. And tonight, it'll probably be in someone's kitchen.


