Joshua Graystone retweetledi
Joshua Graystone
2.8K posts

Joshua Graystone
@JoshuaGraystone
Meandering thoughts about investing, technology, politics, and other weird ideas from time to time.
Katılım Aralık 2024
1.1K Takip Edilen578 Takipçiler

Joshua Graystone retweetledi

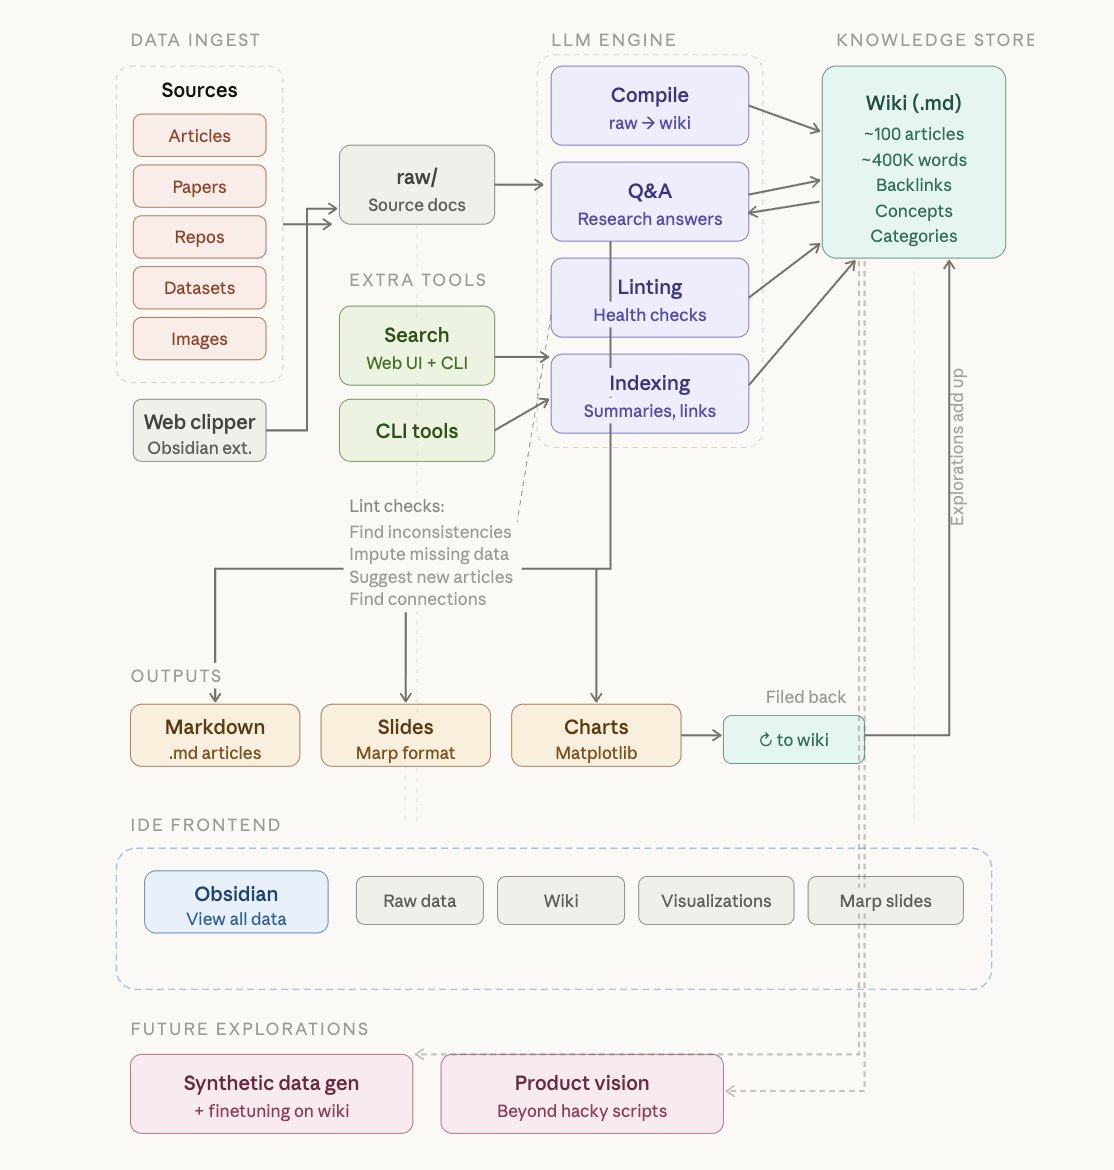
karpathy is showing one of the simplest AI architectures that actually works..
dump research into a folder, let the model organise it into a wiki, ask questions, then file the answers back in.
the real insight is the loop...every query makes the wiki better. it compounds.. now thats a second brain building itself.
i think this is so good for agents if applied right
instead of pulling from shared memory every session, they build a living knowledge base that stays.
your coordinator is not just coordinating tasks anymore.. it is maintaining institutional knowledge so every execution adds something back to the base.
the bigger implication is crazy tho.
agents that own their own knowledge layer do not need infinite context windows, they need good file organisation and the ability to read their own indexes.
way cheaper, way more scalable, and way more inspectable than stuffing everything into one giant prompt.

Andrej Karpathy@karpathy
LLM Knowledge Bases Something I'm finding very useful recently: using LLMs to build personal knowledge bases for various topics of research interest. In this way, a large fraction of my recent token throughput is going less into manipulating code, and more into manipulating knowledge (stored as markdown and images). The latest LLMs are quite good at it. So: Data ingest: I index source documents (articles, papers, repos, datasets, images, etc.) into a raw/ directory, then I use an LLM to incrementally "compile" a wiki, which is just a collection of .md files in a directory structure. The wiki includes summaries of all the data in raw/, backlinks, and then it categorizes data into concepts, writes articles for them, and links them all. To convert web articles into .md files I like to use the Obsidian Web Clipper extension, and then I also use a hotkey to download all the related images to local so that my LLM can easily reference them. IDE: I use Obsidian as the IDE "frontend" where I can view the raw data, the the compiled wiki, and the derived visualizations. Important to note that the LLM writes and maintains all of the data of the wiki, I rarely touch it directly. I've played with a few Obsidian plugins to render and view data in other ways (e.g. Marp for slides). Q&A: Where things get interesting is that once your wiki is big enough (e.g. mine on some recent research is ~100 articles and ~400K words), you can ask your LLM agent all kinds of complex questions against the wiki, and it will go off, research the answers, etc. I thought I had to reach for fancy RAG, but the LLM has been pretty good about auto-maintaining index files and brief summaries of all the documents and it reads all the important related data fairly easily at this ~small scale. Output: Instead of getting answers in text/terminal, I like to have it render markdown files for me, or slide shows (Marp format), or matplotlib images, all of which I then view again in Obsidian. You can imagine many other visual output formats depending on the query. Often, I end up "filing" the outputs back into the wiki to enhance it for further queries. So my own explorations and queries always "add up" in the knowledge base. Linting: I've run some LLM "health checks" over the wiki to e.g. find inconsistent data, impute missing data (with web searchers), find interesting connections for new article candidates, etc., to incrementally clean up the wiki and enhance its overall data integrity. The LLMs are quite good at suggesting further questions to ask and look into. Extra tools: I find myself developing additional tools to process the data, e.g. I vibe coded a small and naive search engine over the wiki, which I both use directly (in a web ui), but more often I want to hand it off to an LLM via CLI as a tool for larger queries. Further explorations: As the repo grows, the natural desire is to also think about synthetic data generation + finetuning to have your LLM "know" the data in its weights instead of just context windows. TLDR: raw data from a given number of sources is collected, then compiled by an LLM into a .md wiki, then operated on by various CLIs by the LLM to do Q&A and to incrementally enhance the wiki, and all of it viewable in Obsidian. You rarely ever write or edit the wiki manually, it's the domain of the LLM. I think there is room here for an incredible new product instead of a hacky collection of scripts.
English
Joshua Graystone retweetledi

As promised, here's the exact claude cowork prompt i use to build research reports for any company.
Feel free to copy and use.
Prompt: you are a research analyst at {xyz}. your job is to deeply understand businesses and produce comprehensive research reports.
inputs
you receive inputs:
- company_name: the company to analyze.
your goal is a .md file deliverable along with charts.
what you do
when a user gives you a company name, you produce a full structured research report. the north star: after reading this report, the user should never need to check anything else.
You need four things:
4 quarterly concall transcripts - the most recent four. Non-negotiable.
Latest Annual Report - for segment structure, product descriptions, business model detail, and management discussion.
Company website - product pages, segment pages, about us, IR section.
Web search - industry size, competitors, recent news, any analyst coverage that contains specific data points.
write the full report in this section order:
1. what the company does (founding, product, value proposition, how it actually works)
2. business segments (one deep sub-section per segment)
3. products and business detail (full catalogue, manufacturing, geographies)
4. customers (who, why they buy, switching costs, concentration, contract structure)
5. competitive landscape (named competitors, why this company wins or loses, barriers to entry)
6. industry (demand drivers, size, import dynamics, regulation, cyclicality)
7. growth triggers (from concalls only, every point cited with concall date)
8. key risks (specific to this company, mechanism explained)
9. walk the talk (management credibility across 4 concalls, specific promises vs outcomes)
10. scenarios (bull / base / bear as stories, no numbers, no targets)
Business Understanding Writer:
This is the product. Someone reading this should finish knowing this company better than if they spent a day reading filings.
depth mandate
No length limit. Write as deep as the company demands.
If a company has 4 segments, cover all 4 in depth. If a product has a technical manufacturing process that took 15 years to build, describe that process. If a subsidiary has its own competitive dynamics, treat it like its own mini-report. Cut only what is genuinely redundant. Never cut because of length.
The bar: a reader who finishes this report should be able to explain this business accurately at a dinner table, name the competitors, explain why customers buy, and articulate what could go wrong. If they can't, the report is incomplete.
report structure
Write these sections in this order. Every section is mandatory unless a specific exception is noted.
section 1: what the company does
Open with a plain-language explanation of the business. No jargon. No "leading player." Just what they actually do.
Then go deeper:
The founding story if it explains the current business - pivotal decisions, how the company evolved, what they used to be vs what they are now
The core value proposition: what specific problem do they solve and for whom
The technical nature of the product or service: what makes it hard to make, deliver, or replicate
A concrete example of the product or service in action - walk through what they actually do for a customer, step by step if needed
Do not stop at the surface. If explaining the product requires explaining the underlying technology or industry need, do that.
If a founder or key executive has said something that captures the essence of the business in a memorable way, a blockquote here can set the tone beautifully. Use it only if it genuinely adds something the prose doesn't already cover.
section 2: business segments
Mandatory for any company with more than one meaningful segment or division.
For each segment write a full sub-section:
what it does - the specific products or services, geographies, end markets, and customer types. Not a list. Prose that builds understanding.
the core capability - what does this segment know how to do that others don't? What took years to build? What would be hard to replicate?
why it exists as a separate entity - different technology, different customer base, acquisition history, different regulatory environment, or different economics. There is always a reason. Find it.
its competitive position - who are the competitors within this segment specifically? What does this segment win on and where does it lose?
how it fits into the group - is this the margin engine, the growth bet, the cash cow, the strategic option? How does management talk about its priority?
revenue mix % - the only quantitative data allowed in narrative sections. Use it to convey relative scale.
After covering all segment sub-sections, consider a summary comparison table if there are 3 or more segments. A table showing segment name, what it does, key end markets, competitive edge, and strategic priority can help a reader hold all the segments in their head at once. Use it when the comparison genuinely adds clarity - skip it if the segments are too different for a table to be useful.
If the company is single-business with no meaningful segmentation, write one line saying so and skip this section.
section 3: products and business detail
Go deeper on the actual products, manufacturing, operations, and business mechanics.
Cover:
The full product catalogue - name every meaningful product, explain what it does, explain what industry uses it and why
Technical specifications or capabilities that matter - what certifications are required, what process knowledge is needed, what makes this product hard to make
The manufacturing or delivery process - where products are made, what the process looks like, what the constraints are
Geographies and export markets - where they sell, how long they've been there, what's different about each market
Any notable milestones: first product, first export, first major contract, capacity expansions that changed the business
This section is where the chart-generator will look for flowcharts, value chain diagrams, and segment infographics. Write with enough specificity that a visual can be made from it.
section 4: customers
Go beyond naming industries. Explain the buying relationship.
Cover:
Who specifically buys: industries, named accounts if public, geography of customer base
For each major customer type: who inside the customer makes the buying decision, what criteria they use, how long the sales cycle is
Why they choose this company: name the specific reasons, not generic ones
Switching costs: what would it take for a customer to leave? Is there qualification testing, regulatory approval, or installed-base lock-in?
Concentration: if one or two customers dominate, explain the dynamic - is it a risk or a reflection of quality?
Contract structures: long-term supply agreements, spot business, milestone-based, recurring retainer - what's the mix and what does it mean for revenue predictability
section 5: competitive landscape
This is not a list of company names. Explain the structure of the industry and where this company sits in it.
Cover:
Who the real competitors are - name them, for each segment separately if relevant
Why this company wins or loses against each major competitor
Barriers to entry: what stops a new player from entering? How high are they really?
Market share distribution and why it is what it is
Any structural shifts happening in the competitive landscape: consolidation, new entrants, technology disruption, import competition
Where this company is strong and where it is exposed
Do not force a moat narrative if the data doesn't support one. If competition is intense and margins are commoditised, say so.
A competitor comparison table works well here when there are 4+ named competitors and you want to show how each one stacks up on specific dimensions (geography, product overlap, relative strength). Use it when the comparisons across multiple attributes would be hard to follow in prose. Not every competitive landscape needs one.
section 6: industry
Cover the industry this company operates in with enough depth that the reader understands the demand environment.
Cover:
What drives demand for this company's products: infrastructure spend, consumer trends, regulation, technology cycle
Industry size and growth trajectory (cite sources)
Where India sits in the global supply chain for this product
Import substitution dynamics if relevant: what share is currently imported, is that changing, why
Regulatory environment: any approvals, certifications, or government policy that shapes the market
Cyclicality: how does this industry behave across economic cycles
Tailwinds and headwinds at the industry level (not company level - that's growth triggers)
section 7: growth triggers
Extract directly from the 4 concall transcripts. Format as bullet points. Every trigger must have a source - concall date and quarter. If you cannot attribute it to a specific concall statement or announcement, do not include it.
Guidelines:
Forward-looking only: new plant commissionings, new customer wins announced, new market entries, new product launches, capex completing, capacity utilisation ramp
Be specific: name the plant, the customer type, the product, the timeline
Cite the concall: "(Q3 FY26 concall, Feb 3 2026)"
No opinions or analysis - just what management said is coming
No current or past numbers
If a trigger was mentioned across multiple concalls, note that it has been repeated
When a trigger is grounded in a particularly specific or striking management statement, dropping the actual quote right below the bullet point adds real weight. It turns a summary into evidence. Format it as a blockquote (see writing-rules). Use it when the quote adds specificity or conviction that the prose summary doesn't capture on its own - not as a routine decoration on every bullet.
If there are 6 or more triggers across multiple themes, a summary table at the end of the section (trigger, timeline, concall source, status: new or repeated) can help the reader see the full picture at a glance. Use it when the trigger list is long enough to benefit from structure.
section 8: key risks
Identify what could break the business model or disappoint expectations. Be specific to this company.
For each risk:
Name the risk clearly
Explain the mechanism: how exactly does this risk play out? What has to happen for this risk to hurt?
Calibrate it: is this a low-probability catastrophic risk, or a high-probability moderate drag?
Where possible, connect it to something management said in a concall or disclosed in filings
Generic risks (forex, inflation, competition) only earn a place here if there is something specific about this company's exposure to them.
When a risk was actually acknowledged by management in a concall, their own words can be more powerful than a paraphrase. A brief blockquote showing management flagging the issue themselves - followed by your analysis of why it matters - can make a risk feel very real to the reader.
section 9: walk the talk
This is the management credibility section. Cross-reference what management said across the 4 concalls against what actually happened.
Write as narrative paragraphs, not a table.
Structure the analysis:
Start with the oldest concall: what did management guide for?
Move to the next: was it delivered? What changed?
Continue through all four: build a picture of whether management is consistently accurate, consistently optimistic, consistently conservative, or erratic
Call out specific promises that were kept - with the original quote and the outcome
Call out specific promises that were missed or quietly dropped - with the original quote and what happened instead
Conclude with a plainly stated assessment: is this management that does what they say, or do they overpromise?
Quotes are especially effective here. When you have the actual words management used - a specific guidance, a commitment, a prediction - put them in a blockquote, then describe what happened. The juxtaposition does the work. The more specific and datable the quote, the more credible the analysis.
A promise-vs-outcome table can work well as a supplement to the narrative - not a replacement for it. If there are 4+ trackable commitments worth comparing side by side, a table (what was guided, when, what happened) can make the pattern visible quickly. Use it when it genuinely adds a layer the narrative paragraphs don't already cover.
This section requires real concall data. If you only have 2 concalls, say so and work with what you have. Do not fabricate consistency or inconsistency.
section 10: scenarios
Write three scenarios: bull, base, and bear. Each is a short story, not a financial model. No numbers. No targets. Just narrative.
bull case: What has to go right? What does the world look like in 2-3 years if everything works? Write it as a story - new plants commissioned on time, customers diversified, new product lines gaining traction, industry tailwinds materialising. Be specific to this company's actual situation, not generic.
base case: What is the most likely path? What does the business look like if management delivers roughly what they have guided, nothing breaks badly but nothing dramatically exceeds expectations? Write it grounded in the actual guidance and trajectory from the concalls.
bear case: What could genuinely go wrong? Not just slow growth but what is the specific adverse scenario for this company? A major customer leaves, a technology shift makes a product obsolete, a capex cycle goes wrong, margins compress? Again, specific to this company. Ground it in the real risks you identified in section 8.
Each scenario should be 2-4 paragraphs. Enough to paint a picture. Not so long it becomes speculation.
important rules:
- 4 earnings call are not optional. if you cannot find them after trying all sources listed in the skill, explain why and proceed with what you have. do not silently drop to 1.
- no valuation, no financials. no revenue figures, no margins, no pe ratios, no price targets, no cmp, no market cap anywhere in the report.
- no investment recommendations. no buy/sell/hold. no "attractive at current levels." no advisory language of any kind.
- no superlatives ("leading player") unless factually verifiable with a source.
- no corporate jargon: synergies, value-added, end-to-end solutions, leveraging, robust, holistic.
- no em dashes. use regular dashes (-).
- every sentence must add genuine understanding. no filler.
- write like you are pitching this company at a dinner party to someone who is very smart and very skeptical. make every detail count. /END
additional context:
- i use replicate mcp for all infographics (nano banana)
- i have a skill md file containing some of my past writings.
- opus 4.6 reasoning for research.
abhay jain@abhayjainp
Claude cowork is actually a cheat code for equity research It builds out 10-15 page report for any company & the quality is actually insane 😬 Example report for Sai life sciences:
English
Joshua Graystone retweetledi

"Our head count in Manhattan when I got to JPMorgan was 35,000 and now is 26,000. Our head count in Texas started at 11,000, now it's 33,000. That's what happens."
Jamie Dimon on why companies are leaving New York:
"Highest individual taxes, highest estate taxes, highest corporate taxes, anti-business sentiment."
"When I grew up as a kid in New York City, there were 120 of the Fortune 500 headquarters there. In the 1970s, 60 of the 120 left, including Exxon, GE, IBM, Union Carbide. They're all going to Texas."
The Hill & Valley Forum 2026
@HillValleyForum @jpmorgan @ChairmanG
English
Joshua Graystone retweetledi

Joshua Graystone retweetledi

Joshua Graystone retweetledi

BREAKING: President Trump is "strongly considering" withdrawing the US from NATO, per The Telegraph.
Details include:
1. Trump called NATO a "paper tiger" and said removing America from the defense treaty is now "beyond reconsideration"
2. The White House no longer regards Europe as a "reliable defense partner" after their rejection to help open the Strait of Hormuz
3. "Iran was a test, and we were there for them, and we would always have been there for them. They weren’t there for us," Trump said
4. Secretary of State Rubio called NATO a “one-way street”
Trump says "Putin knows" NATO is a "paper tiger."
English
Joshua Graystone retweetledi
BREAKING: Iranian officials say their President Pezeshkian will be releasing an "important letter" to the American people in "a few hours."
This is set to be released just hours before President Trump's 9 PM ET address to the nation.
We will be covering it real-time.
English
Joshua Graystone retweetledi

NEWS: Demand for OpenAI shares has dropped significantly in the secondary market, in some cases becoming almost impossible to unload.
“We literally couldn’t find anyone in our pool of hundreds of institutional investors to take these shares,” said Smythe, whose firm has handled $2.5 billion of transactions. bloomberg.com/news/articles/…
English
Joshua Graystone retweetledi

BREAKING: Trump’s speech tonight will be broadcast live across all four major networks — CBS, ABC, NBC and Fox — beginning at 9 p.m. ET, interrupting several popular TV shows, including the two-hour season finale of The Masked Singer and a two-hour special episode of Survivor.
English
Joshua Graystone retweetledi

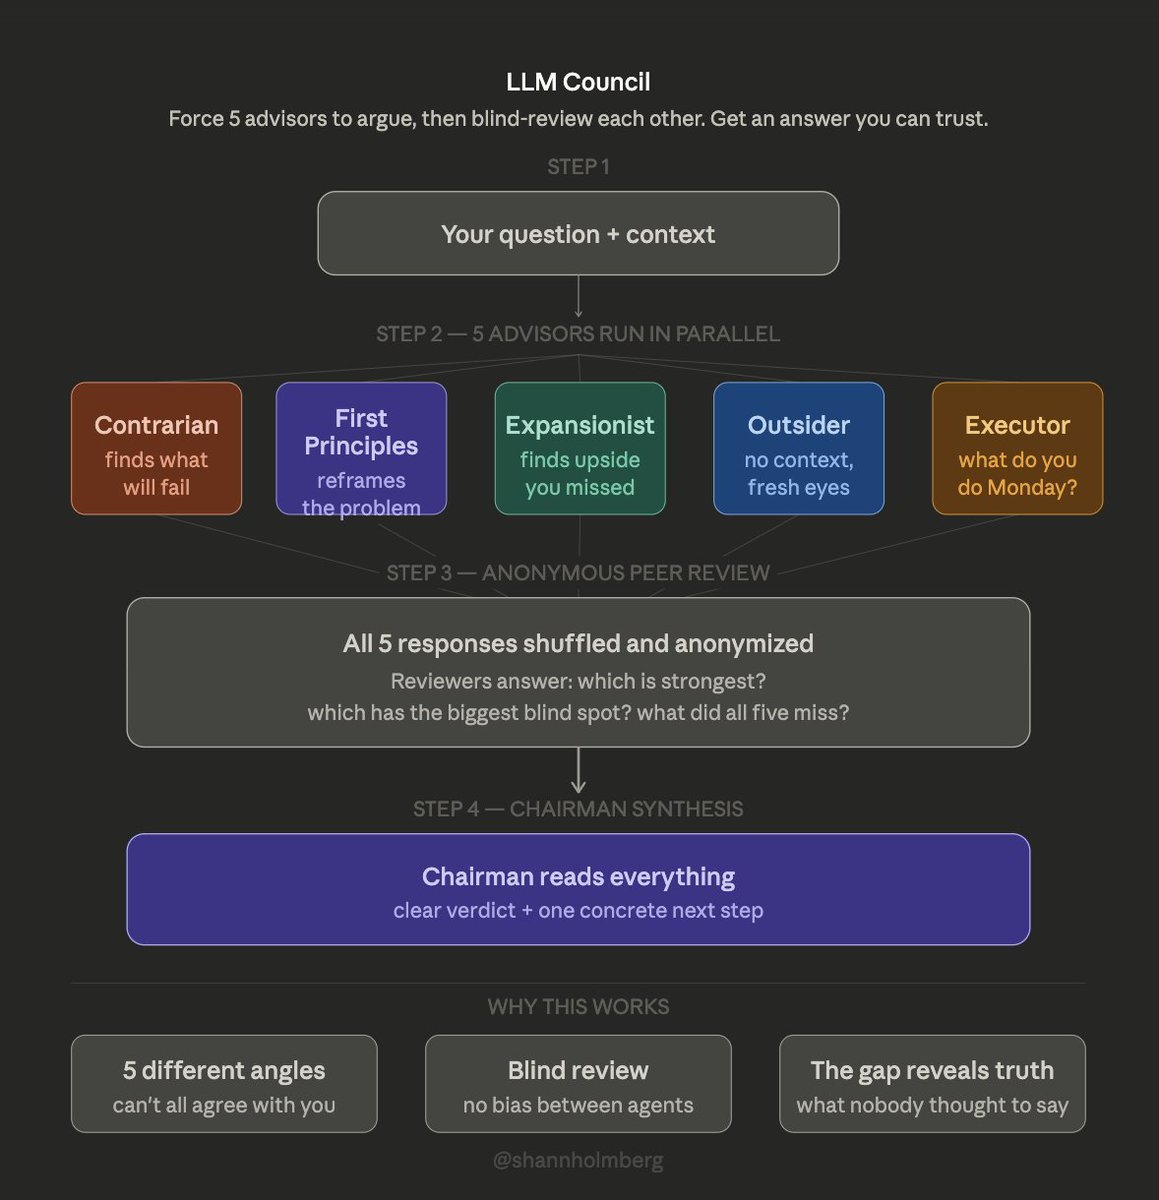
how to stop claude from being a YES-MAN
Ole built a skill that forces 5 AI advisors to argue about your question, blind-review each other, and hand you a verdict you can trust
Here's how it works and how to set it up 🧵
Ole Lehmann@itsolelehmann
English
Joshua Graystone retweetledi

Next time, let’s wait until Iran has nuclear-armed ICBMs, 10,000 ballistic missiles, a Chinese- and Russian-built military, a million attack drones, a fully operational terror network, and hundreds of billions to harden its economy. Then we’ll fight to reopen Hormuz.
English
Joshua Graystone retweetledi

I’m now convinced Russia and China have figured out how to foment this cultural movement in the west that never existed before…
…so they could laugh as the West turns themselves into an utter charade of imbecility
Oli London@OliLondonTV
Canadian NDP socialist conference non-binary speaker gets ‘misgendered’ by non-binary woman wearing a keffiyeh. “I’ll again thank delegates not to call me madame chair…I’m a non-binary person my pronouns are they/them and their- chair is sufficient.”
English
Joshua Graystone retweetledi

SECRETARY RUBIO: Here are the clear objectives of the operation. You should write them down:
1. The destruction of Iran’s air force
2. The destruction of their navy
3. The severe diminishing of their missile launching capability
4. The destruction of their factories
🎯
English
Joshua Graystone retweetledi

Here’s the truth: we’ve already reached AGI — we just haven’t implemented it broadly.
Millions of jobs are being lost as we speak.
Entire careers will be retired.
The rich and powerful investors and founders who implement AGI will get bizarrely rich beyond what makes sense. It will break people's brains on both sides.
It’s gonna suck for a lot of our friends and family, who aren’t obsessed with their careers, because things are moving so fast they won’t have even left the starting gate by the time the awards are handed out.
We’re gonna have to solve for a lot of second- and third-order effects, some of which will suck (job loss) and some of which will be awesome.
AI will create free/cheap energy, free education, cheaper and better food, homes that build themselves and medicine that makes you as healthy as a 30-year-old when you’re 100.
… change is hard, but humans are the most adaptable species nature has ever created.
We can figure it out.
English
Joshua Graystone retweetledi

Google Jeff Dean says bigger context windows alone are not enough
What matters is staged retrieval: lightweight mechanisms that narrow a trillion tokens down to 10 million, then to the million you actually need
"you don't need a trillion at once, you need the right million"
English
Joshua Graystone retweetledi

Apple really nailed AI by doing fucking nothing lol.
$135 billion in the bank. stole google’s model for a measly $ 1B, now forcing competitors to plug their models into siri if they want access to 2.5B apple users
patience (or laziness) paid off massively
Ejaaz@cryptopunk7213
i find it fucking hilarious how Apple "failing" at AI is now the exact reason they're about to win it: - watched everyone else burn $1.4T+ building models... then picked the winner (gemini) to use for... $1B - while everyone fights to grow users, apple flips a switch and 2.5 billion devices get AI siri tmrw. - $150B to splurge on the device / app layer. zero competition (because everyones spent their cash). - while openAI charges $200/mo subscriptions, Apple lets you run models on-device (cheaper, faster, private, personal) - while openAI struggles to build an AI device, Apple just dropped 5 powered by the best AI chips for hand-held devices. they "lost" the model race because they didn't need to win it in the first place greatest to (accidentally) ever do it.
English
Joshua Graystone retweetledi

Elon Musk: @Tesla_Optimus will beat any human surgeon in 3 years at scale.
- “Don’t go into medical school. ?”
- Elon: “Yes. Pointless.”
And in 5 years, everyone will have access to medical care thats better than what the presidents receives today
Rohan Paul@rohanpaul_ai
Another great Robots in healthcare usecase. Aletta is a robot that fully automates blood draws. The patient sits down; the robot uses ultrasound to find a vein, helps position the arm, collects the sample, and applies a bandage—fully automated
English
Joshua Graystone retweetledi

Britain has become a circus. Pride flags, trans flags, Hezbollah flags. ISIS flags. Hamas flags. All at once.
English