Kamal
2.9K posts

Kamal
@Kamalde00211896
BI Specialist I Seven West Media I Tableau I Alteryx I Sql I Data Viz Enthusiast I Data Visualisation & Story Telling I Half Marathon Lover !
Sydney , Australia Katılım Mayıs 2020
667 Takip Edilen537 Takipçiler


A not-so-hidden secret, #datafam... I have been on the losing end of a very long battle with weight. I cannot attend another Tableau Conference if I am at this weight because of the physical pain it causes with old surgeries and joint issues flaring up more.
I am committed to sharing my weight loss journey because I need accountability and support. I was at my heaviest one month before the conference but have a much longer battle ahead. This means much more exercise and a healthy and natural reduction of caloric intake.
Attached is me in August of 2016 (41 years old) at ~80 lbs less than I am now and that is my goal by #Data25 to feel healthy and reduce the risk of severe health problems. We are here for each other and feel free to let me know if you want to take this journey together. #Healthy4Data25

English


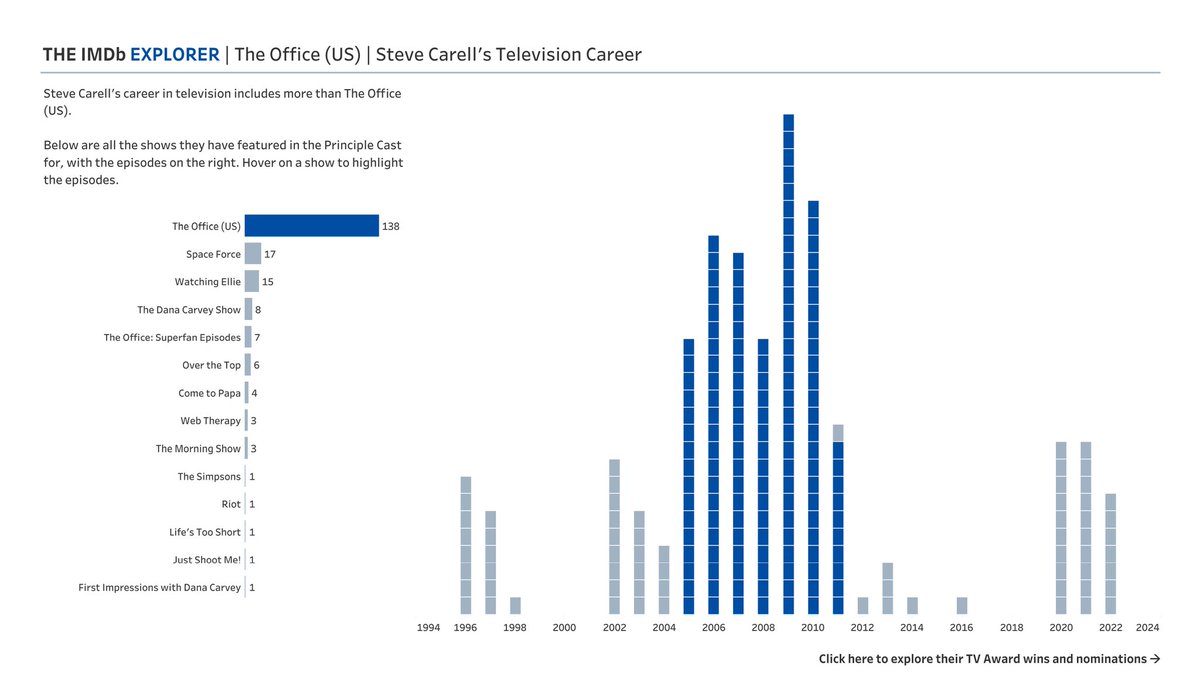
🚨🏆 NEW VIZ! 📺
The IMDb Explorer, my #IronViz final dashboard, is your tool to uncover the stories within your favourite TV show. Have fun exploring, #DataFam!
🔗 bit.ly/4aXKJYV


English

Delve into Leah Warner-Tedald's 2023 reading journey with this #VizOfTheDay. Explore 35 books by genre, each accompanied by Leah's personal reviews and ratings. tabsoft.co/3NN1yMw

English
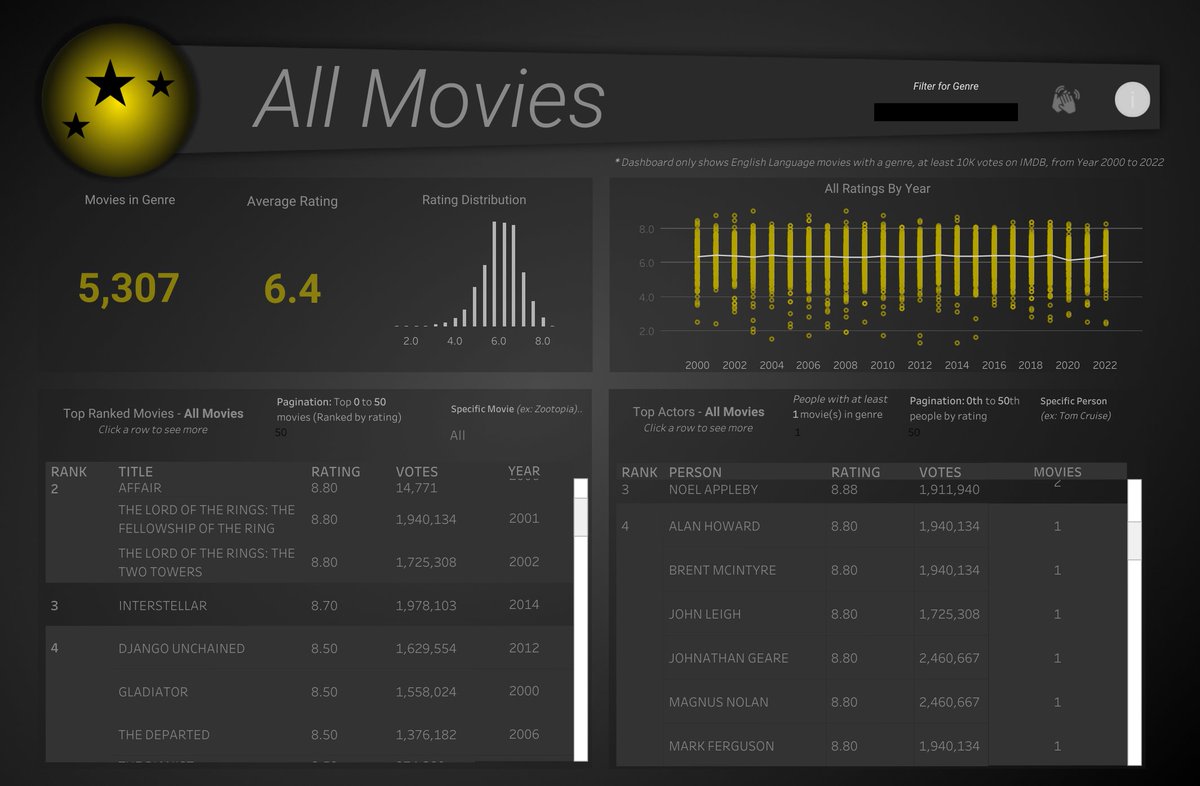
Explore thousands of movies from the IMDb database in this #VizOfTheDay by @JeremyJ52728256—a #DataPlusMovies entry.
Use the drop-down menu to filter by genre and uncover insights about your favorite films and the actors who star in them. tabsoft.co/47xbzEQ
English

Discover the most popular Indian stars of 2023 with this #VizOfTheDay by @im_akeelah.
This network chart showcases the interconnectedness and collaboration among these celebrated stars. A #DataPlusMovies entry. tabsoft.co/3NsJV4l

English
Explore this #VizOfTheDay by @GGorczynski, a collection of common custom map types. This viz was inspired by the work of former Tableau Researcher @mapsOverlord. tabsoft.co/3RsQE0A
GIF
English
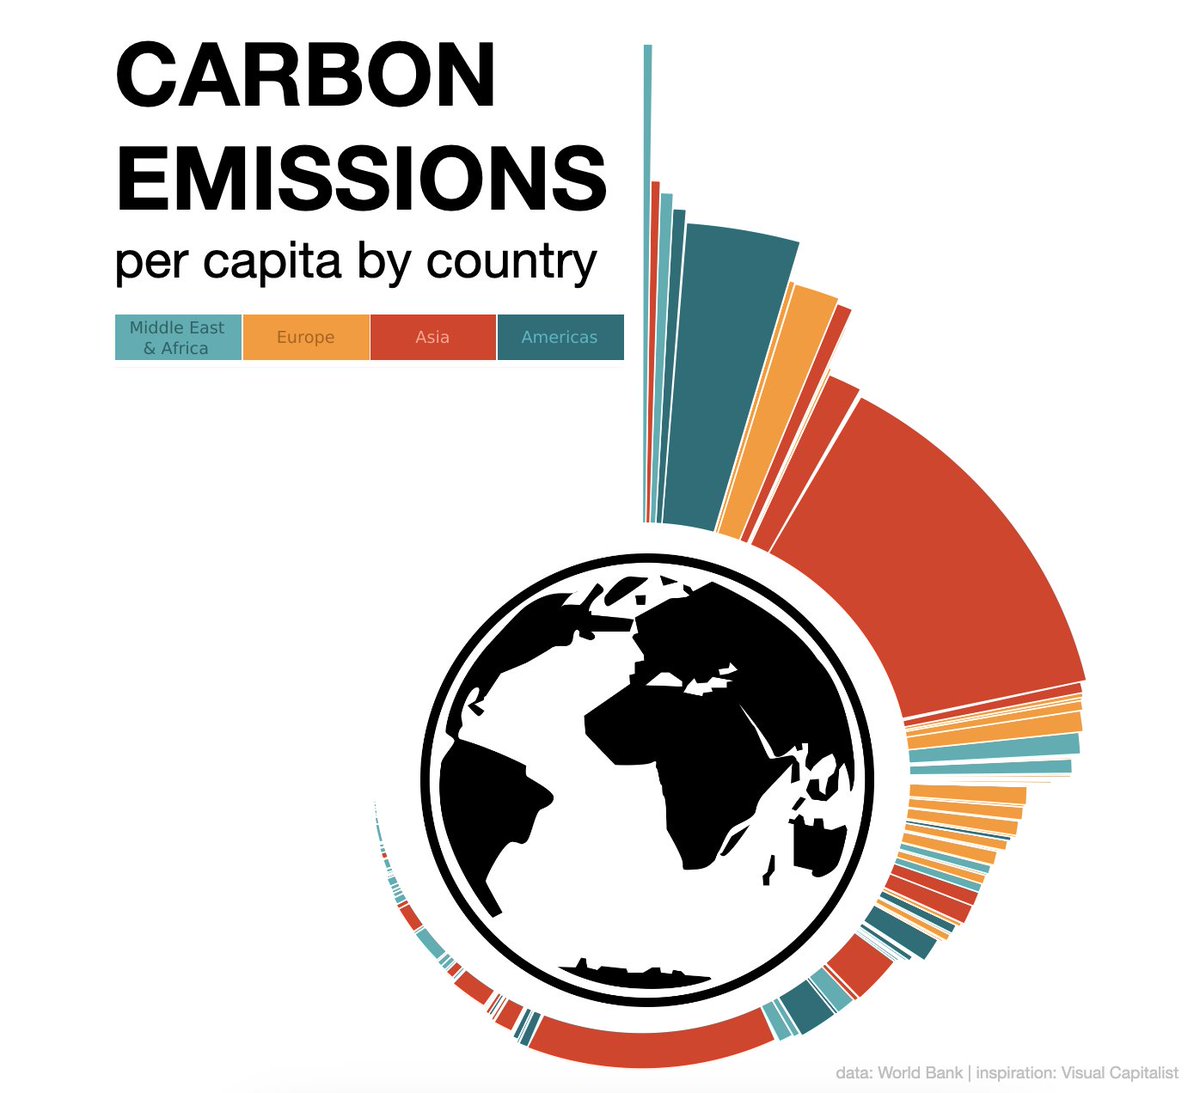
Featuring a radial marimekko, @doc_insight illustrates carbon emissions per capita around the globe. Explore this #VizOfTheDay. tabsoft.co/413PSul
English


Ah, thanks for resharing this, @tableaupublic! 😊
Tableau Public@tableaupublic
Explore the biggest blockbusters of 2019 in this #VizOfTheDay from the vault by @FlerlageKev. Dig into the viz to see which movies were most profitable and which production companies released the biggest hits: tabsoft.co/47sXzvZ
English
According to this #VizOfTheDay by @GhafarShah9, there are over 10,000 haunted places in the United States. Curious to know more? Just boo it. tabsoft.co/3QEfydr

English
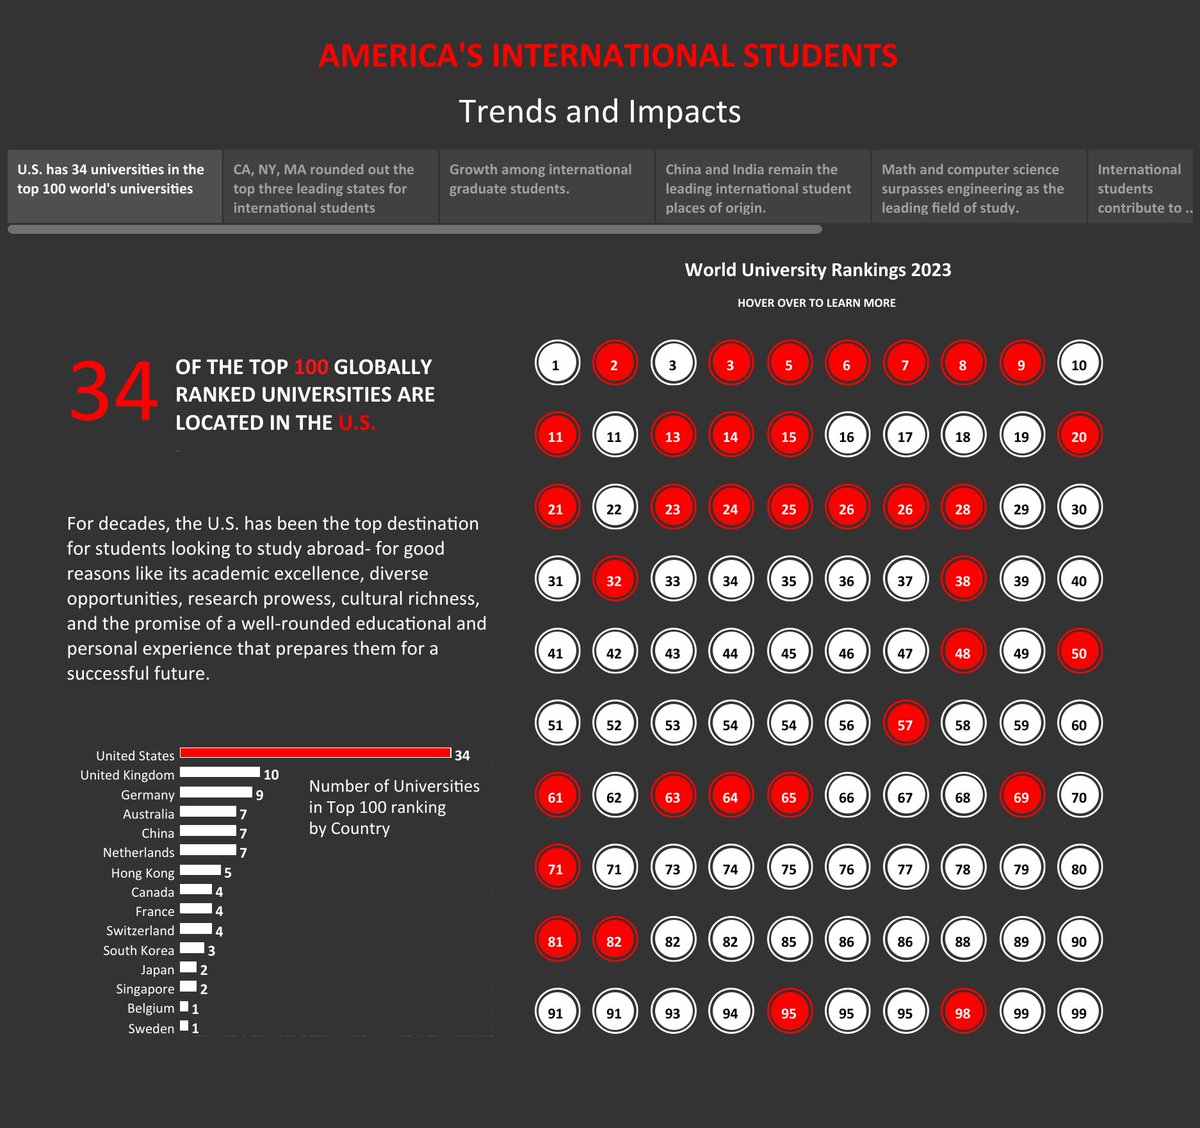
Explore key trends, impacts, and challenges faced by international students pursuing education in the U.S. in this #VizOfTheDay by #ChartChamp winner @Lodhaviz. tabsoft.co/45K6Crf
English
Monitor and manage financial performance with this #VizOfTheDay by @pradeep_zen.
Inspired by the Budget Controlling Accelerator on the Tableau Exchange, this dashboard allows users to track spend and identify cost-saving opportunities. tabsoft.co/3MeRqvc
GIF
English

Ahh!! Thank you Tableau! This will forever be a very special viz to me. Having it as #VOTD is creating so much awareness for #ChiariMalformation, which is all I truly wanted 💜🎗️
Tableau Public@tableaupublic
In this #VizOfTheDay, @dataunjaded shares her recent Chiari Malformation diagnosis. Explore this data viz to learn more about this condition and her journey with it. tabsoft.co/3rA6RY1
English
Tableau Tip
You can leave the calculation window up and make changes to it all while flipping through sheets and dashboards to see the impact of those calc changes. I use this all the time.
Link (See #1): flerlagetwins.com/2022/02/ten-ta…
GIF
English
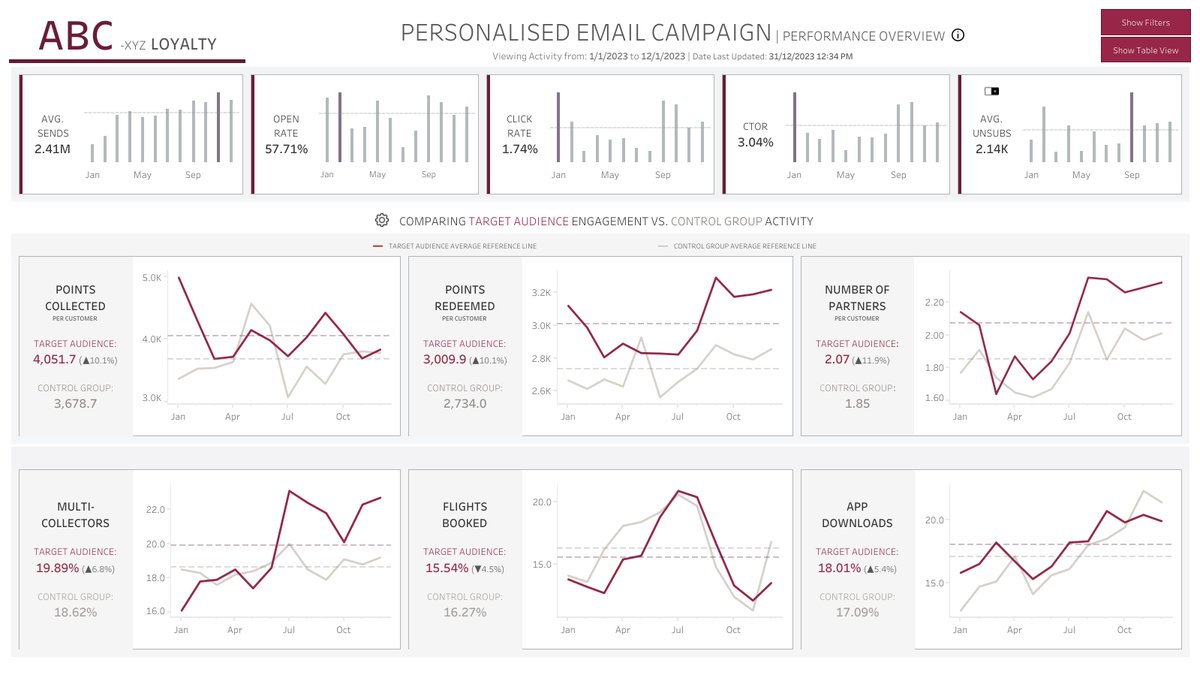
Explore this #VizOfTheDay by @_muneebsajjad_ to see the effectiveness of an email campaign and its impact on user engagement and loyalty program activities using demo data. tabsoft.co/46a72HS
English
Do you know the most common source countries for immigrants to Canada? Find out in this #VizOfTheDay featuring a bump chart by @Sunhpiris.
Explore this viz to see changes in rankings from 2018 to the present.
tabsoft.co/3PC7Kbo

English
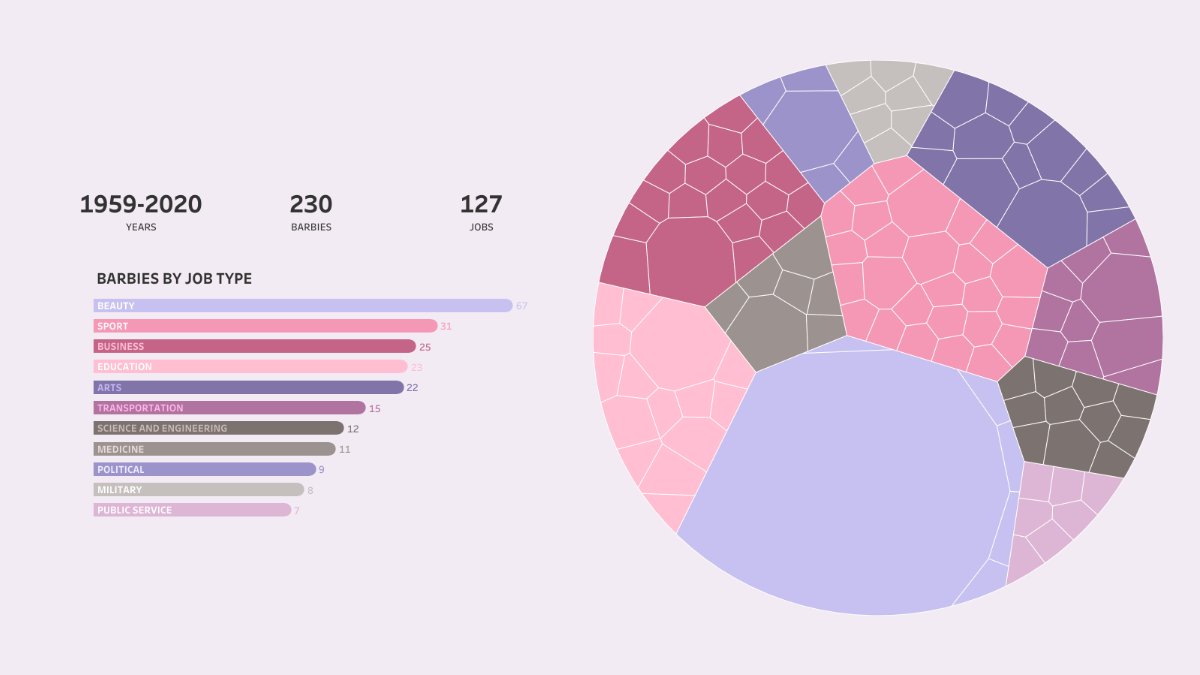
Featuring a Voronoi treemap, this #VizOfTheDay created by @datadrawnYuan visualizes the diverse careers Barbie has pursued from 1959 to 2020. Elaine used @ladataviz’s Voronoi generator to create this viz. tabsoft.co/45SAHW9
English