Sabitlenmiş Tweet
Kekoa
731 posts


Kekoa
@KekoaCap
FinX Observer - here for entertainment purposes only.
Katılım Ocak 2021
728 Takip Edilen113 Takipçiler

Omg this Knicks comeback wild!
Down 22 in the 4th.
Like 0dte final 15 minutes -99% and you go ITM for +500%.
My goodness…
English
@stockjock84 @neilksethi Running 10x leverage a 2% drawdown is really painful!
English

@neilksethi If you were to base if off twitter feed or bberg chats this week was a bloodbath.
English

Despite the down session, SPX on track for its 7th straight weekly gain (it needs to finish better than -1.37%).
That would be the longest winning streak since the week ending Dec 29, 2023, when the market rose for nine straight weeks.

English
Commodity cycles and financial assets don’t tend to play nicely with each other for very long - 70s, 00s. Half the market is already in a bear market. Where are we going to from here fam?
Neil Sethi@neilksethi
From the Markets Update (neilsethi.substack.com/p/markets-upda…): How is nobody talking about copper? US copper futures (/HG) up another +2.3% (+14.5% since May 4th) to a fourth straight all-time closing high and breaking out of a 6-year channel that it has previously only closed above one day. RSI is now the highest since July.
English
@JaredKubin I think better to look at SOX and hardware. Negative weight today from Software + lagging of the AI spenders (e.g. MSFT, AMZN, META, ORCL) distorts the QQQ comparison.
New slogan:
“SOX to 15k then walk away”
English

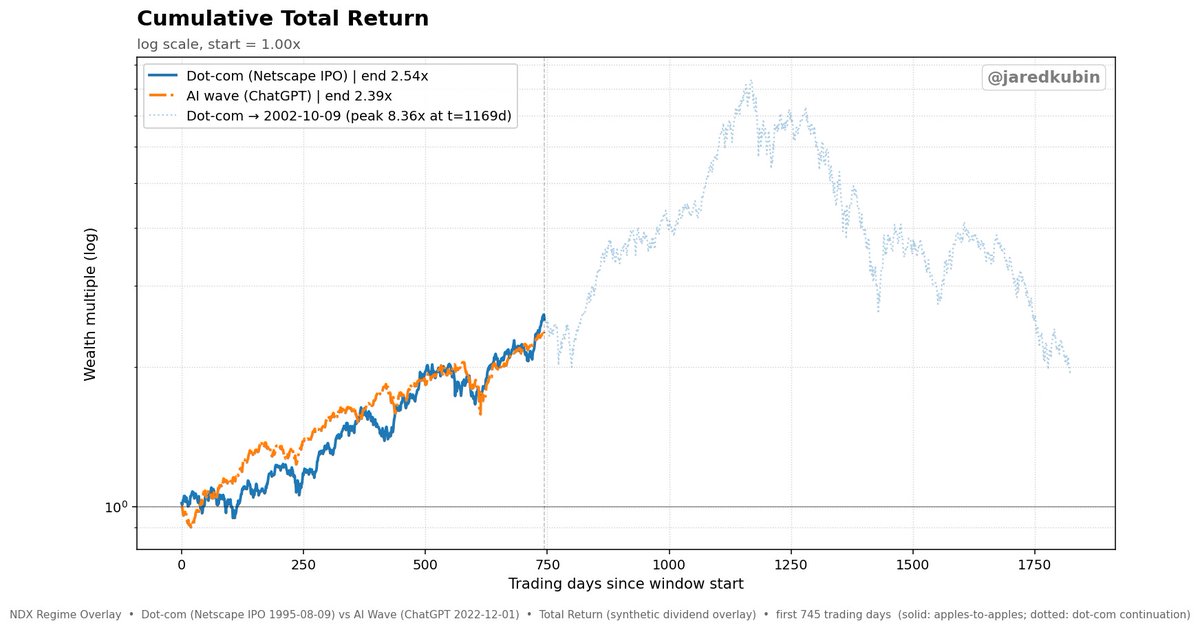
ARE WE IN AN AI BUBBLE?
JLK CONCLUSION: Probably in some pockets we are frothy, but calling it "dotcom 2.0" is just not true and lazy
What makes this more complicated is AI doesn't look exactly like the 90s. It looks better in a lot ways and scarier in others, and if you stare at the comparison too long it could paralyze you & your portfolio (this is a hint to watch my RISK series)
WHAT DOES THE DATA SAY??
To get some context I compared the Nasdaq100 today against the dotcom cycle. The cumulative total return shows how much a dollar grew, and right now AI is actually trailing dotcom's absolute price pace
VOL-matched returns levels the playing field by giving both eras the same VARIANCE CHAOS, which makes AI look stronger per unit of risk
Tech specific alpha strips out the broad market moves to show that AI is detaching from the S&P 500 much faster than dotcom did at this age
Finally the relative strength is a simple ratio of NDX vs SPX where AI is up 27% while dotcom was basically flat
FULL SEND DOWNRANGE
On pure returns AI isn't as crazy as dotcom yet.... At day 745 dotcom turned $1 into ~$2.55 while AI is at $2.40. Even if the absolute price is lower, it’s breaking away from the S&P 500 way faster..... The Nasdaq is beating the S&P by 27% right now, whereas in the 90s that gap was 0% at this stage because the whole market was rising together
AI has an 8% lead after stripping out market noise, while dotcom was actually -17.3% behind the trend at the same age
DONT TREAT THIS LIKE A MAP... i repeat....because you can def torture data until it confesses. The fundamentals are different since 1999 was full of cash burning IPOs while today is led by mega caps with massive cash flow. Valuations are different too since dotcom P/Es hit 75x(+) while we're closer to 30x now. Even the start dates are a guess because if you used Nvidia's earnings instead of ChatGPT as the "start," the whole chart FLIPS... do your own analysis if you want
SO WHAT?
AI is detaching from the market way earlier than dotcom did. It is UNLIKELY to follow the same path... and could peak faster, more violent, and sooner if I had to guess. Good luck out there! Manage. Risk.


English
Kekoa retweetledi


A warning to all competitors — if you come at the king you best not miss
tae kim@firstadopter
Alphabet: "We expect our 2027 capex to significantly increase compared to 2026" $GOOGL SIGNIFICANTLY BOYS AND GIRLS
English
@WaterworldCapi1 Supply driven recovery. English proficiency, non-domiciled CDL…—> causing spot rates to move. Demand remains muted generally, so TBD how far recovery will go. If demand improves given supply changes, could see a big recovery. But that seems unlikely w/o housing, etc
English

Trucking stocks are insanely priced here, imo. Recovery more about cadence of shipping around tarriffs than anything.
English

I'm seriously scratching my head on this $EFX move.
This is an obviously correct take.
English
@WaterworldCapi1 LT potentially erodes pricing power (growth) and if switching accelerates the actual earnings power of the business. Stock has gotten a lot cheaper, but $TRU trades at a mid-teens multiple, why couldn’t it go there (or lower). Itself trade low teens post-GFC
English
@WaterworldCapi1 Depends on type of loan. Vantage has more penetration in other areas outside mortgage where FICO had a monopoly. Scores essentially perform the same; which suggests value is in the credit file not algorithm. Switching will be low initially as people test.
English
Why don't people like $FICO? Seems kind of cheap.
English
@JoshYoung What area are you staying? Was there a month ago and agree!!
English


Will be interesting to see if we see a wave of SaaS consolidation over the next decade as we've seen repeatedly in the semi industry.
Everyone is beaten up so might as well clean up all the competition from duplicative products / opex. And everyone's multiple is beaten up so no need to fight when merging.
Industry would come out looking way better on the other end.
ERP -> CRM + WDAY + NOW + HUBS + FRSH
SECU -> PANW + CRWD + ZS + S + CHKP
MAKE -> ADSK+ PCOR + ADBE + PTC + SNPS + CDNS
DATA -> MDB + ESTC + DDOG + GTLB + SNOW
COLL -> TEAM + MNDY + ASAN + FIG
SMB -> INTU + TTAN
Then we could have the equivalent of NVDA, AMD, INTC, AVGO, MRVL, TXN, etc. and move on with our lives.
The resulting 6-8 entities would grow 5-10% yy, have 50% GAAP operating margins / 40% net margins, and trade at 20-25x (8-10x sales) equating to a 4-5% yield.
English
@TechFundies That is the natural order. Bubble, bust, consolidation, revival
English
@WaterworldCapi1 Don’t disagree, unless oil/inflation shock rapidly reverses (seems optimistic). Markets always seem to wile e coyote….COVID a great example, ignored until arrived at the door. Subprime was contained, until it wasn’t.
English
@KekoaCap Most of the things that are caution flags I look for happening.
Weak technicals on broad markets.
Bad breadth.
Oil/inflation shock.
Started out at high prices/lack of bargains right now imo.
I honestly don't see a great bull case.
English
Probably the least healthy market since 2022 at least..
English
@WaterworldCapi1 Doesn’t necessarily mean disaster (e.g. 2015 - energy/industrial implosion, 2018 - Fed tightening) for the broad indices, but always at least a yellow flag for me.
English
@KekoaCap Understand why the lows would show up but theory as to why a lot of highs ahead of bad markets?
English
@WaterworldCapi1 Theory is bull markets are strongest when broad and all groups going in same direction (more horses pulling the cart). When market narrows to a group of stocks still working while others are getting shot, usually a sign of vulnerability.
English