
KEVIN @MMT
8.6K posts
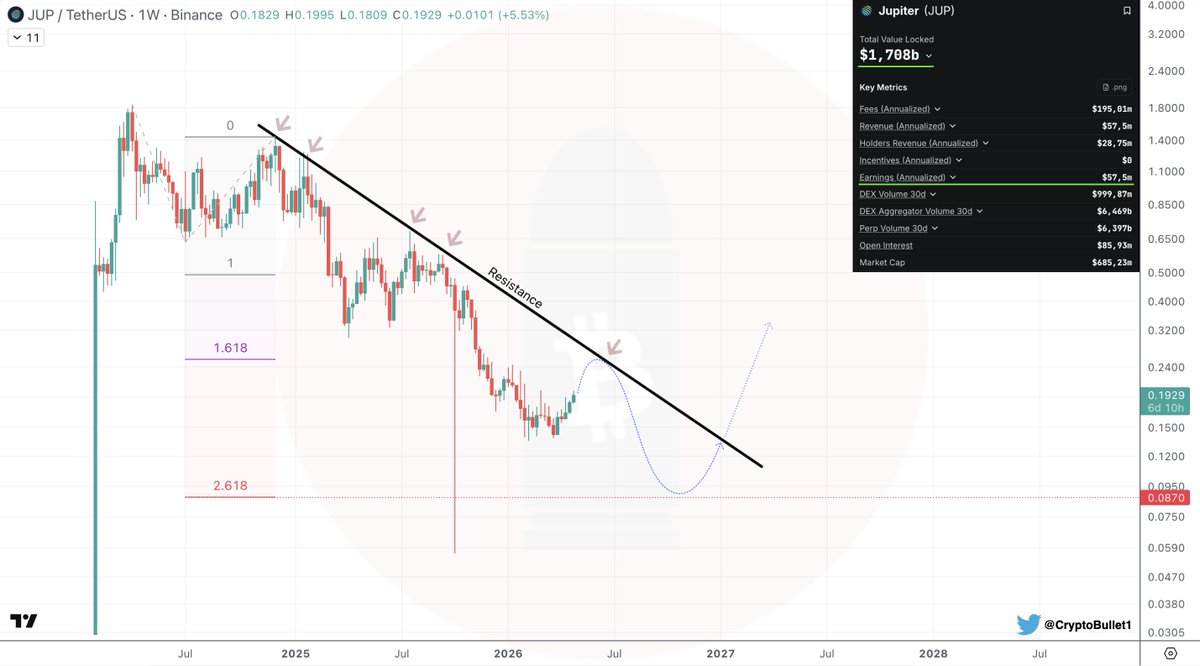
One of the $Alts I'm planning to accumulate this year is $JUP
A liquidity infrastructure and super-app on Solana
Bottom in Q4 2026 📍
Breakout in 2027 📈
English


1) $BTC 74 - 80k soon
2) bottom is in
3) Trump's term is over
4) Democrats will win mid term elections
5) all tariffs will be refunded
6) no strike against Iran
7) stocks will hit new all-time highs
8) alt season begins in 2027
9) no market crash until Q3 - Q4 2026
This is the future.
English

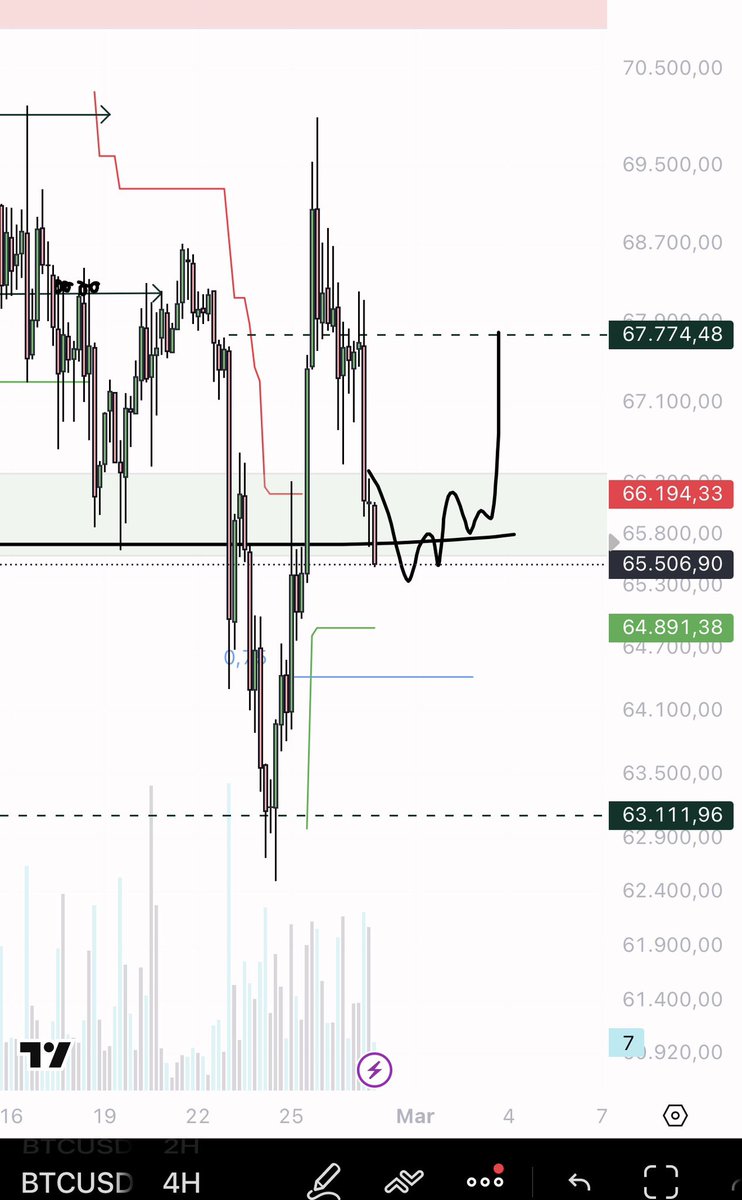
$BTC We've arrived where we wanted to be, but I'll only be a buyer if we get a sweep at 64900/500 h4.
Until then, nothing important. I have no desire to take any chances with Trump being a pain in the neck.
EliZ@eliz883
Yesterday, what we had to do was done perfectly. Now I will become a buyer again only near the indicated box, above the one looking for long scalps. $BTC
English

As the industry moves towards the tokenization of everything, Fidelity's Center for Applied Technology (FCAT®) is well-suited to help secure assets moving across chains.
The FCAT DVN is now live and already verifying value movement going between chains for @OndoFinance.
Fidelity Center for Applied Technology (FCAT®)@FCATalyst
The FCAT DVN is now live on @LayerZero_Core! The DVN offers foundational infrastructure for institutions seeking trustworthy cross-chain operations. Leveraging LayerZero’s neutral interoperability infrastructure with FCAT’s verification capabilities, @OndoFinance is the first organization to use the DVN. Check out the full story now: fcatalyst.com/trends-and-sig… #FCAT #Web3 #Interoperability #Blockchain
English


@Vivek4real_ He is with billions in red
Dont think he is a bullish indicator
English

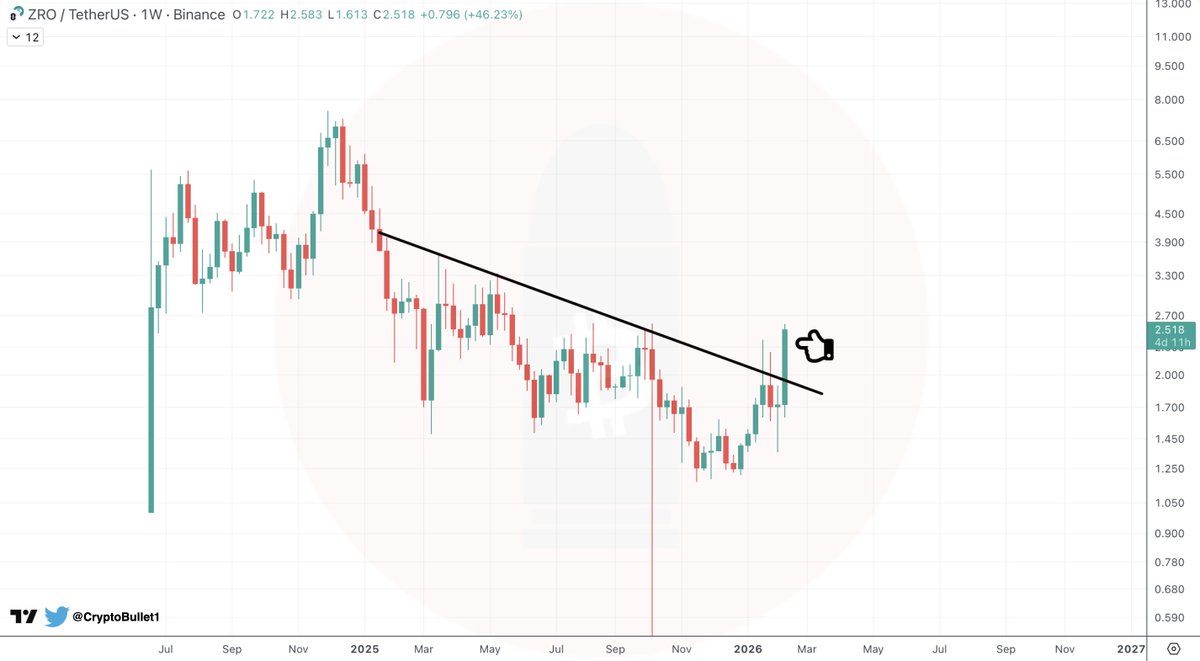
@CryptoBullet1 Told you weeks ago to Watch Layer Zero
Seems Like there is a Breakout now
What you think? News are also Pretty good :-)
English
$BTC 1W chart | Game plan for the rest of the year
The 200-Week MA will be broken eventually 📉
🎯 Next Target - $48-50k (the August 2024 low is a magnet)
Fibs confirm my Bear Market Bottom Target of ~40k 🏁

CryptoBullet@CryptoBullet1
Let me explain my $40k +/-5k #BTC Bear Market Bottom Target One of the Key indicators that I pay attention to during bear markets is $BTC Realized Price [ Realized Price is value of all coins in circulation at the price they last moved, in other words an approximation of what the entire market paid for their coins ] Every Bear Market #Bitcoin tests the Realized Price level and breaks below it 📉 In 2011 $BTC went -66% below the Realized Price In 2015 $BTC went -48% below the Realized Price In 2018 $BTC went -35% below the Realized Price In 2022 $BTC went -33% below the Realized Price And in 2026 we’ll also see $BTC going below the Realized Price (currently sitting at $56k) Keep in mind that in Bear Markets the Realized Price usually slowly declines, so the levels might slightly change. If we’re gonna repeat the 2022 Bear Market, -33% below the Realized Price would be $37.4k. As I mentioned, the Realized Price will likely decline this year, so by Q3-Q4 in can be at $53-54k and -33% would be around $35k. That’s the lowest I could see $BTC go this year. As we can see, over the years BTC Volatility has decreased and the distance between the market Price and Realized Price has narrowed: from -66% in 2011 to -33% in 2022 So I believe in 2026 we will have something between -24% & -31% below the Realized Price which means $40-43k That’s basically how I came up with my $35-45k Bear Market Bottom Target using this on-chain indicator
English

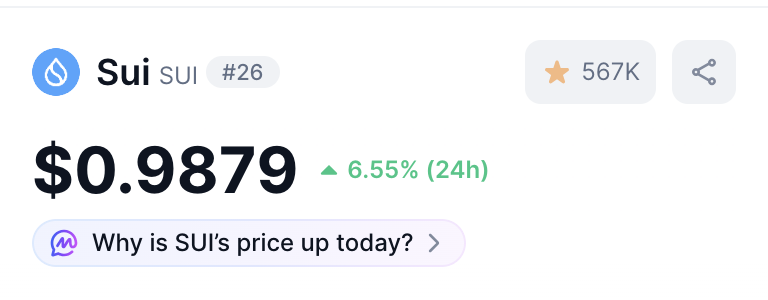
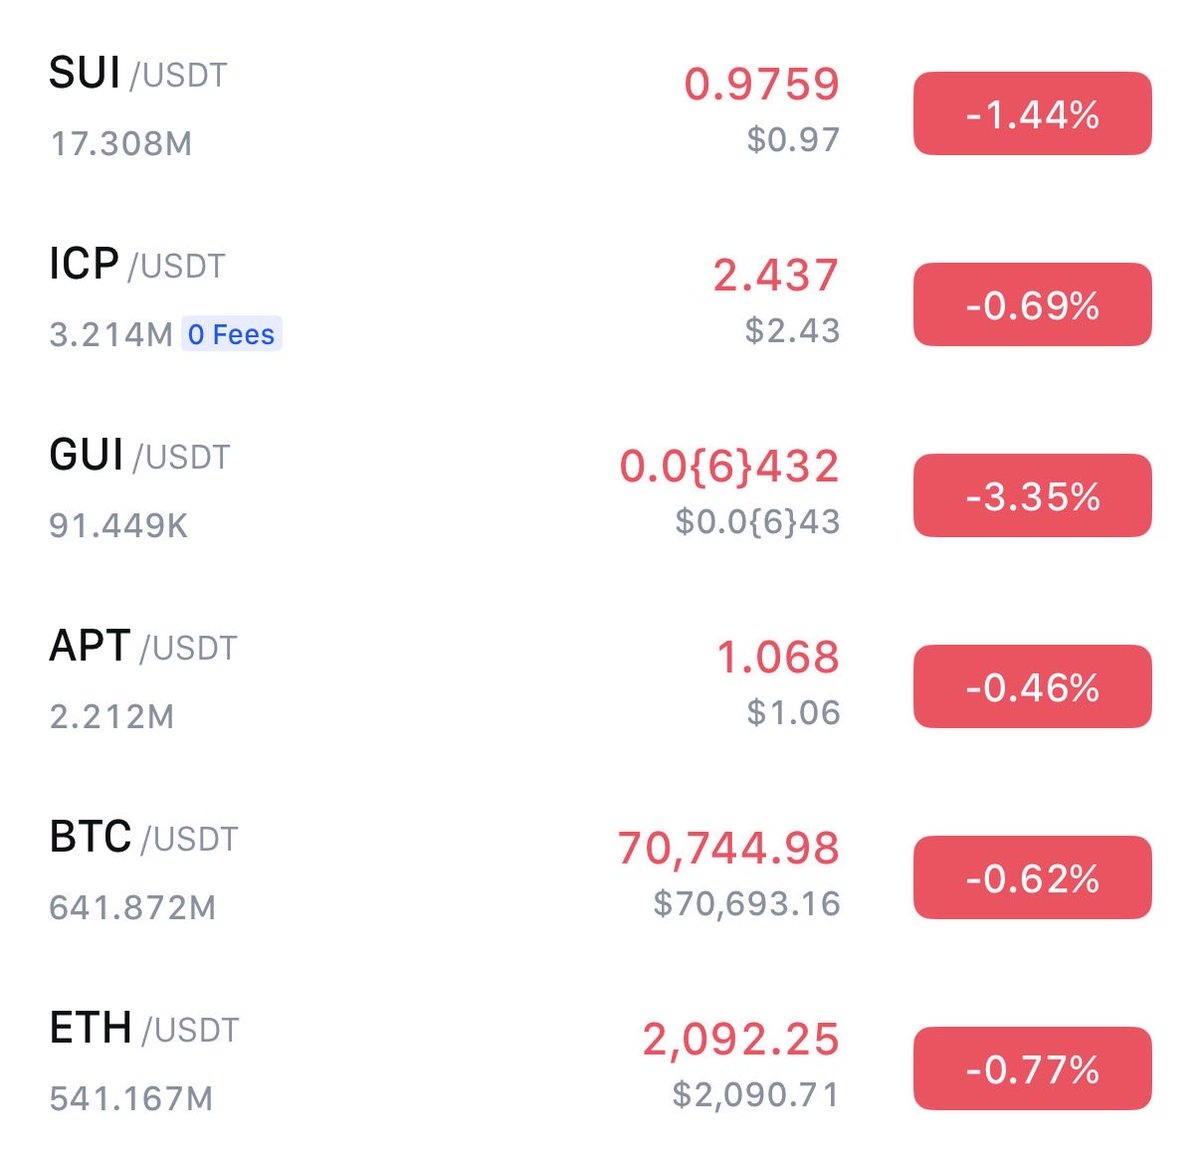
What will happen to APT , SUI and ICP when Bitcoin drops below $60K?
Anyone buying altcoins right now should prepare to lose at least 50% of their investment.
$SUI is heading to $0.10, $APT around $0.40
$ICP will drop the least. The best chain will handle the next Bitcoin dip the best.
English
@CryptoGFishere Don’t understand shitty Posts Like That
Blocked
English


That was such an obvious $BTC cycle top
CryptoBullet@CryptoBullet1
#Bitcoin 1M chart It’s so over for $BTC that I don’t even know what can save it 🤷♂️ This does look like a Cycle Top. Very similar to the 2021 one. - Bearish Divergence on RSI - Bearish Divergence on Stoch RSI - Similar Red monthly candle at the top - Same 35 Months from the cycle bottom to top ⚠️ Beware of the Bear
English

An open letter to the crypto community 💛
During periods of market volatility and pressure, the impact felt across the industry is naturally also felt by Binance.
As a global industry leader, we hold ourselves to elevated standards and continually improve based on feedback from our community and the wider public.
In 2025, Binance continued to invest in the long-term health of our industry through stronger risk controls, compliance, and ecosystem development.
Some key highlights:
👉 User Deposit Recovery: Assisted with 38,648 incorrect deposit cases totaling $48M in 2025, contributing to over $1.09B in total user deposits recovered to date.
👉 Risk Controls & User Protection: Helped 5.4M users through risk controls and protection measures, cumulatively preventing $6.69B in potential scam-related losses.
👉 Combating Illegal Activity: Collaborated with global law enforcement agencies to combat illegal activities leading to authorities confiscating $131 million in ill-gotten funds.
👉 Token Listing Distribution and Ecosystem Diversity: Spot listings covered 21 public blockchains, with ETH, BSC, and SOL leading (32, 18, and 9 projects respectively).
👉Asset Transparency and Reserves: Achieved Proof of Reserves (PoR) totaling $162.8B across 45 crypto assets.
We remain committed to sustainable, verifiable actions that protect users, advance the industry, and support long-term, responsible growth.
Today, we’re taking another step forward:
Binance will convert the SAFU fund’s ~$1B stablecoin reserves into BTC with the process completing within the next 30 days.
The SAFU fund will undergo regular rebalancing based on its market value. Should BTC price movements cause it to fall below $800M, Binance will replenish it to $1B.
We believe Bitcoin is the foundational asset of this ecosystem and the premier long-term store of value.
By making this move, we’re embracing market cycles and standing shoulder-to-shoulder with the industry, just as we always have.
This is part of our ongoing commitment to building crypto’s future. More updates soon.
Binance will keep responding with real steps, driving the industry forward through openness, transparency, and long-term commitment.
Thank you to our beloved community for standing with us, ALWAYS. 💛
Read the full letter 👉 binance.com/en/blog/commun…
English