Sabitlenmiş Tweet

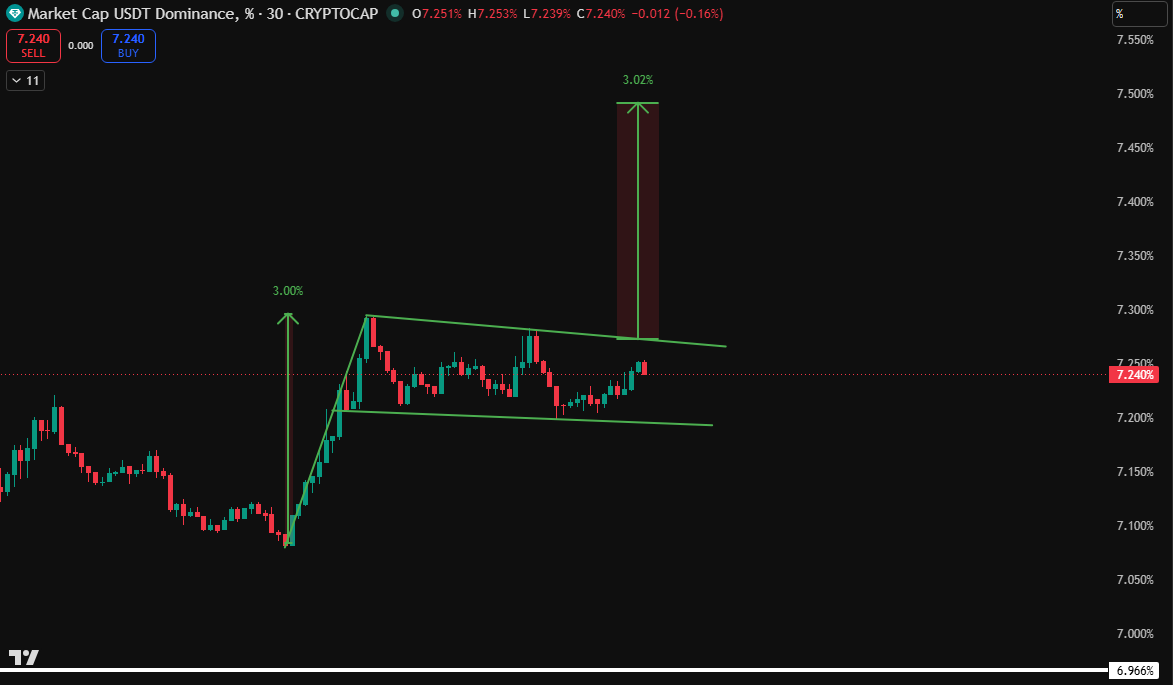
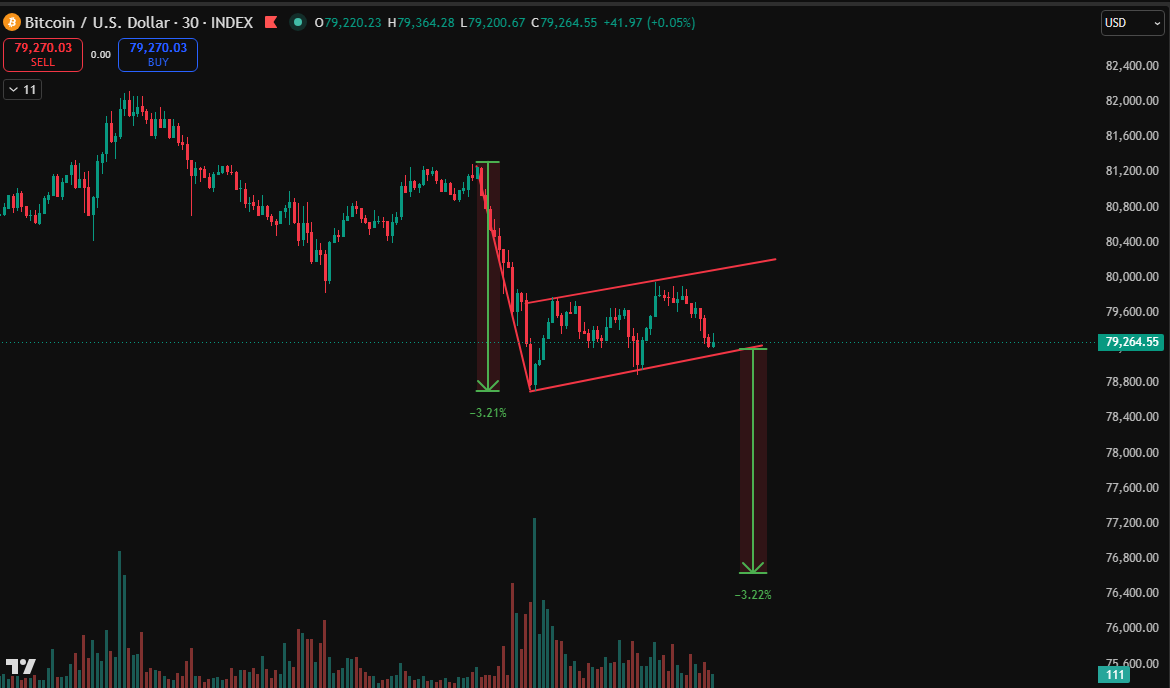
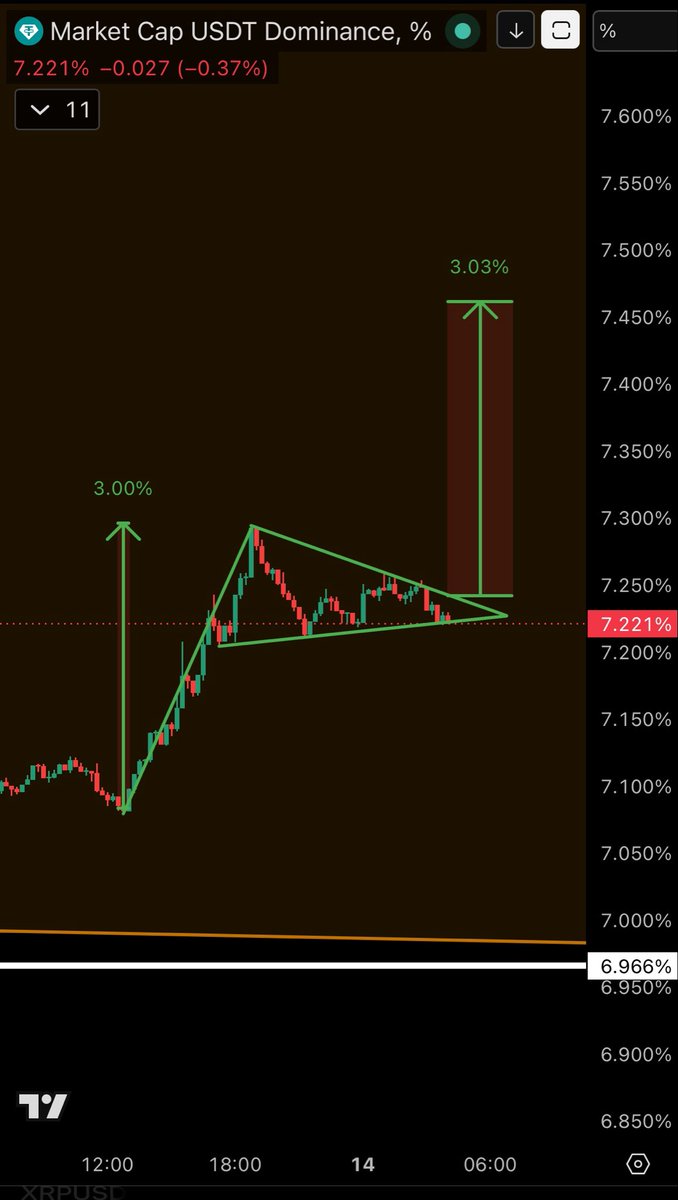
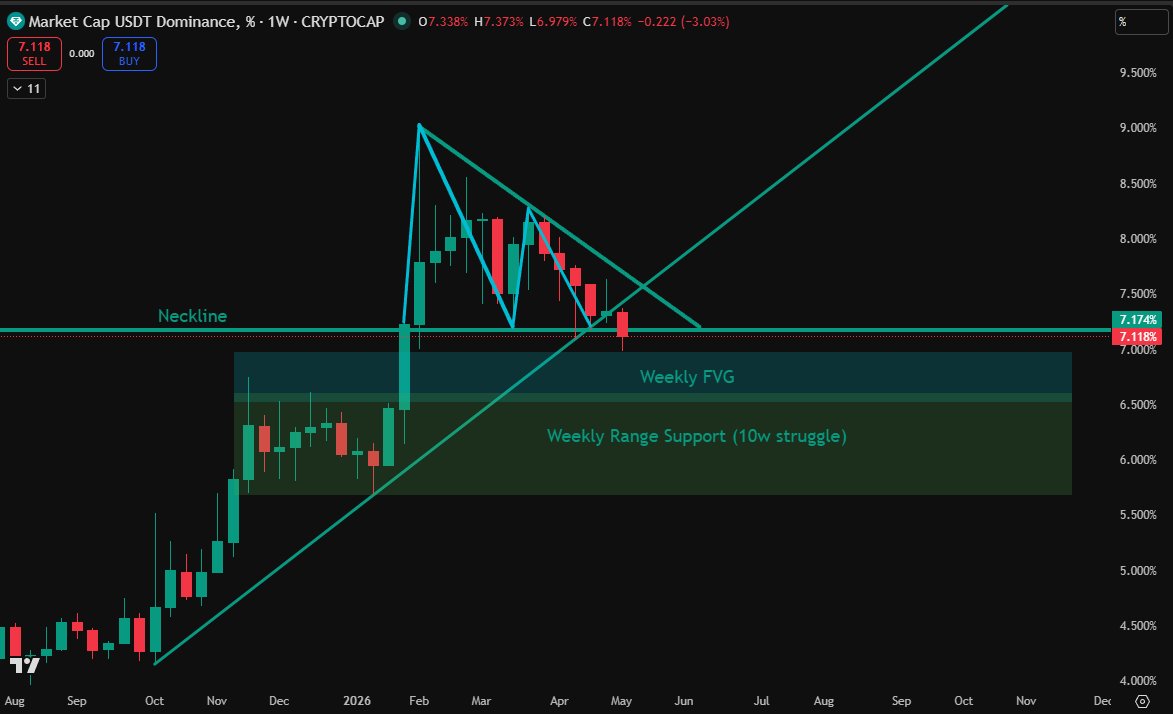
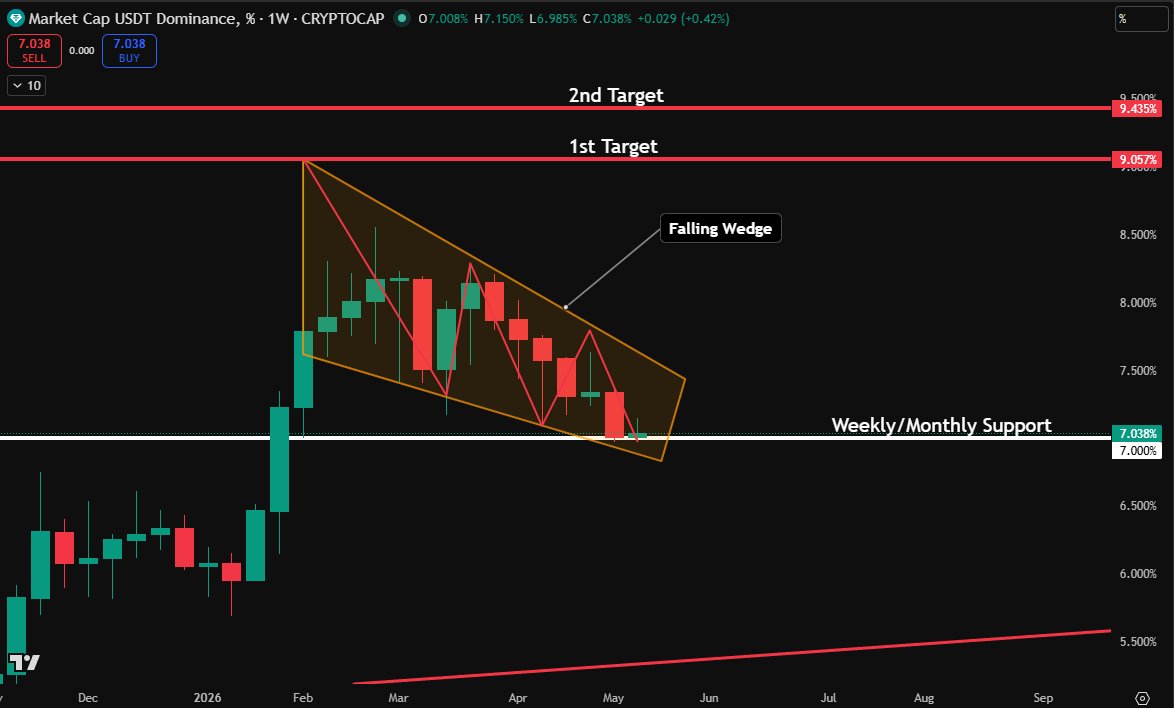
Imagine getting bullish on $BTC when you have this chart on $USDT.D ( USDT Dominance )
- The white support line is weekly so take weekly closure into consideration. Weekly closure under 6.9% invalidates the pattern
- Volume is rising which confirms the falling wedge pattern and also it means end of the pattern is nigh
- Look for a bullish daily candle to sell $BTC or $ALTS it will signal a big drop
English