Layer2Sandwich
582 posts

@Layer2Sandwich
A salary is the drug they give you to forget your dreams. Personal opinions here, no financial advice! https://t.co/rxYHVUZH5x


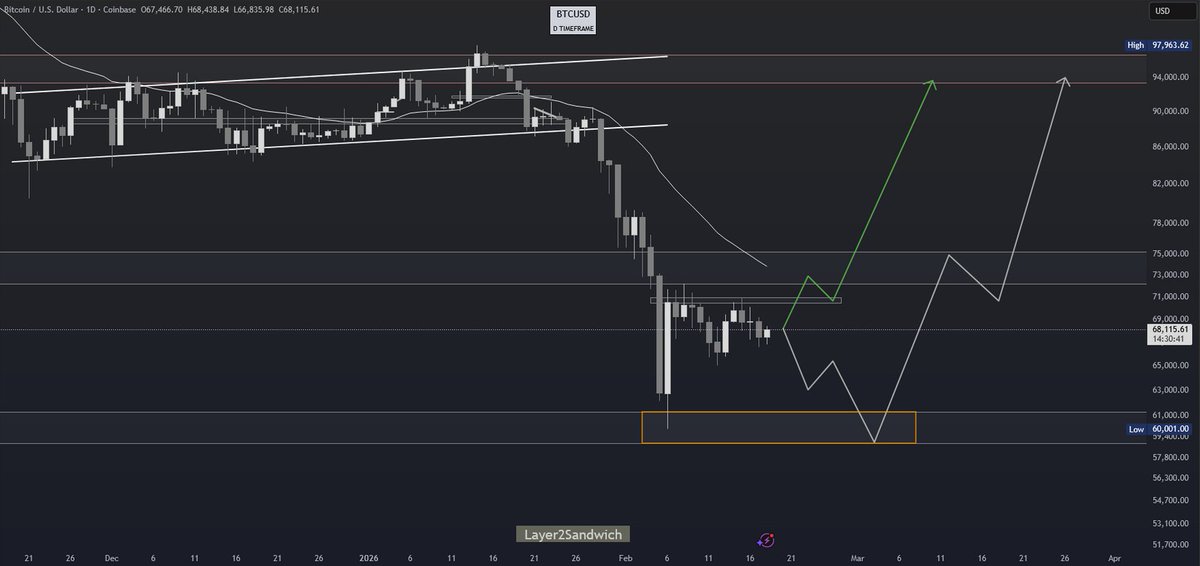
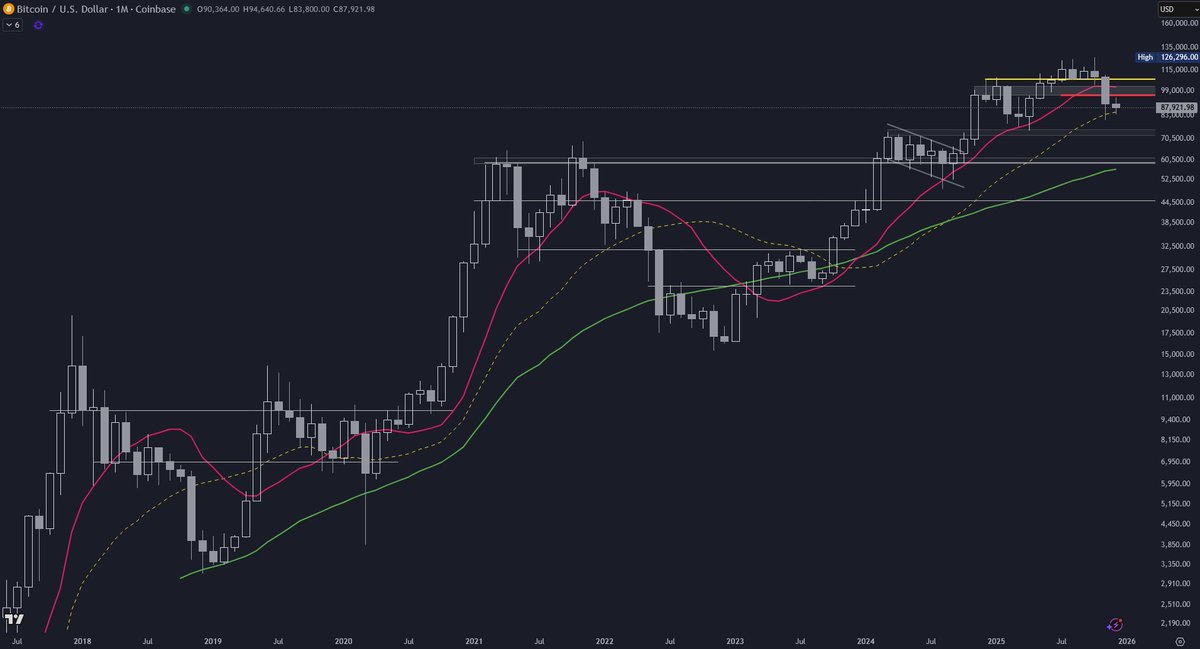
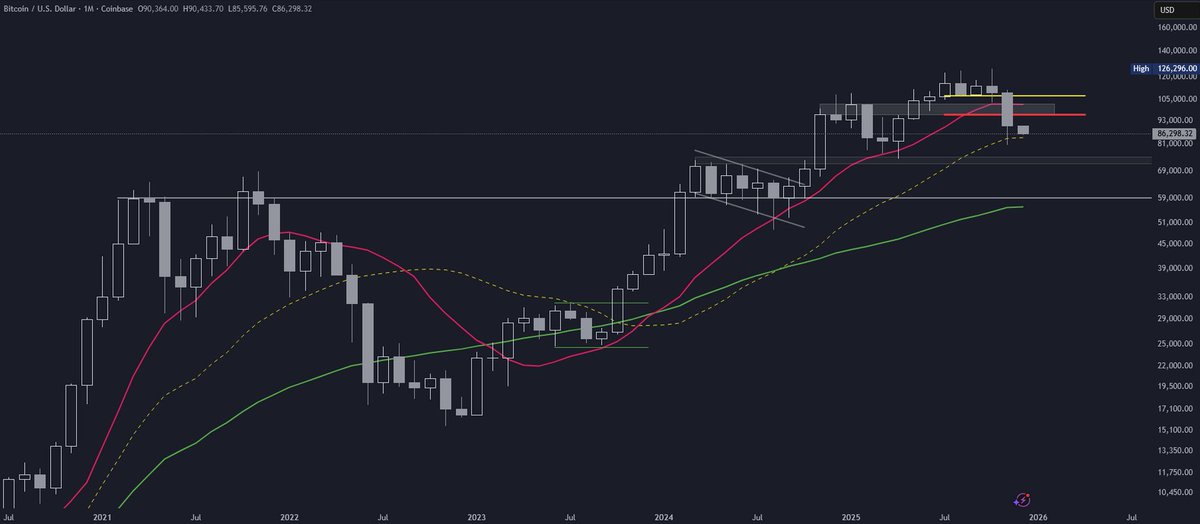
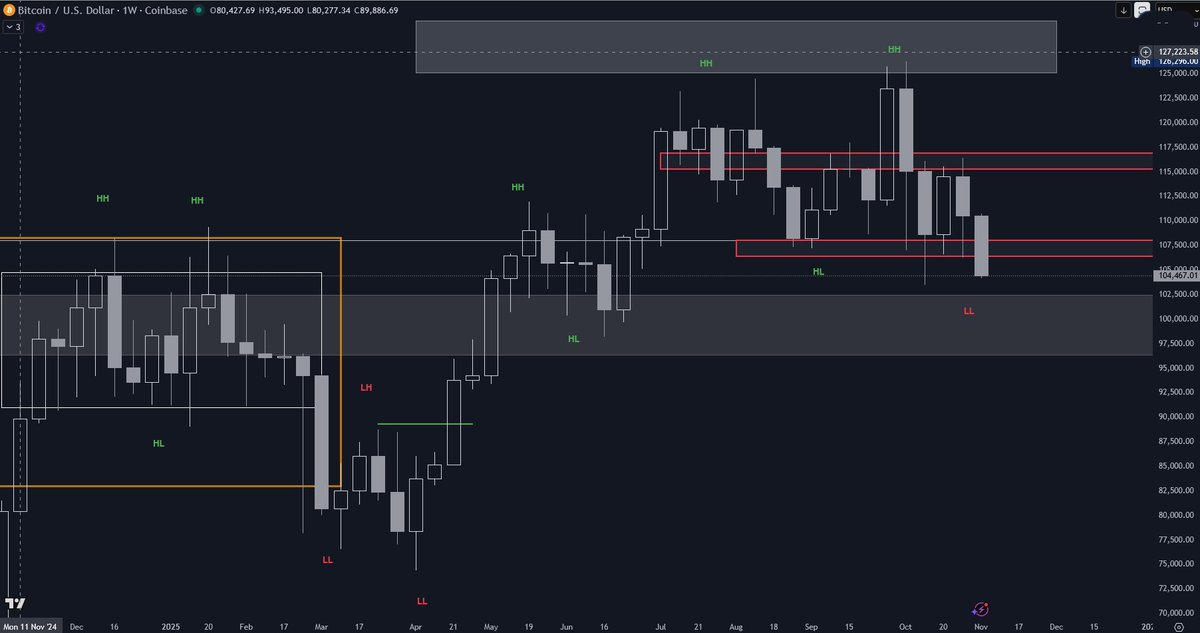
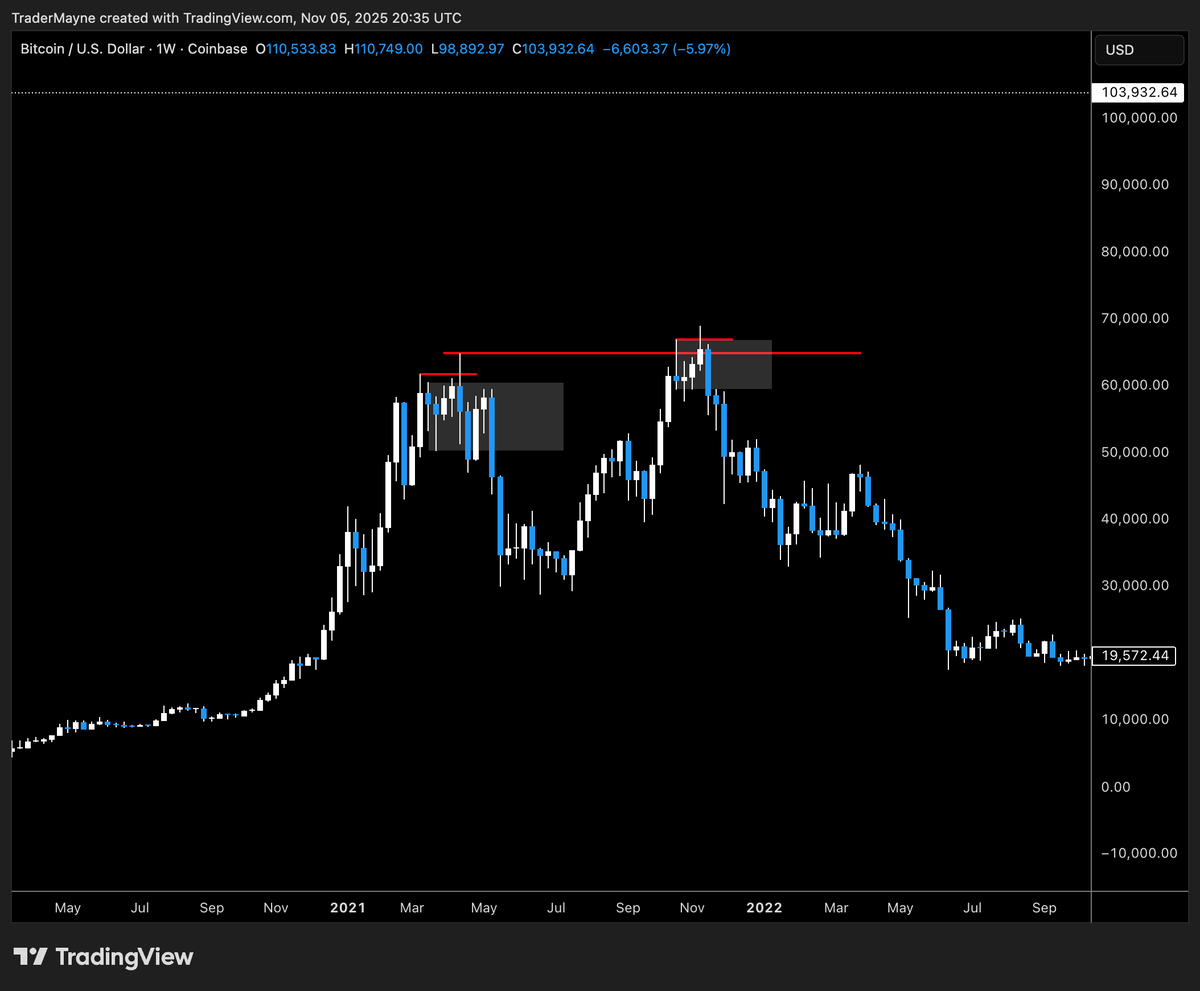
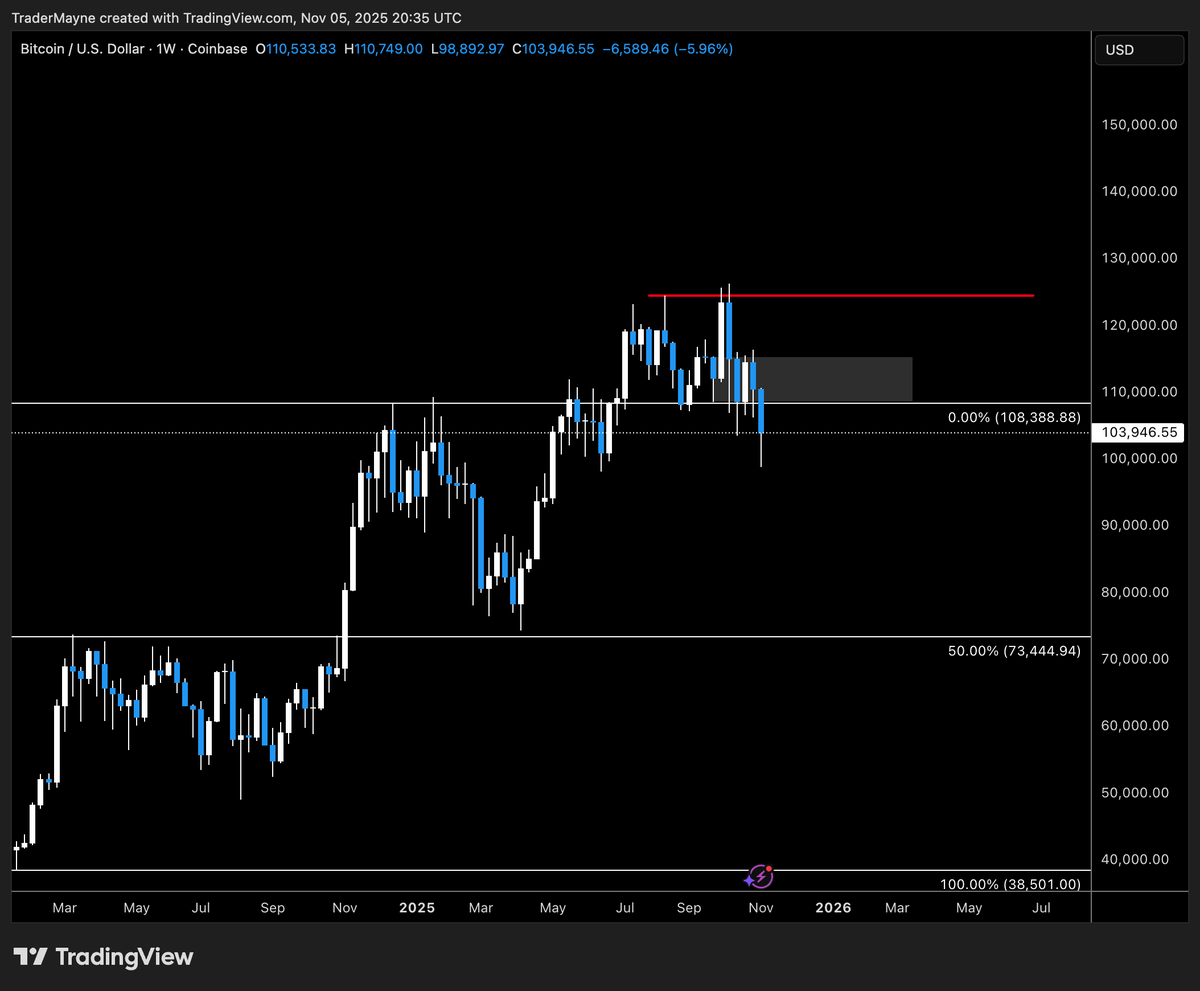
$Bitcoin Monthly Chart Perspective: After being quite vocal about a potential cycle top, or at least a distribution phase above $100k, the signals are starting to align. This smells like a cycle top to me. After such a strong sell-off, sharp relief rallies can occur at any support level. Still, I’d be cautious with too much short-term optimism. Historically, Bitcoin tends to form major bottoms around the 200 WMA. Despite the “this time is different” narrative, the higher-timeframe structure looks quite familiar. From that perspective, the ~$60k area stands out as a potential macro support zone. This scenario assumes the cycle top is already behind us, which remains my primary thesis. #Bitcoin #BTC #Crypto


To all the committed $Zcash holders who’ve been saying over the past weeks that it doesn’t matter whether you buy during the hype phase because “fundamentals will make Zcash go up anyway”. What’s your view on the monthly close? I see the fundamentals, but that’s only one part of an investment. The other, and often even more important aspect, is timing. With open eyes and without emotions, it was pretty clear that Zcash would come under pressure together with Bitcoin. But emotions made many overlook this obvious point. For everyone who bought near the end of the hype phase, I genuinely hope that zodling long-term will pay off, but personally I wouldn’t bet on it. The monthly close is one thing above all: ugly. We’ll see where Zcash finds its support alongside Bitcoin. That level will determine whether Zcash truly has a future, or at least a place in a positive future in crypto, or whether this was just another late-cycle pump like in previous bull markets. #Zcash


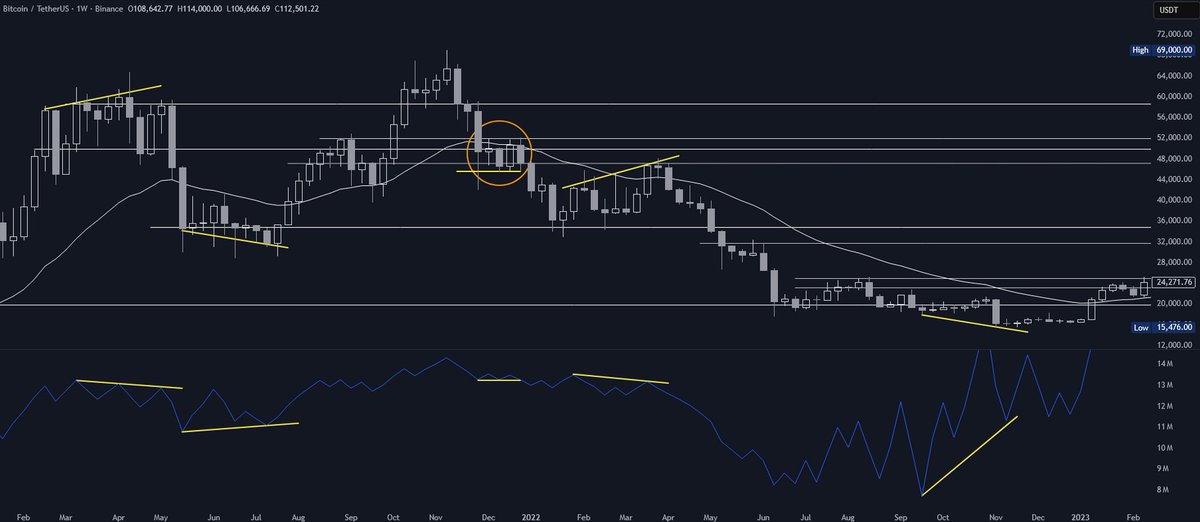
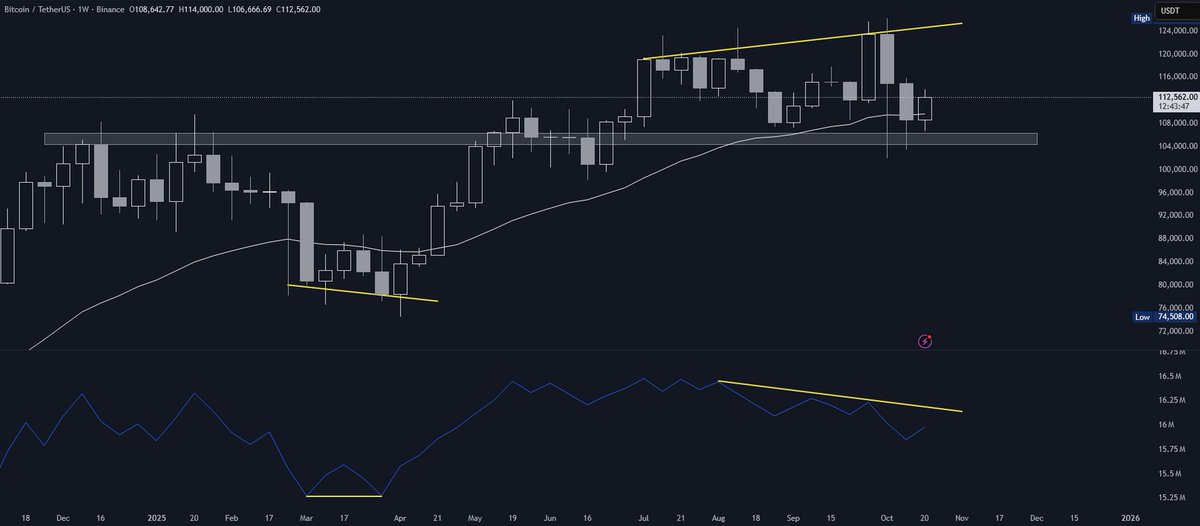
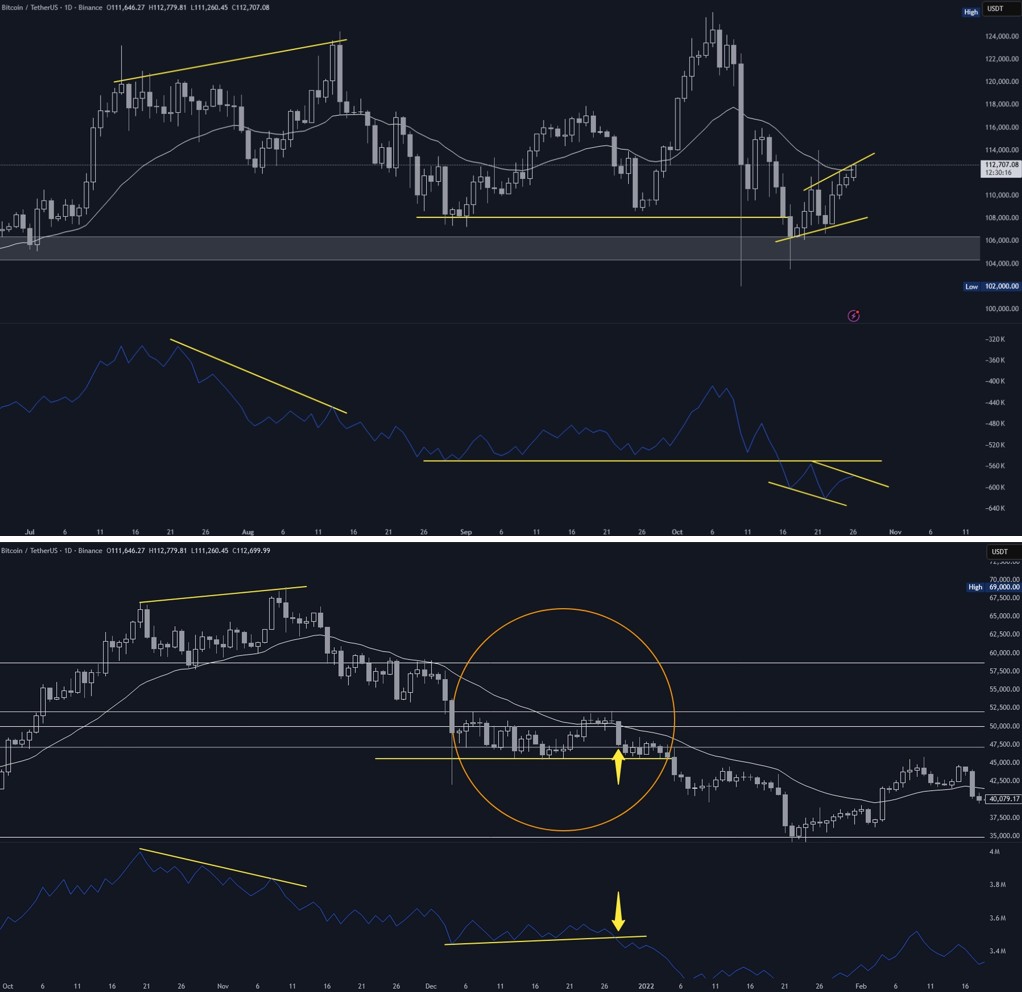
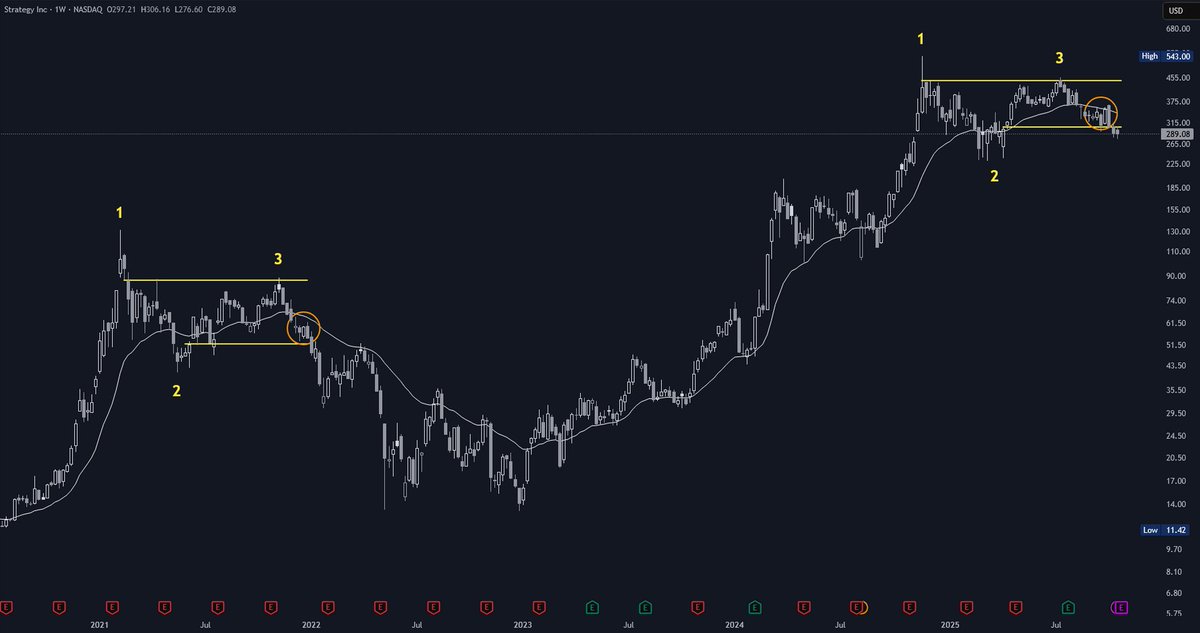
🧵 $Bitcoin – Signs of a Top Distribution? Volume drives markets. I believe it’s highly probable that the Bitcoin cycle top is either already in — or very close. Personally, I lean toward the first. But of course, nothing is ever certain in this market. My general approach in times like these: don’t be all in, don’t be all out. Stay partially allocated, hold cash, and wait for confirmation in one direction. Risk management becomes the key factor when market direction is uncertain. Now, let’s talk about price action and trading volume — and why I believe Bitcoin is currently in the distribution phase of this cycle. 📊 First Chart – OBV and Divergences The On-Balance Volume (OBV) indicator helps identify whether price action is truly supported by volume. It’s not always perfect, but when read correctly, its hit rate is impressive. In 2021, weekly OBV divergences revealed most false breakouts early — clear signs of unjustified price extensions. The same happened at the bottom in November 2023: strongly rising OBV while price was still dropping → confirmed the bottom. Notice the orange circle: After the second top in late 2021, we saw a strong sell-off, then a short consolidation between the 25 EMA and key support around $45,000, before the next leg down. 📈 Second Chart – Today’s Price Action In the current weekly chart, we see higher prices in October compared to August — but lower trading volume. That’s not a healthy sign. Now: OBV already broke down while price still holds up — and historically, OBV often leads price moves. Looking at the daily Bitcoin chart, the same pattern emerges. Right now, Bitcoin is rallying on declining relative volume Not ideal for sustainable trends. OBV already broke down. In 2021, OBV broke down before price confirmed the move — a clear early warning (see orange circle). Now let’s also take a look at the Strategy (MSTR) weekly chart: MSTR Weekly (MicroStrategy) MSTR’s weekly chart shows signs of exhaustion. When leading proxies like MSTR start showing weakness while Bitcoin still holds up, that’s another red flag for me. Also, look at the similar chart patterns at the last top and now. 🚨 So, what now? This isn’t about calling exact tops — it’s about reading the signs and managing risk. No one has a crystal ball, but there are indications that consistently offer valuable insights. Right now, most of those signals suggest caution to me. Even if the rally continues, the question is: How are you positioned if the trend fails? Increased uncertainty = increased need for discipline. Thanks for reading. Stay alert, stay rational, and manage your risk. #Bitcoin #BTC #Crypto #Trading #PriceAction #VolumeAnalysis

To all the committed $Zcash holders who’ve been saying over the past weeks that it doesn’t matter whether you buy during the hype phase because “fundamentals will make Zcash go up anyway”. What’s your view on the monthly close? I see the fundamentals, but that’s only one part of an investment. The other, and often even more important aspect, is timing. With open eyes and without emotions, it was pretty clear that Zcash would come under pressure together with Bitcoin. But emotions made many overlook this obvious point. For everyone who bought near the end of the hype phase, I genuinely hope that zodling long-term will pay off, but personally I wouldn’t bet on it. The monthly close is one thing above all: ugly. We’ll see where Zcash finds its support alongside Bitcoin. That level will determine whether Zcash truly has a future, or at least a place in a positive future in crypto, or whether this was just another late-cycle pump like in previous bull markets. #Zcash


🧵 $Bitcoin – Signs of a Top Distribution? Volume drives markets. I believe it’s highly probable that the Bitcoin cycle top is either already in — or very close. Personally, I lean toward the first. But of course, nothing is ever certain in this market. My general approach in times like these: don’t be all in, don’t be all out. Stay partially allocated, hold cash, and wait for confirmation in one direction. Risk management becomes the key factor when market direction is uncertain. Now, let’s talk about price action and trading volume — and why I believe Bitcoin is currently in the distribution phase of this cycle. 📊 First Chart – OBV and Divergences The On-Balance Volume (OBV) indicator helps identify whether price action is truly supported by volume. It’s not always perfect, but when read correctly, its hit rate is impressive. In 2021, weekly OBV divergences revealed most false breakouts early — clear signs of unjustified price extensions. The same happened at the bottom in November 2023: strongly rising OBV while price was still dropping → confirmed the bottom. Notice the orange circle: After the second top in late 2021, we saw a strong sell-off, then a short consolidation between the 25 EMA and key support around $45,000, before the next leg down. 📈 Second Chart – Today’s Price Action In the current weekly chart, we see higher prices in October compared to August — but lower trading volume. That’s not a healthy sign. Now: OBV already broke down while price still holds up — and historically, OBV often leads price moves. Looking at the daily Bitcoin chart, the same pattern emerges. Right now, Bitcoin is rallying on declining relative volume Not ideal for sustainable trends. OBV already broke down. In 2021, OBV broke down before price confirmed the move — a clear early warning (see orange circle). Now let’s also take a look at the Strategy (MSTR) weekly chart: MSTR Weekly (MicroStrategy) MSTR’s weekly chart shows signs of exhaustion. When leading proxies like MSTR start showing weakness while Bitcoin still holds up, that’s another red flag for me. Also, look at the similar chart patterns at the last top and now. 🚨 So, what now? This isn’t about calling exact tops — it’s about reading the signs and managing risk. No one has a crystal ball, but there are indications that consistently offer valuable insights. Right now, most of those signals suggest caution to me. Even if the rally continues, the question is: How are you positioned if the trend fails? Increased uncertainty = increased need for discipline. Thanks for reading. Stay alert, stay rational, and manage your risk. #Bitcoin #BTC #Crypto #Trading #PriceAction #VolumeAnalysis


🧵 $Bitcoin – Signs of a Top Distribution? Volume drives markets. I believe it’s highly probable that the Bitcoin cycle top is either already in — or very close. Personally, I lean toward the first. But of course, nothing is ever certain in this market. My general approach in times like these: don’t be all in, don’t be all out. Stay partially allocated, hold cash, and wait for confirmation in one direction. Risk management becomes the key factor when market direction is uncertain. Now, let’s talk about price action and trading volume — and why I believe Bitcoin is currently in the distribution phase of this cycle. 📊 First Chart – OBV and Divergences The On-Balance Volume (OBV) indicator helps identify whether price action is truly supported by volume. It’s not always perfect, but when read correctly, its hit rate is impressive. In 2021, weekly OBV divergences revealed most false breakouts early — clear signs of unjustified price extensions. The same happened at the bottom in November 2023: strongly rising OBV while price was still dropping → confirmed the bottom. Notice the orange circle: After the second top in late 2021, we saw a strong sell-off, then a short consolidation between the 25 EMA and key support around $45,000, before the next leg down. 📈 Second Chart – Today’s Price Action In the current weekly chart, we see higher prices in October compared to August — but lower trading volume. That’s not a healthy sign. Now: OBV already broke down while price still holds up — and historically, OBV often leads price moves. Looking at the daily Bitcoin chart, the same pattern emerges. Right now, Bitcoin is rallying on declining relative volume Not ideal for sustainable trends. OBV already broke down. In 2021, OBV broke down before price confirmed the move — a clear early warning (see orange circle). Now let’s also take a look at the Strategy (MSTR) weekly chart: MSTR Weekly (MicroStrategy) MSTR’s weekly chart shows signs of exhaustion. When leading proxies like MSTR start showing weakness while Bitcoin still holds up, that’s another red flag for me. Also, look at the similar chart patterns at the last top and now. 🚨 So, what now? This isn’t about calling exact tops — it’s about reading the signs and managing risk. No one has a crystal ball, but there are indications that consistently offer valuable insights. Right now, most of those signals suggest caution to me. Even if the rally continues, the question is: How are you positioned if the trend fails? Increased uncertainty = increased need for discipline. Thanks for reading. Stay alert, stay rational, and manage your risk. #Bitcoin #BTC #Crypto #Trading #PriceAction #VolumeAnalysis


🧵 $Bitcoin – Signs of a Top Distribution? Volume drives markets. I believe it’s highly probable that the Bitcoin cycle top is either already in — or very close. Personally, I lean toward the first. But of course, nothing is ever certain in this market. My general approach in times like these: don’t be all in, don’t be all out. Stay partially allocated, hold cash, and wait for confirmation in one direction. Risk management becomes the key factor when market direction is uncertain. Now, let’s talk about price action and trading volume — and why I believe Bitcoin is currently in the distribution phase of this cycle. 📊 First Chart – OBV and Divergences The On-Balance Volume (OBV) indicator helps identify whether price action is truly supported by volume. It’s not always perfect, but when read correctly, its hit rate is impressive. In 2021, weekly OBV divergences revealed most false breakouts early — clear signs of unjustified price extensions. The same happened at the bottom in November 2023: strongly rising OBV while price was still dropping → confirmed the bottom. Notice the orange circle: After the second top in late 2021, we saw a strong sell-off, then a short consolidation between the 25 EMA and key support around $45,000, before the next leg down. 📈 Second Chart – Today’s Price Action In the current weekly chart, we see higher prices in October compared to August — but lower trading volume. That’s not a healthy sign. Now: OBV already broke down while price still holds up — and historically, OBV often leads price moves. Looking at the daily Bitcoin chart, the same pattern emerges. Right now, Bitcoin is rallying on declining relative volume Not ideal for sustainable trends. OBV already broke down. In 2021, OBV broke down before price confirmed the move — a clear early warning (see orange circle). Now let’s also take a look at the Strategy (MSTR) weekly chart: MSTR Weekly (MicroStrategy) MSTR’s weekly chart shows signs of exhaustion. When leading proxies like MSTR start showing weakness while Bitcoin still holds up, that’s another red flag for me. Also, look at the similar chart patterns at the last top and now. 🚨 So, what now? This isn’t about calling exact tops — it’s about reading the signs and managing risk. No one has a crystal ball, but there are indications that consistently offer valuable insights. Right now, most of those signals suggest caution to me. Even if the rally continues, the question is: How are you positioned if the trend fails? Increased uncertainty = increased need for discipline. Thanks for reading. Stay alert, stay rational, and manage your risk. #Bitcoin #BTC #Crypto #Trading #PriceAction #VolumeAnalysis


🚨 Bitcoin is showing clear signs of distribution - and most people are still ignoring it. Many of those big accounts stayed overly bullish, refusing to respect the signals. That’s dangerous. In markets like this, hope and greed are the reasons you give back all your profits. People keep saying “everyone is bearish” - but that’s simply not true. At the top, everyone was euphoric. After the drop, it was “leverage flushed, time to go up again.” Then came the “everyone’s bearish = bullish” narrative. Truth is: the majority remains bullish, still hoping for higher prices. I’m not saying that’s impossible - but you should be aware that proper risk management is absolutely crucial here. I even had Grok analyze Crypto Twitter two weeks ago to see if I was right with most accounts still being bullish. Result: 80–85% of accounts overly bullish. That’s not capitulation. That’s classic top behavior - delusional bulls refusing to see the signs. And when the downtrend becomes “obvious”, they’ll accelerate it. In speculative markets, reaction time is everything - especially for Altcoins. No matter what big accounts preach, I currently see zero bullish signals. Of course, that can change quickly, but until then the current downtrend remains in play. Hopium will always exist, but it doesn’t belong in a serious strategy. 👉 Manage your risk accordingly. And if you haven’t yet, read my last thread about why I believe we’re in a Bitcoin distribution phase - and how to act accordingly. #Bitcoin #BTC #Crypto