💎 Simple Trader 💎

1.6K posts

💎 Simple Trader 💎 banner
💎 Simple Trader 💎

💎 Simple Trader 💎

@Learner434

CA • Swing Trader • Only Price & Volume • Slow is smooth, smooth is fast

Gurugram, Haryana Katılım Nisan 2022
330 Takip Edilen62 Takipçiler
💎 Simple Trader 💎 retweetledi
Davinder Khurana
Davinder Khurana@iDavinderK·
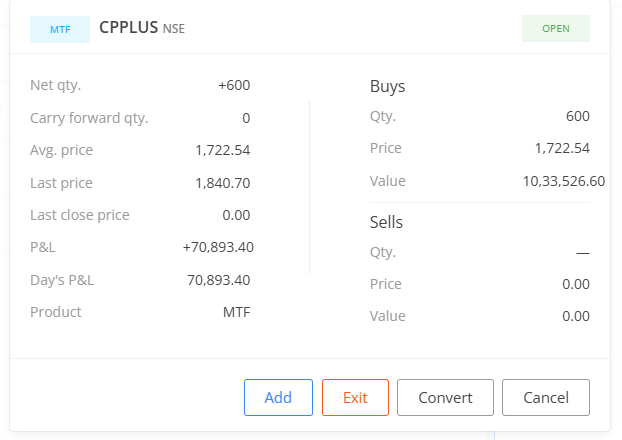
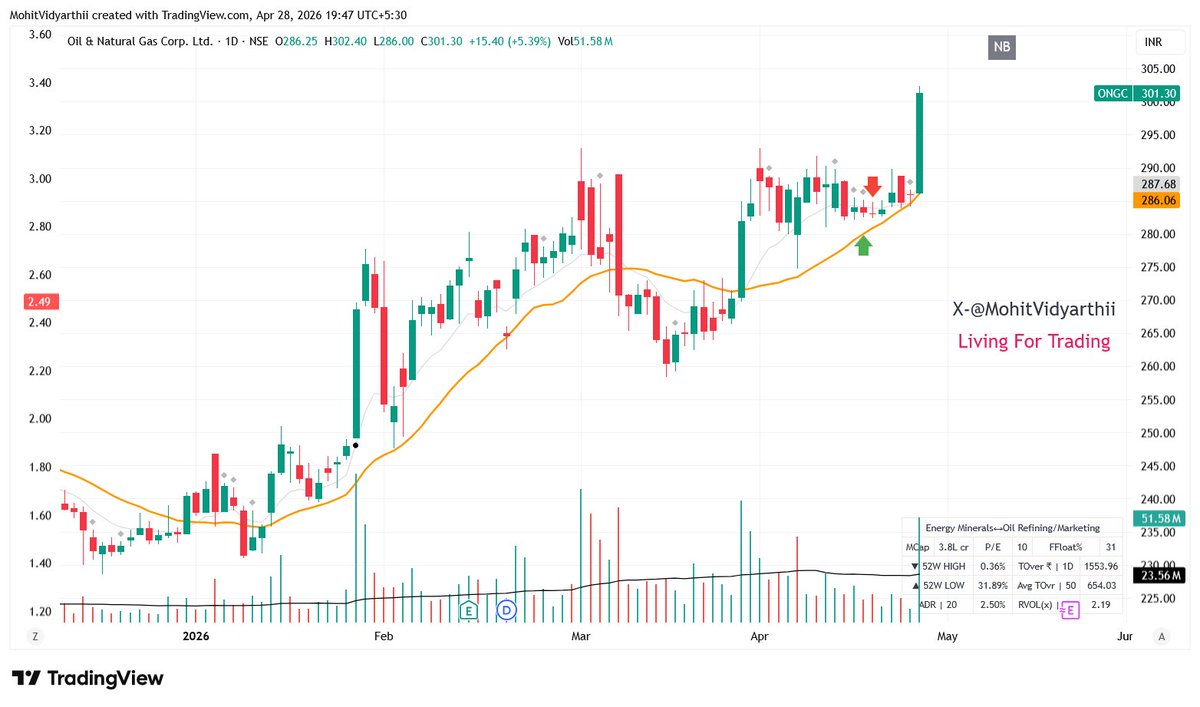
How to grow your account fast - The rule of the game is simple. Keep leaders in watchlist, trade. Whatever gets exited, exit whatever remains double down on it. #BroTip
English
7
8
155
25.3K
Disciplined N Consistent
@DietDrsayajirao Sir With all Happiness I want to share with You How My Discipline & Consistency helped me! Last 3 days I went to a Family Function & I Didn't Intake any Junk, Sweets, Cold drinks or Oily Food! I was able to Do what I was doing since 190 days ✅️🙏💯 x.com/i/status/20508…
Disciplined N Consistent@AnnuInfo

Family Function Lunch ❤️ Skipped ❌️ *Sweets & Icecream *Naan & Puri *Oily Sabjis *Coldrinks & Drinks 🍸 *Junk Starters

English
1
0
3
1.4K
Dr.Sayajirao Gaikwad
Dr.Sayajirao Gaikwad@DietDrsayajirao·
Why do weight loss drugs work so well? Because they control your hunger hormones. Here’s how your food can activate the same system naturally 👇 1) Protein → Incretin & Satiety Signaling
Dr.Sayajirao Gaikwad tweet media
English
3
11
167
20.2K
💎 Simple Trader 💎 retweetledi
Sumit Behal
Sumit Behal@sumitkbehal·
The growth of Kristjan Qullamaggie from $5,000 to $100 million as a retail trader is an unbelievable story I just finished the first chapter of new Market Wizards book and am breaking down this journey in the following tweets
Sumit Behal tweet media
English
24
104
1.1K
108.1K
ChartsMaze
ChartsMaze@Charts_Maze·
Many of you have asked for a way to view Daily and Weekly charts side by side(D/W) Now you can✅ Just enable 'Dual Charts Mode' and get both timeframes📊
ChartsMaze tweet mediaChartsMaze tweet media
English
12
9
127
6.8K
ChartsMaze
ChartsMaze@Charts_Maze·
New Chart indicators announcement🚨 RSI indicator, and Simple Turnover indicator by @finallynitin are now available on ChartsMaze🎊 Enable from Display Settings!
ChartsMaze tweet mediaChartsMaze tweet mediaChartsMaze tweet media
English
8
9
82
8.6K
💎 Simple Trader 💎 retweetledi
Dr.Sayajirao Gaikwad
Dr.Sayajirao Gaikwad@DietDrsayajirao·
90% of Your Health Problems will vanish with this routine - Strength training 3–4×/week - 10k steps or brisk walking daily - Nutrient-dense whole foods - Sleep & wake at the same time - Morning sunlight exposure - 2–3 L hydration - Mobility & stretching (5–10 mins) - Digital detox 1 hour before bed - 12–14 hour fasting window - Limit ultra-processed foods - Meditation & breath work
English
15
135
753
27.2K
💎 Simple Trader 💎 retweetledi
Dr.Sayajirao Gaikwad
Dr.Sayajirao Gaikwad@DietDrsayajirao·
After 50: Calcium won’t fix weak bones or stubborn belly fat. These 9 habits will fix both👇 1) Increase protein intake
English
11
130
875
158K
💎 Simple Trader 💎 retweetledi
Chhirag Kedia
Chhirag Kedia@swing_ka_sultan·
AN OPEN LETTER TO TRADINGVIEW FROM AN ADMIRER I’ve always been a big admirer of the team at @tradingview for what they’ve built and how they’ve transformed the charting experience for traders. I’ve also been quite vocal about the importance of investing in essential tools rather than hesitating over such costs. However, the recently introduced symbol limits per watchlist, even on paid plans, feel like a step backward. I understand the intent to increase ARPU and push upgrades, but reducing the Premium plan limit from 1000 to 500 symbols is quite restrictive, especially considering it’s already at the upper end of what retail traders in India can afford. This change feels unjustified and, ideally, the earlier limits should be restored. If that’s not feasible, then at least increasing the caps would be a fair middle ground, bringing Premium back to 1000 symbols, and raising Essential and Plus tiers to 250 and 500 respectively. Now, one might argue why anyone would need such a large number of symbols in a watchlist and how it actually helps. What most traders, and even the team at TradingView, may not fully understand about India is the concept of circuit filters enforced by our regulators. This is quite unique to Indian markets. Since international platforms don’t provide a way to exclude stocks based on these filters directly in scanners, we are forced to first eliminate such stocks using local tools. To avoid illiquid names, especially those stuck in 2% or 5% circuit filters, we have to create a refined “Total Universe” watchlist first. Only then can we effectively run scans on TradingView. If we skip this step and rely purely on inbuilt scanners, results often get cluttered with circuit-bound stocks, which are practically untradeable and hard to filter out afterward. Currently, National Stock Exchange of India has around 2300 listed stocks. Even after filtering out illiquid names and those under strict circuit limits, we are still left with roughly 900 to 1100 stocks depending on market conditions. This already exceeds even the earlier limits. I had earlier requested increasing these limits, but the recent change has gone in the opposite direction, making it almost impractical to use TradingView’s watchlist-based scanning effectively in Indian markets. I’ve used multiple platforms over the years, free and paid, desktop and web, and haven’t encountered such restrictive limitations elsewhere. This kind of constraint could actually give competing platforms an opportunity to challenge TradingView, at least in the Indian market. On behalf of retail traders and the fintwit community, I would strongly request the TradingView team to restore the earlier limits. If changes are unavoidable, then at least consider increasing the limits as suggested earlier. I’d also urge the fintwit community to support and amplify this, so the importance of this issue is clearly communicated.
Chhirag Kedia tweet mediaChhirag Kedia tweet media
English
31
205
362
42.6K
The_Chartist 📈
The_Chartist 📈@thechartist26·
After the mark of 50%, "Is it ethanol blending or petrol blending?'
English
25
4
234
14.8K
@Unknown_Trader_9
@Unknown_Trader_9@Opportunist_999·
@mukeshchauhan @Charts_Maze Its right time , chart maze should get the live data and streamm live charts It will remove the Monopoly of trading view in india . I would be the first person to buy their product @Charts_Maze
English
1
0
2
210
Mukesh Chauhan
Mukesh Chauhan@mukeshchauhan·
TradingView just capped Essential plan watchlists to 100 symbols, making life harder for many traders. I reached out to @Charts_Maze, and they implemented a "Copy in Batches of 100" feature in literally 10 minutes. This level of responsiveness is exactly why it is 1st choice.
Mukesh Chauhan tweet media
English
8
2
47
5.6K
💎 Simple Trader 💎 retweetledi
Nitin R
Nitin R@finallynitin·
🚨Presenting the "Persistency with moving averages" indicator for TradingView I've been using this indicator since 2024. Decided to make it free for everyone! Purpose: Stock selection (by acting as a proxy for the nature/character of the stock) Level: Intermediate (beginner traders can skip this indicator) Basic concepts This indicator is inspired by the concept of Persistency introduced by @PradeepBonde. Bonde emphasizes that it's not just about knowing a trend's direction, but also about understanding how resilient that trend is over time. Stocks that consistently move in the direction of the trend have better odds of continuing that trend. By identifying such stocks, traders can improve their chances of catching both more and bigger winners. Watch Stockbee's video for the original concept: youtu.be/mWE9J2Nta6g Bonde's original concept can be refined further by tracking how long a price has stayed in a certain trend direction relative to a key moving average. Instead of solely counting the instances where the close is higher than the previous close, this script tracks how many bars (periods) the price has stayed above or below certain moving averages. Moving averages act as dynamic support and resistance levels, providing a more nuanced view of price behavior. Key Features ⦿ The heart of the indicator is the persistency count, which tracks for how many consecutive candles the price has stayed above or below a moving average. By using the counts to find stocks that have consistently moved in one direction, we can use this indicator for identifying Persistent trends. ⦿ Max Persistency is the historical metric that records the longest consecutive streak the price has spent on one side of an MA within a specific lookback period. This tells us the past nature/character of the stock i.e. whether the stock has respected a particular moving average in the past or not. ⦿ Decisive Exit: When enabled, the indicator starts a pending exit if the price closes below a moving average. A decisive exit occurs if the price breaches the low of the pending exit day. Use Cases ⦿ Identifying stocks in persistent trends ⦿ Timing entries/exits via price/MA crossovers ⦿ Assessing momentum across multiple timeframes using MAs of different lengths
YouTube video
YouTube
Nitin R tweet media
English
71
160
1K
89.9K
💎 Simple Trader 💎 retweetledi
Mayank Vora
Mayank Vora@aiwithmayank·
If you died tomorrow, nobody could access your: - Bank accounts - Crypto wallets - Cloud storage - Password manager Your digital life dies with you. Here's the 30-minute setup that prevents this ↓
English
112
1.4K
7.5K
1.7M