
MF trades
118 posts


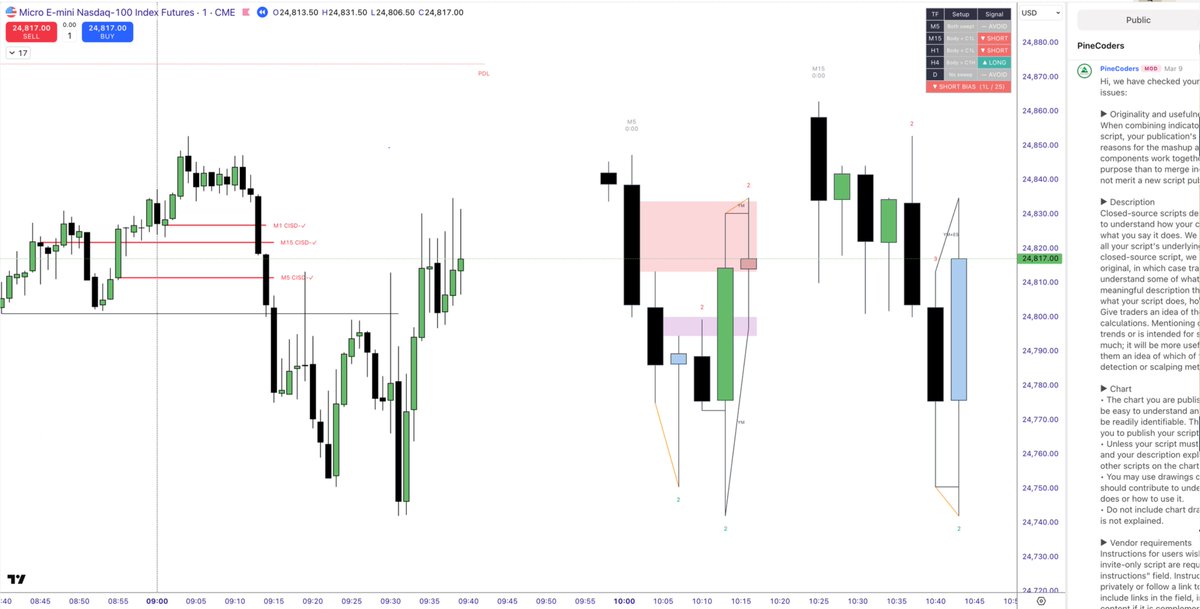
Added SMT and PSP logic to my #indicator. Looking for beta testers, join the community and send me your #Tradingview username for access and submit your feedback. Link in bio

English


@MRMF87 @tradingview Glad you like it. And thats not all buddy - once I open source it - it will become even better!
English
MF trades retweetledi
🚨 IT’S LIVE 🚨
After weeks of building, testing, and working directly with @TradingView moderators…
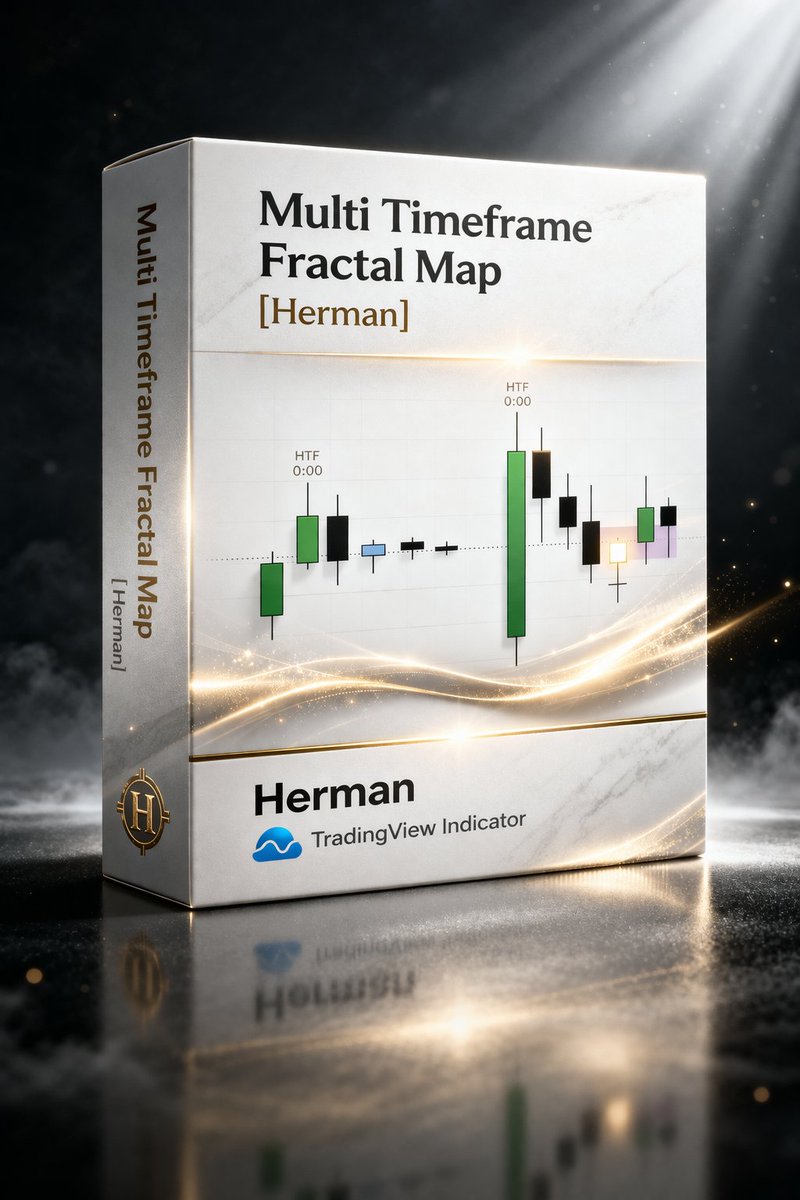
Multi Timeframe Fractal Map [Herman] is officially RELEASED FREE. 🎉
🔥 BONUS:
If this post hits 50 retweets I’ll release the FULL script as OPEN SOURCE
This is the tool traders have been asking me about.
And now you have it.
What it gives you:
• higher timeframe context (5m → Daily)
• real-time liquidity sweeps
• SMT across correlated markets
• execution structure on lower timeframes
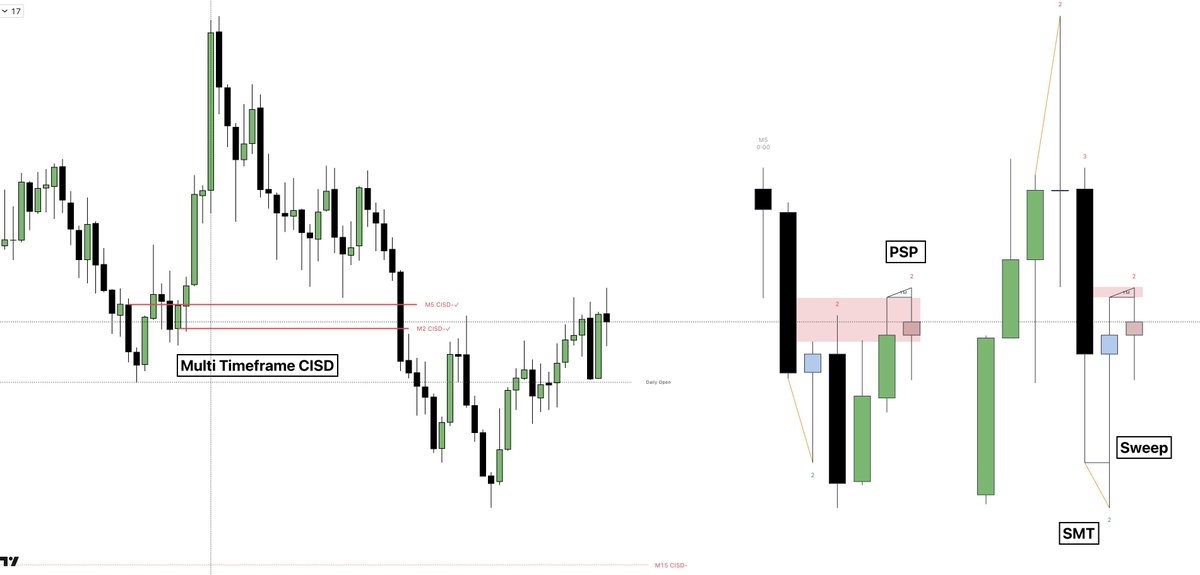
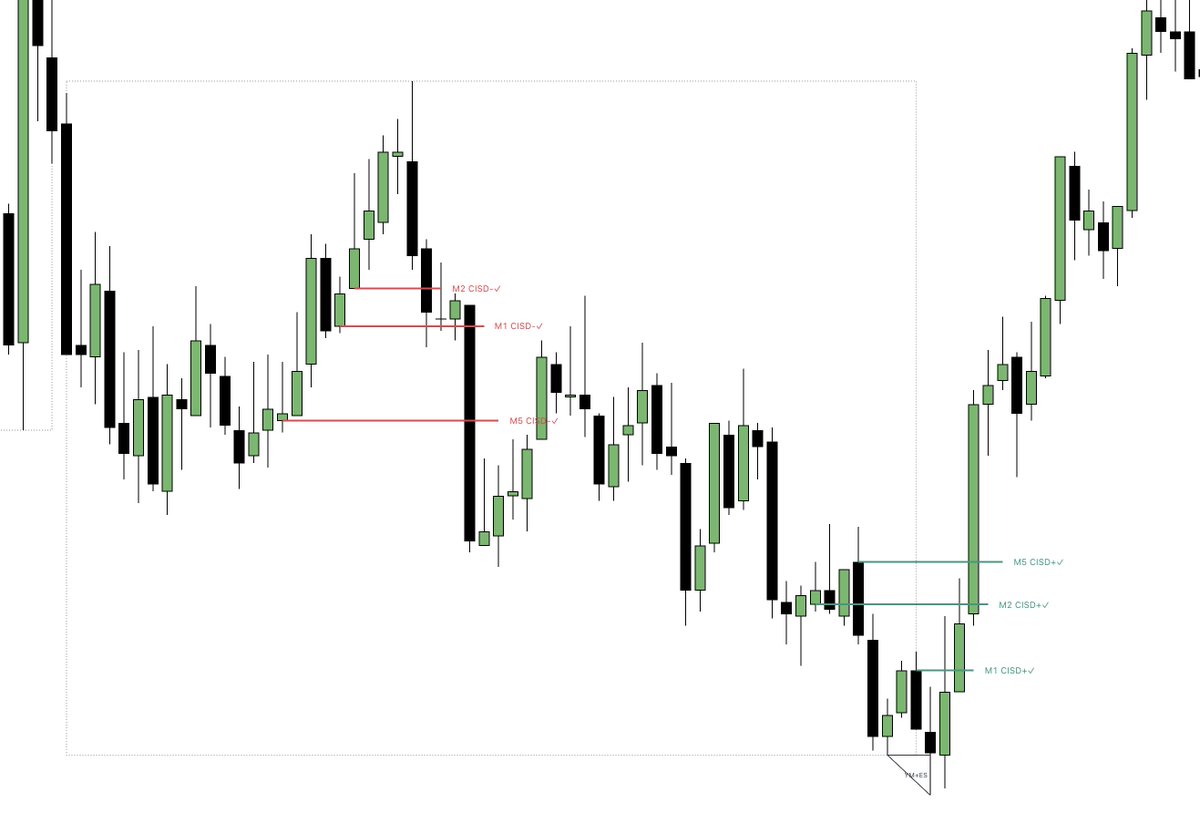
• Multi timeframe CISD
•PSP candle logic
All on ONE chart.
This wasn’t rushed.
It went through direct review with TradingView moderators and is fully compliant.
This is just the beginning.
Question:
If you had this as open source…
what would you add, change, or build on top of it? 👇
#NQ #FuturesTrading #ICT
👇 Access → link in first comment
Herman Trading@RHerman
The FREE Multi Timeframe Fractal Map [Herman] is finally finished. If you know TTrades, the Fractal Model, HTF candle logic, liquidity sweeps, SMT and top-down execution… you’ll immediately understand why I built this. After weeks of work, refinement, and feedback from the community, I’ve now completed the indicator and submitted the latest draft version to TradingView moderators. Now I’m waiting for their decision. I’m taking this process seriously because I want this release to be bulletproof before it goes public. I fully expect a wave of reports once it launches, especially because this sits in the same broader conversation as tools traders associate with TTrades, the Fractal Model, HTF mapping, and ICT-style execution. That’s exactly why I chose to work directly with TradingView moderators before release. I do not want the indicator getting ghosted. I want it reviewed properly. I want it compliant. And I want it to stay live once published. The goal from day one was simple: Build a FREE tool that helps traders read the market from top to bottom on one chart. Multi Timeframe Fractal Map [Herman] was designed to help visualize: -HTF candle structure on one screen -5m / 15m / 1H / 4H / Daily context -liquidity sweeps -SMT divergence -multi-timeframe CISD -FVG / iFVG inside HTF structure -PDH / PDL / Daily Open / Midnight Open -PSP candle logic -broader market structure delivery across timeframes This is not about copying someone else’s paid tool. It’s about building a FREE market structure map that gives traders clearer context, cleaner top-down analysis, and a better view of how price is delivering across higher and lower timeframes. Hopefully I’ll be able to release it for free very soon. Now we wait for the green light from TradingView. Would you rather see a tool like this published as open-source… or protected so no one can repackage and resell it? #TradingView #FuturesTrading
English
MF trades retweetledi

The FREE Multi Timeframe Fractal Map [Herman] is finally finished.
If you know TTrades, the Fractal Model, HTF candle logic, liquidity sweeps, SMT and top-down execution…
you’ll immediately understand why I built this.
After weeks of work, refinement, and feedback from the community, I’ve now completed the indicator and submitted the latest draft version to TradingView moderators.
Now I’m waiting for their decision.
I’m taking this process seriously because I want this release to be bulletproof before it goes public.
I fully expect a wave of reports once it launches, especially because this sits in the same broader conversation as tools traders associate with TTrades, the Fractal Model, HTF mapping, and ICT-style execution.
That’s exactly why I chose to work directly with TradingView moderators before release.
I do not want the indicator getting ghosted.
I want it reviewed properly.
I want it compliant.
And I want it to stay live once published.
The goal from day one was simple:
Build a FREE tool that helps traders read the market from top to bottom on one chart.
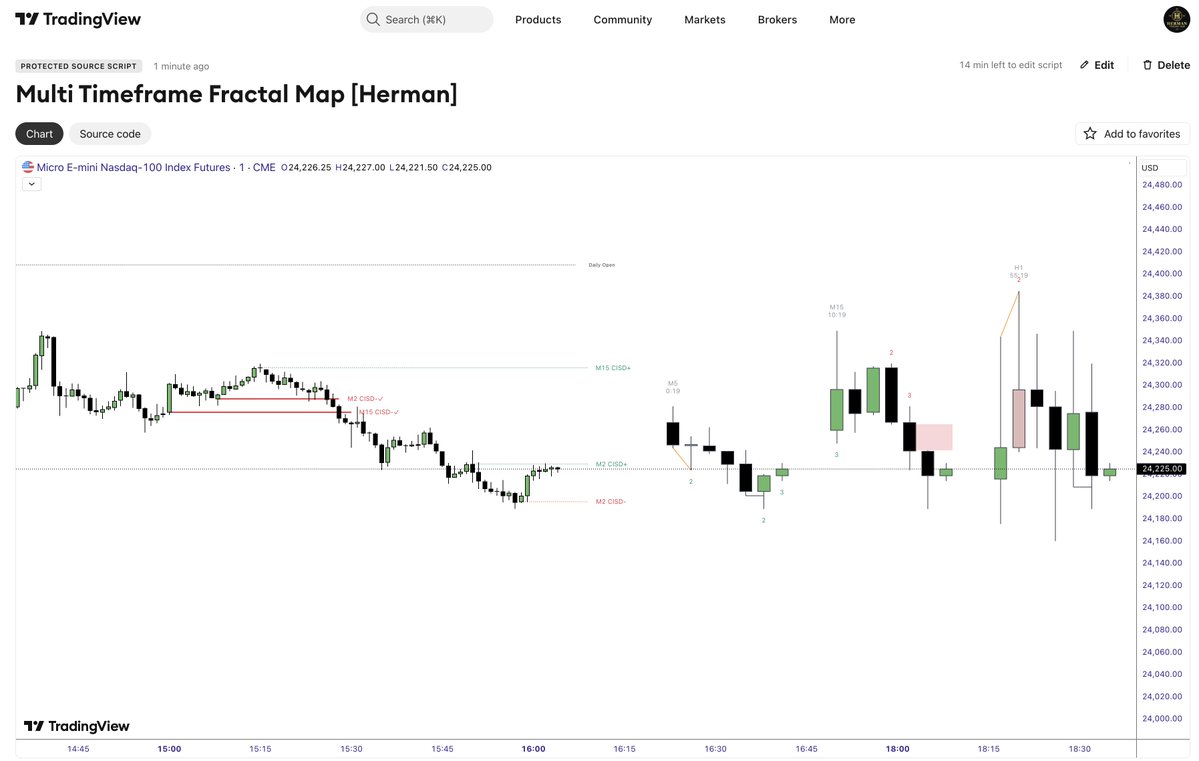
Multi Timeframe Fractal Map [Herman] was designed to help visualize:
-HTF candle structure on one screen
-5m / 15m / 1H / 4H / Daily context
-liquidity sweeps
-SMT divergence
-multi-timeframe CISD
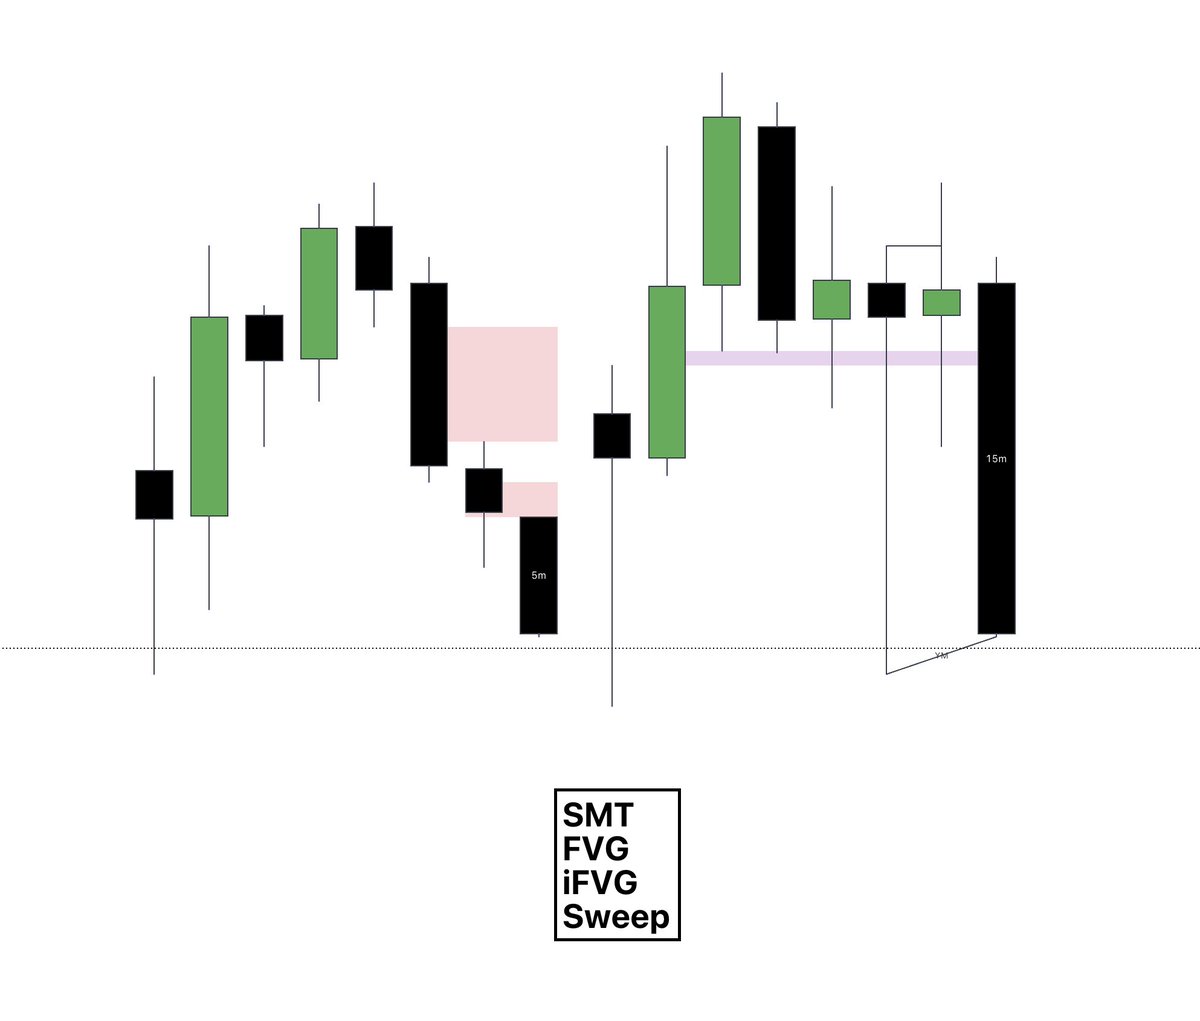
-FVG / iFVG inside HTF structure
-PDH / PDL / Daily Open / Midnight Open
-PSP candle logic
-broader market structure delivery across timeframes
This is not about copying someone else’s paid tool.
It’s about building a FREE market structure map that gives traders clearer context, cleaner top-down analysis, and a better view of how price is delivering across higher and lower timeframes.
Hopefully I’ll be able to release it for free very soon.
Now we wait for the green light from TradingView.
Would you rather see a tool like this published as open-source… or protected so no one can repackage and resell it?
#TradingView #FuturesTrading
Herman Trading@RHerman
🚨 FREE TradingView Indicator – Coming Soon... I’ve been quietly building something for the past few weeks. It’s called Fractal Map [Herman]. And yes… it will be completely FREE. This tool is inspired by the concepts many traders know: • What TTrades calls the Fractal Model • The C2 / C3 candle logic often used in ICT-style execution • The original fractal concept introduced by Bill Williams But this is NOT another trading model. It’s something different. A map of market structure designed to help you see how price is delivering across timeframes. Instead of constantly switching charts… the structure is brought directly to you. Fractal Map [Herman] includes: • HTF candle overlays (1D / 4H / 1H / 15m / 5m) • Built-in FVG & iFVG detection inside higher timeframe structures • Liquidity sweep detection to highlight manipulation before expansion • SMT divergence signals • Multi-timeframe CISD signals (default: 1m / 2m / 5m) The goal is simple: Understand where liquidity is taken, where displacement begins, and where execution actually makes sense. Again — this is not a rigid strategy. It’s a fractal map of the market. Still refining the final details. Release soon... And yes… completely FREE. #FractalModel #ICT
English

Another day building Williams Fractal Map [Herman]… and I’m about to send another draft to the moderators at TradingView before the public release.
And honestly…
this indicator is starting to look like a full market structure dashboard.
Here’s what’s already inside 👇
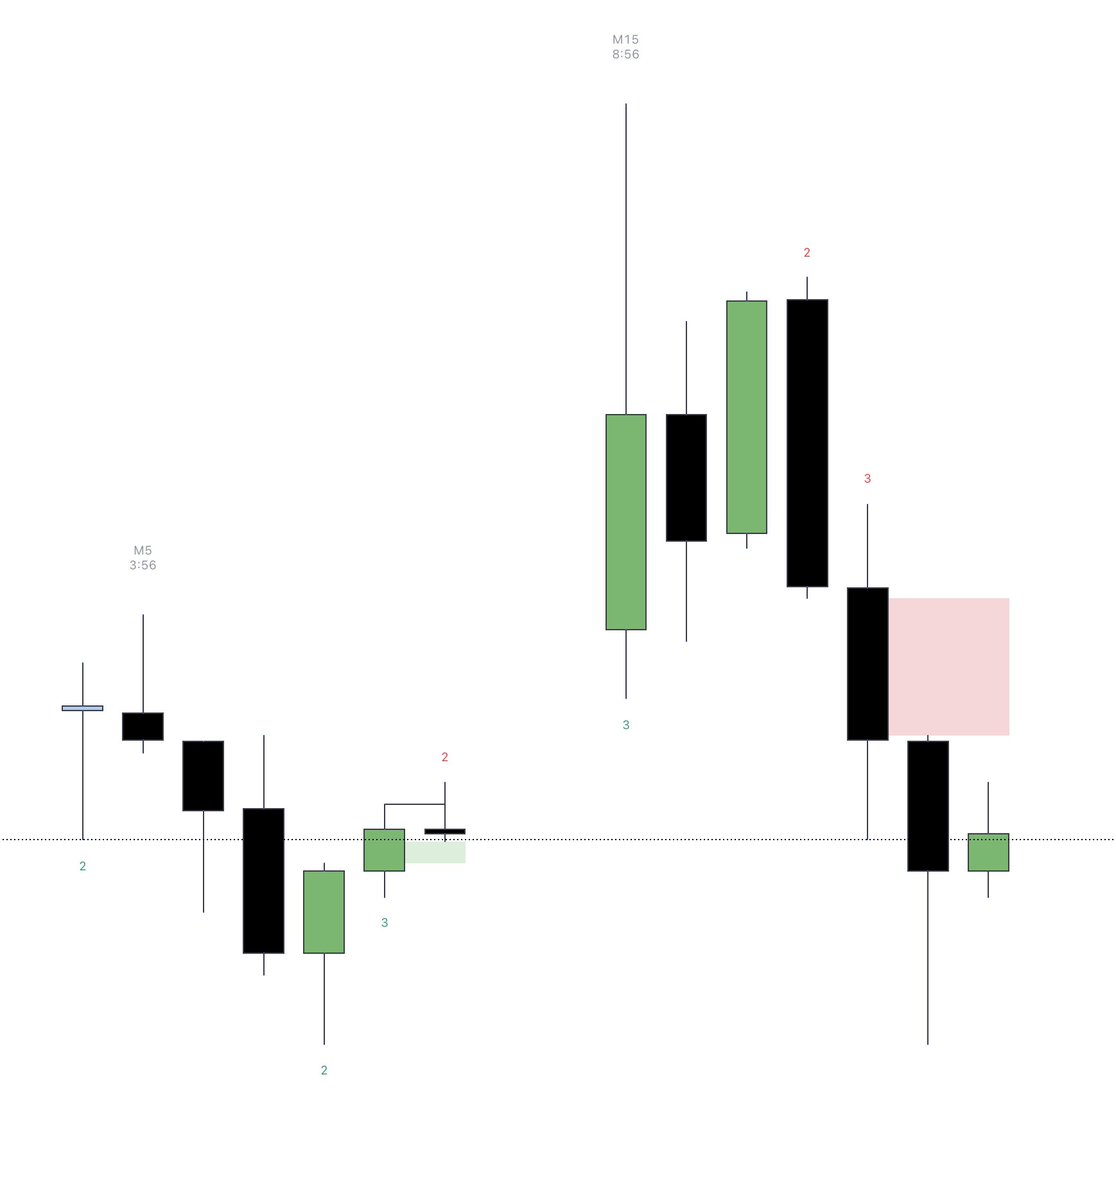
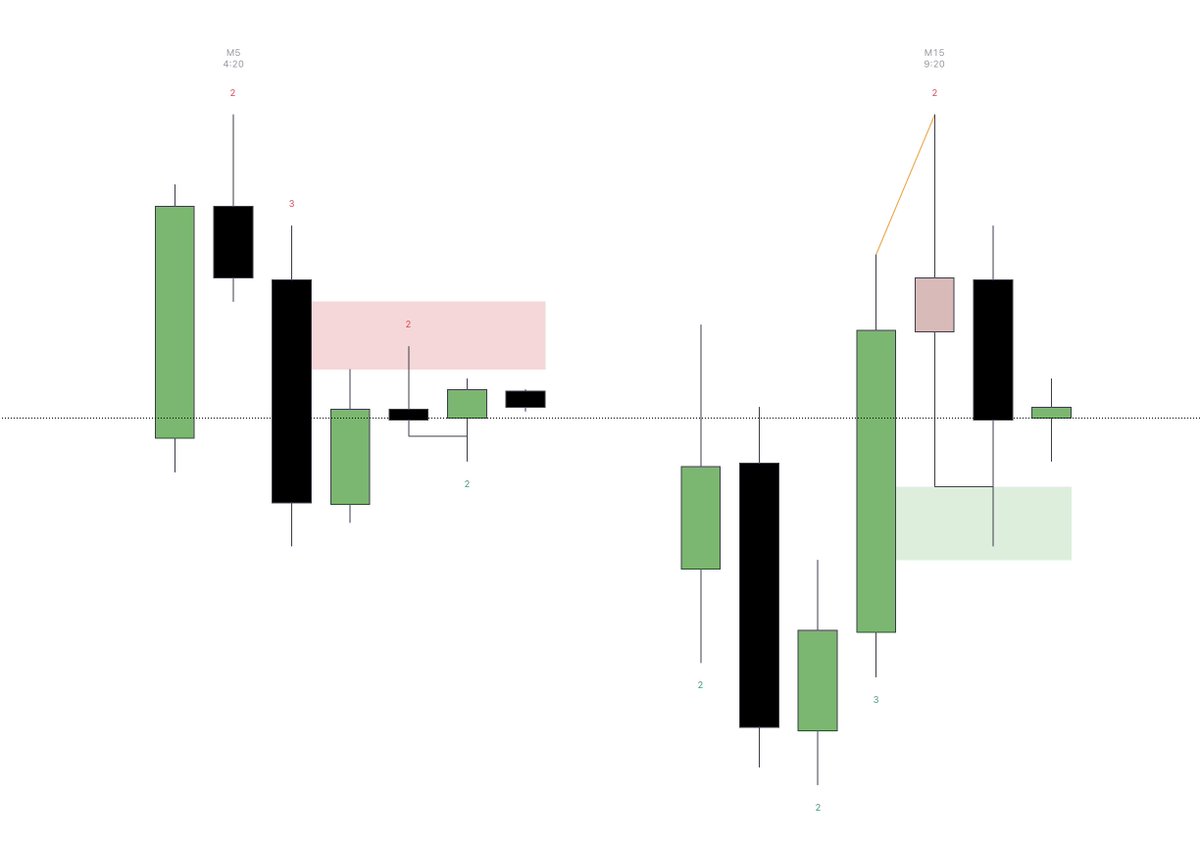
- HTF Candle Engine
Up to 5 Higher Timeframe candles plotted directly on your chart (default: 5m, 15m, 1H, 4H, Daily)
You see higher-timeframe structure without switching charts.
- Multi-Timeframe CISD
Default: 1m / 2m / 5m
This helps track displacement and structure shifts as they develop across lower timeframes.
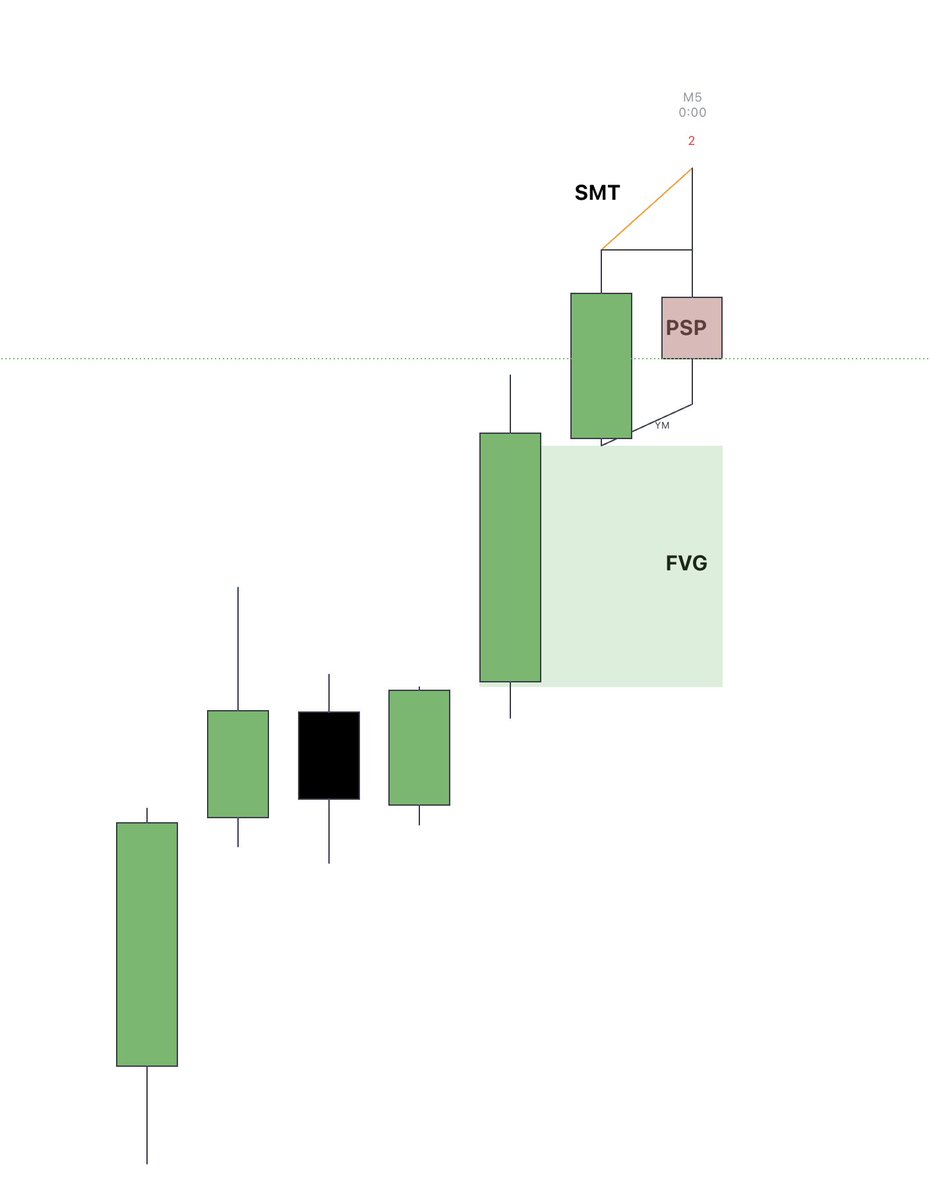
- HTF PSP Candle (Precision Swing Point)
As per your request.
If the NQ HTF candle closes bullish
but ES or YM closes bearish,
the HTF candle will immediately show that inter-market imbalance.
You can instantly spot divergence inside higher-timeframe structure.
Also added:
• Liquidity Sweep Detection
• SMT Divergence
• FVG & iFVG inside HTF candles
• PDH / PDL levels
• Daily Open
• Midnight Open
Plus time separators for structure clarity:
5m | 15m | 1H | 4H
So you can visually see how liquidity and displacement develop through the session.
I also added a Prediction Table based on candle relationship - but I’m honestly not sure if it belongs in this tool or if it makes things too complex.
Before I send the next draft to the moderators at TradingView:
What would YOU add to a market structure indicator like this?
Anything missing that serious futures traders actually use?
Curious what the community would want to see in the final version.
#TradingView #fractal

Herman Trading@RHerman
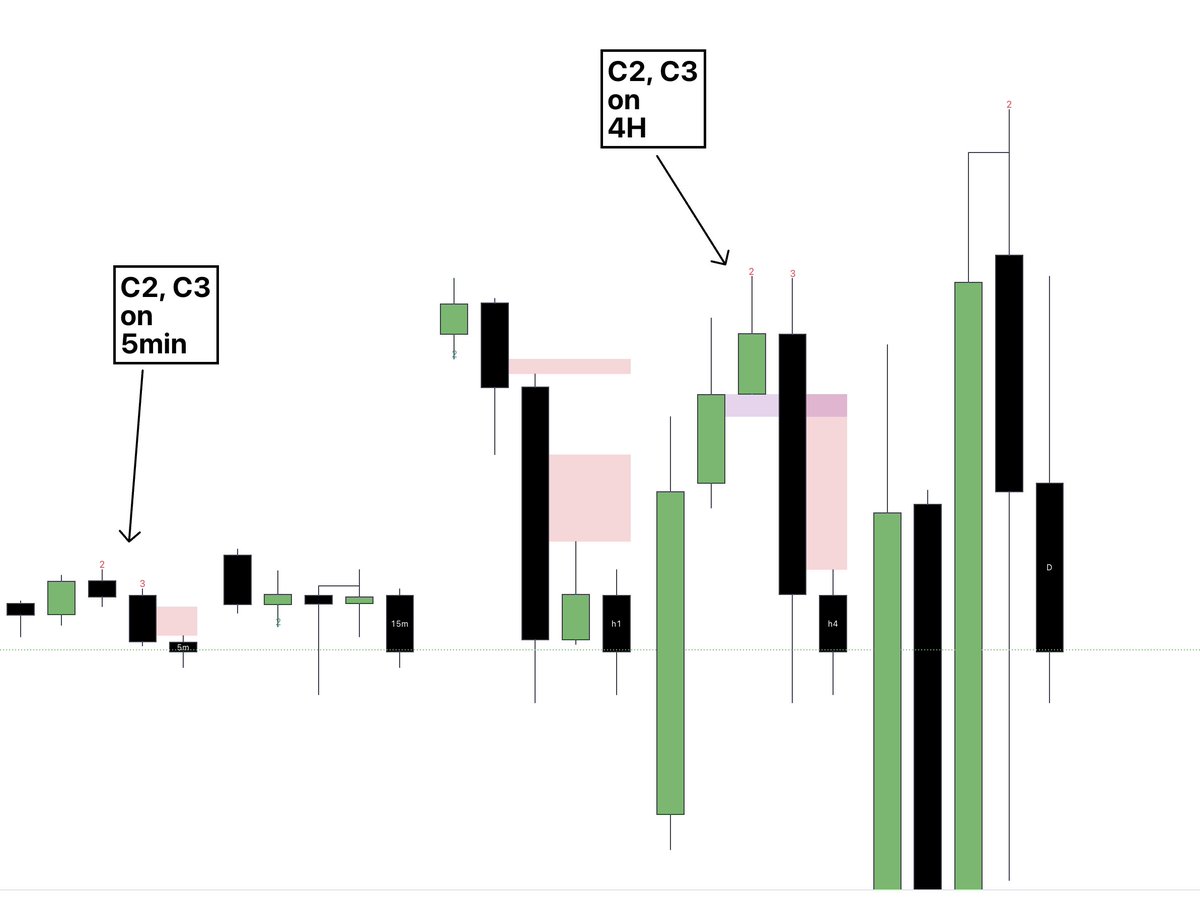
Update on this. Since posting this, I’ve been in direct contact with TradingView moderators to make sure the upcoming release is fully compliant with platform rules. Why? Because I’m realistically expecting a wave of reports from one particular community once the indicator goes live. So instead of reacting later, I decided to handle it proactively. For clarity: Williams Fractal Map [Herman] is not a trading model and it’s not copying anyone’s private material. The concept behind the indicator connects ideas traders already know: • what some call the Fractal Model (C2 / C3) • ICT-style execution concepts • and the original Bill Williams fractals But the purpose is different. This tool is simply a map of market structure designed to help traders see how price delivers across timeframes. Nothing proprietary. Just market structure, liquidity and fractals. And yes — the indicator will still be completely FREE. Release soon.... #TradingView #Fractal
English

Another update for you all. As always all credit goes to @dyk_ceph @whenislunch.Their open source code made it possible
tradingview.com/script/ZLZ2xA7…

English


🚨 FREE TradingView Indicator – Coming Soon...
I’ve been quietly building something for the past few weeks.
It’s called Fractal Map [Herman].
And yes…
it will be completely FREE.
This tool is inspired by the concepts many traders know:
• What TTrades calls the Fractal Model
• The C2 / C3 candle logic often used in ICT-style execution
• The original fractal concept introduced by Bill Williams
But this is NOT another trading model.
It’s something different.
A map of market structure designed to help you see how price is delivering across timeframes.
Instead of constantly switching charts…
the structure is brought directly to you.
Fractal Map [Herman] includes:
• HTF candle overlays
(1D / 4H / 1H / 15m / 5m)
• Built-in FVG & iFVG detection inside higher timeframe structures
• Liquidity sweep detection
to highlight manipulation before expansion
• SMT divergence signals
• Multi-timeframe CISD signals
(default: 1m / 2m / 5m)
The goal is simple:
Understand where liquidity is taken,
where displacement begins,
and where execution actually makes sense.
Again — this is not a rigid strategy.
It’s a fractal map of the market.
Still refining the final details.
Release soon...
And yes… completely FREE.
#FractalModel #ICT

English