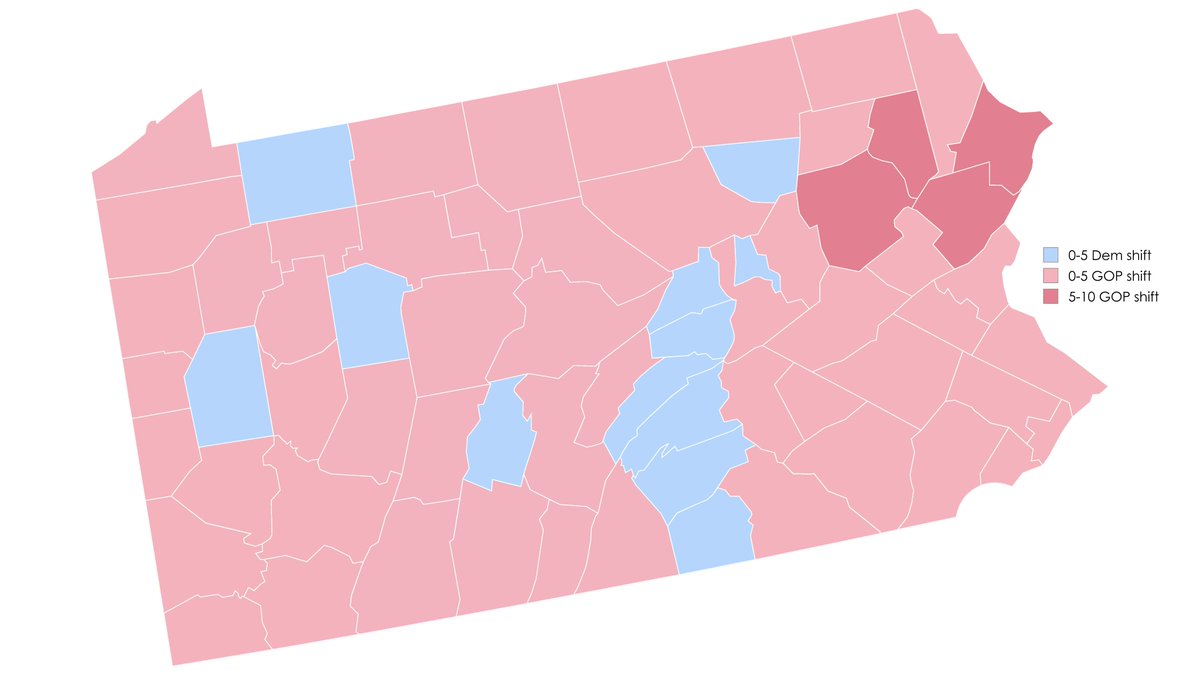
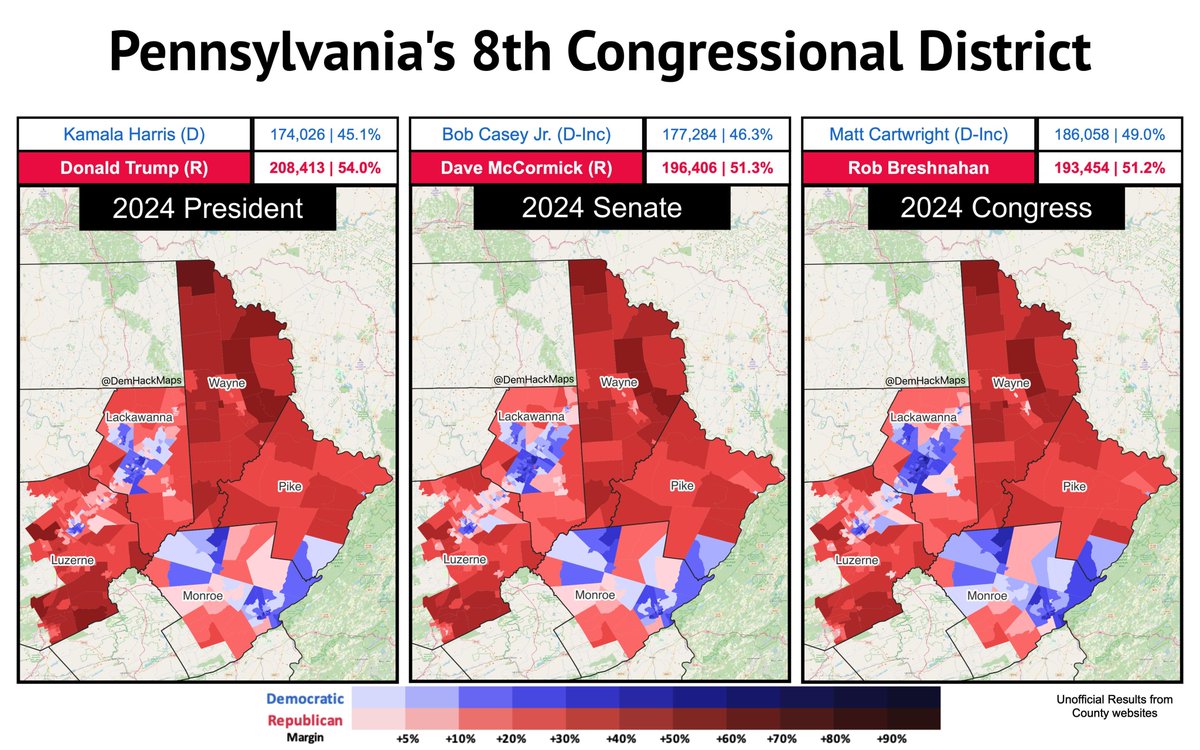
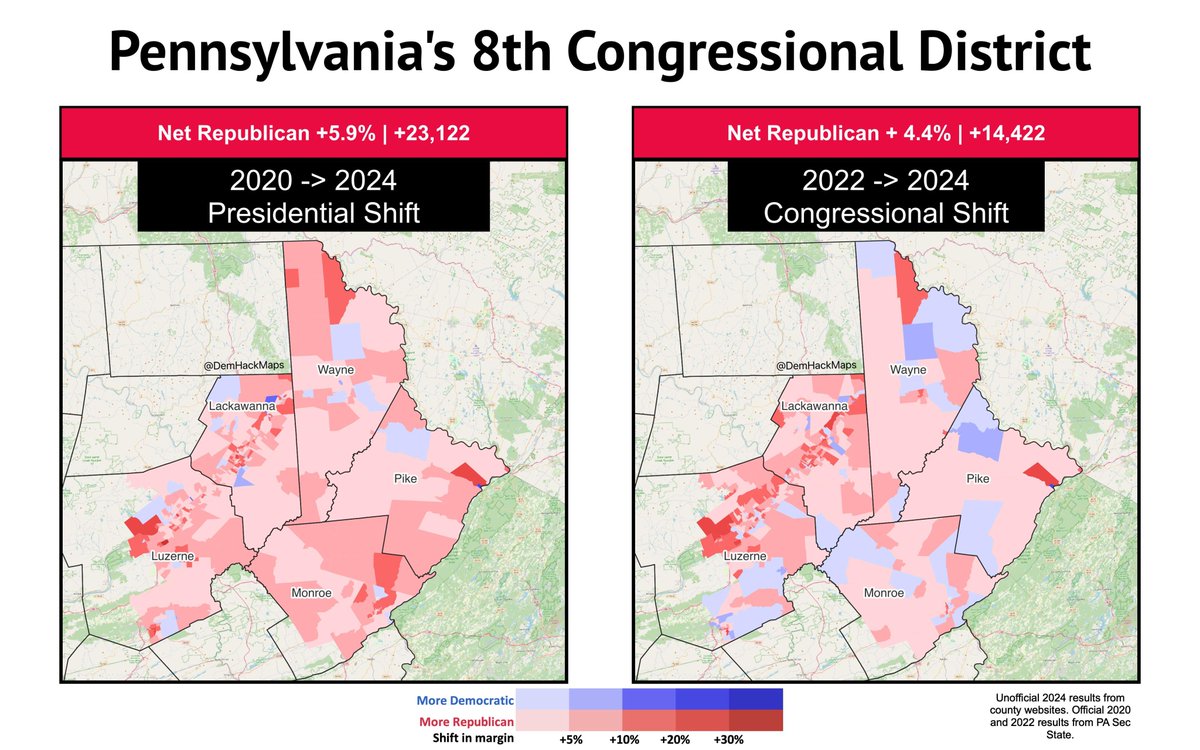
#ElectionTwitter Here's a map of the swing by county in Pennsylvania from 2020 to 2024. Trump made gains throughout the state, with the largest shifts happening in the Scanton-Wilkes Barre area (where Biden grew up) and in Pike & Monroe (which are in the NYC media market)
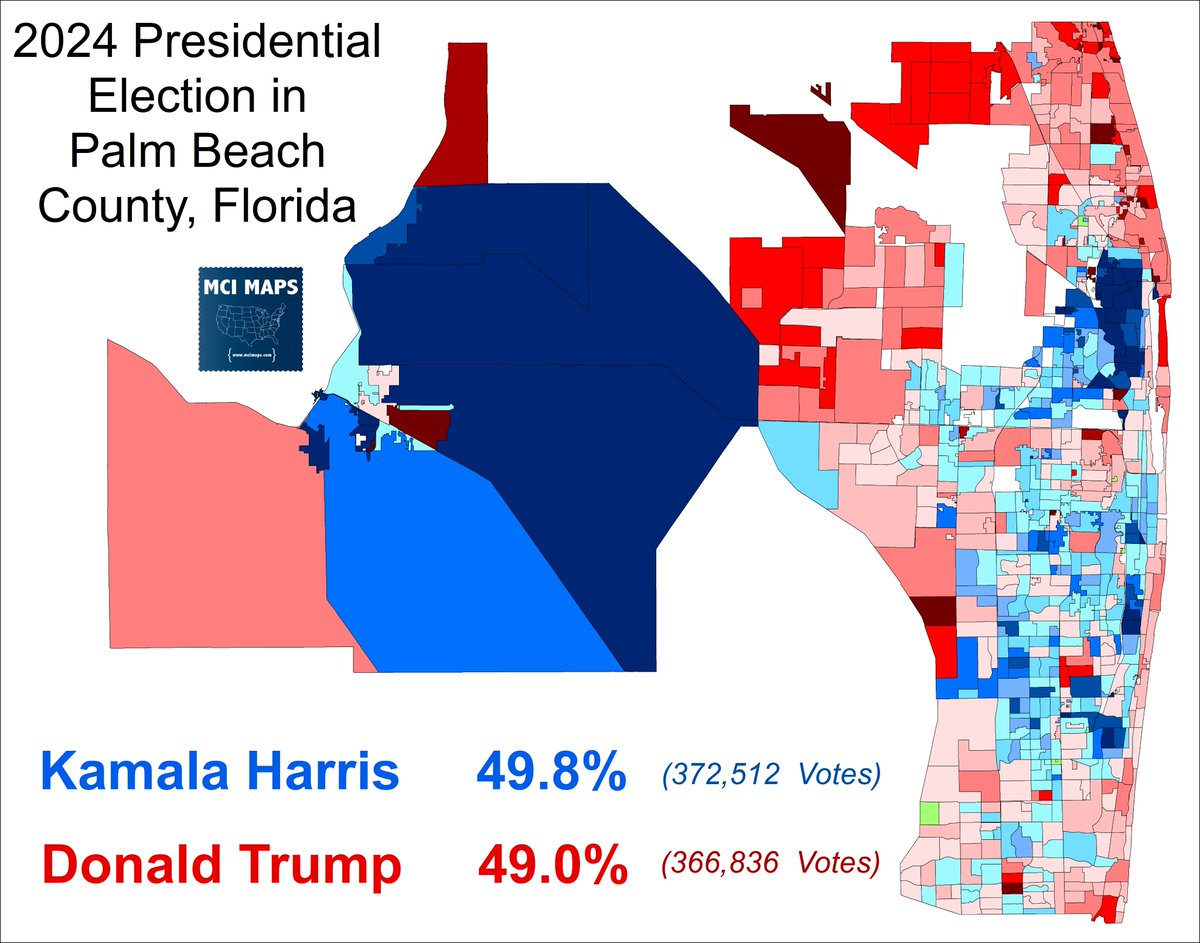
Palm Beach County went from voting for Biden by 13% to backing Harris by just under 1% of the vote
Harris lost massive ground with Hispanic voters. the majority-Hispanic HD89 went from Biden +19 to Harris +1.
How Jewish voters swung will require a bit more digging #flapol
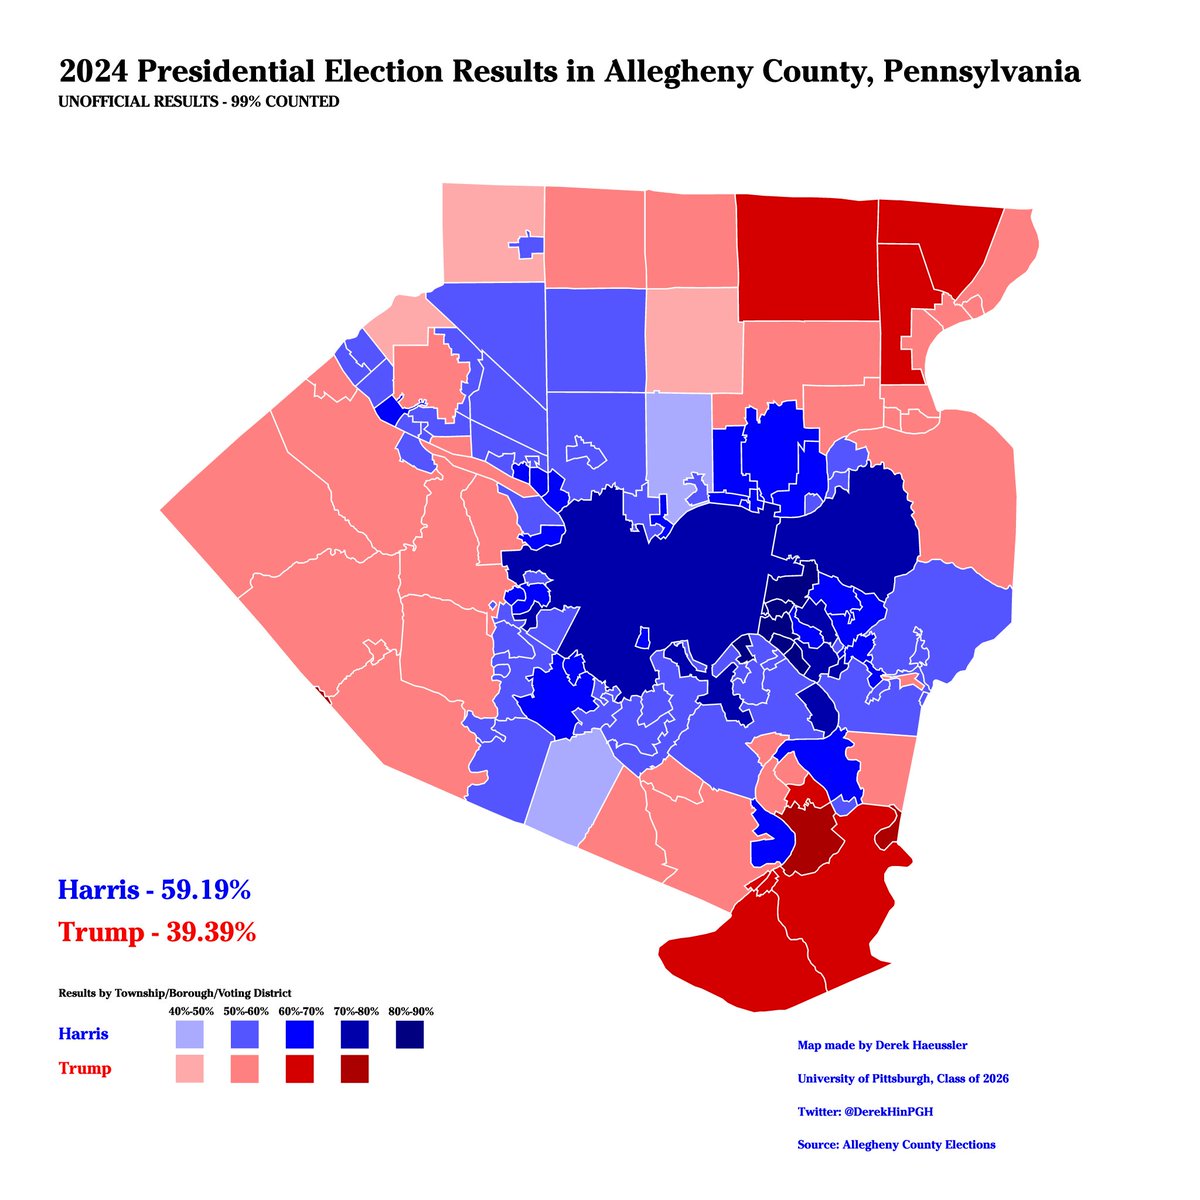
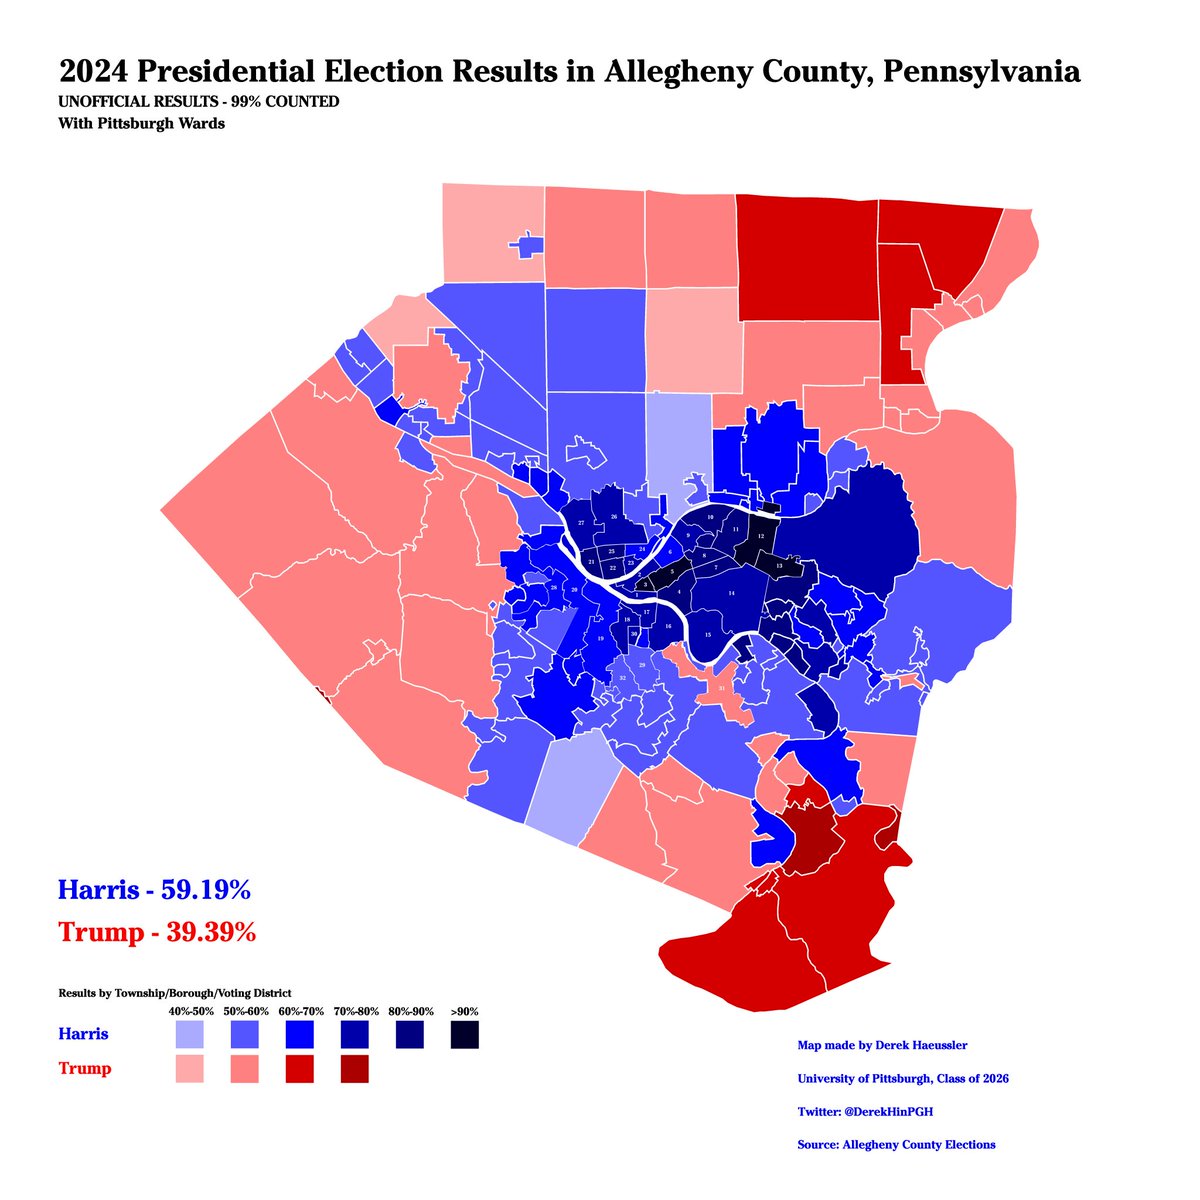
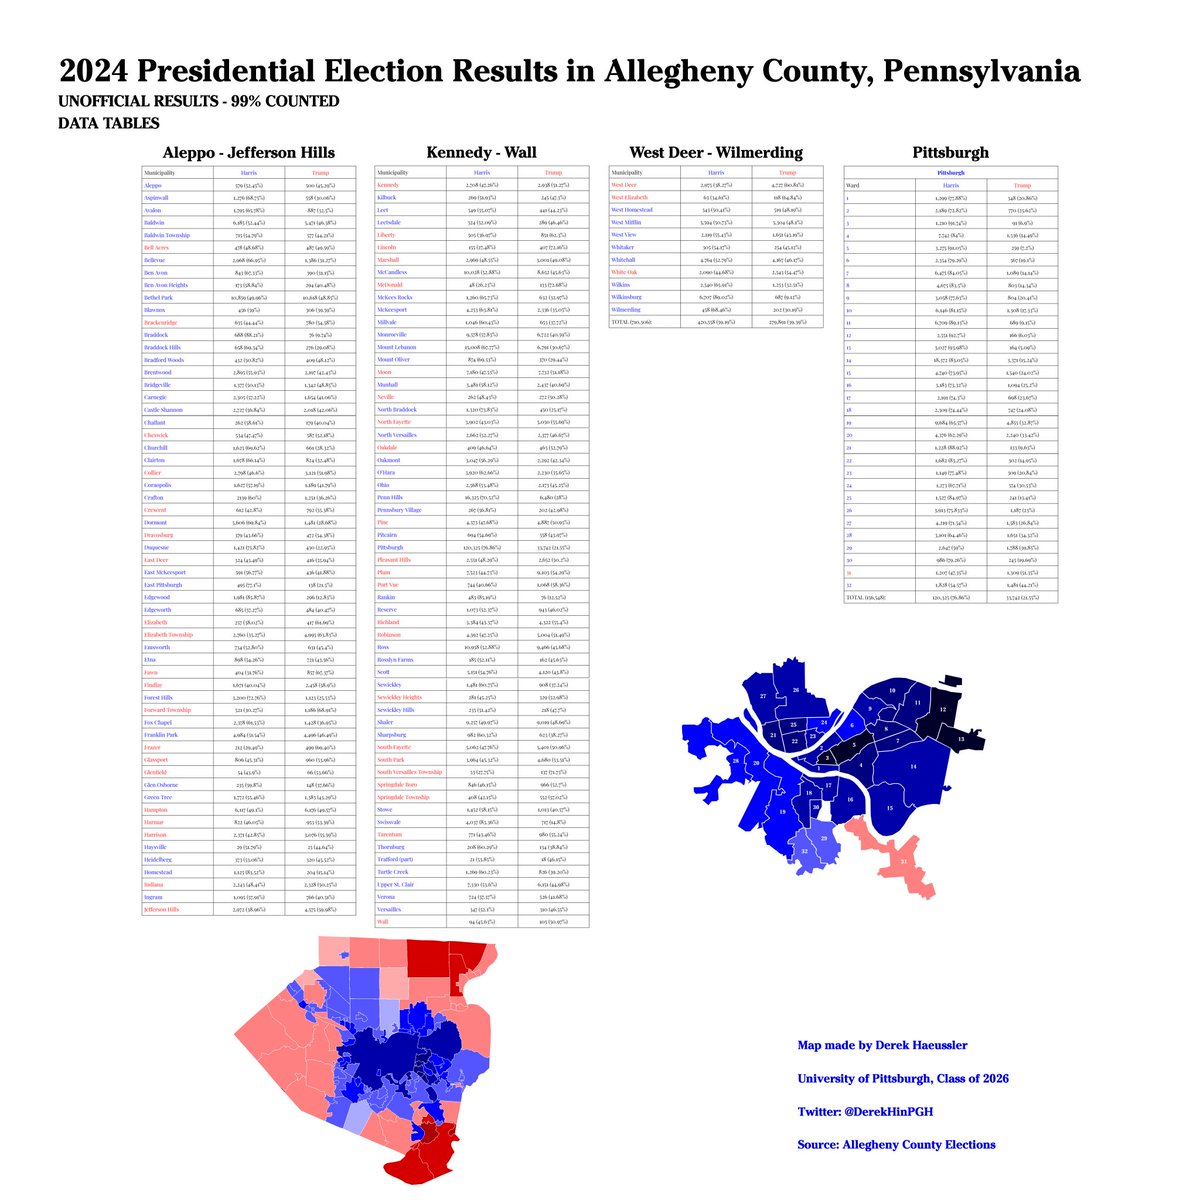
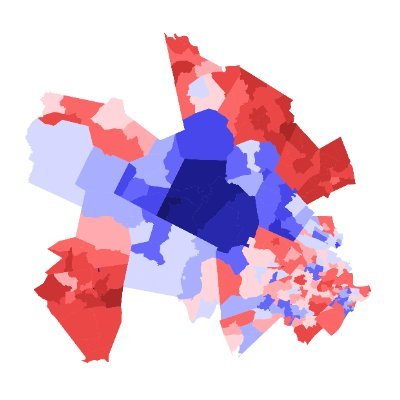
The map shows a slight change in coalition in Allegheny. Harris was able to flip Shaler + Bethel Park, but lost Marshall + fell below 40% in Jefferson Hills.
Otherwise, Harris seems to have matched Biden's numbers or do slightly below them elsewhere. Also included are PGH Wards.
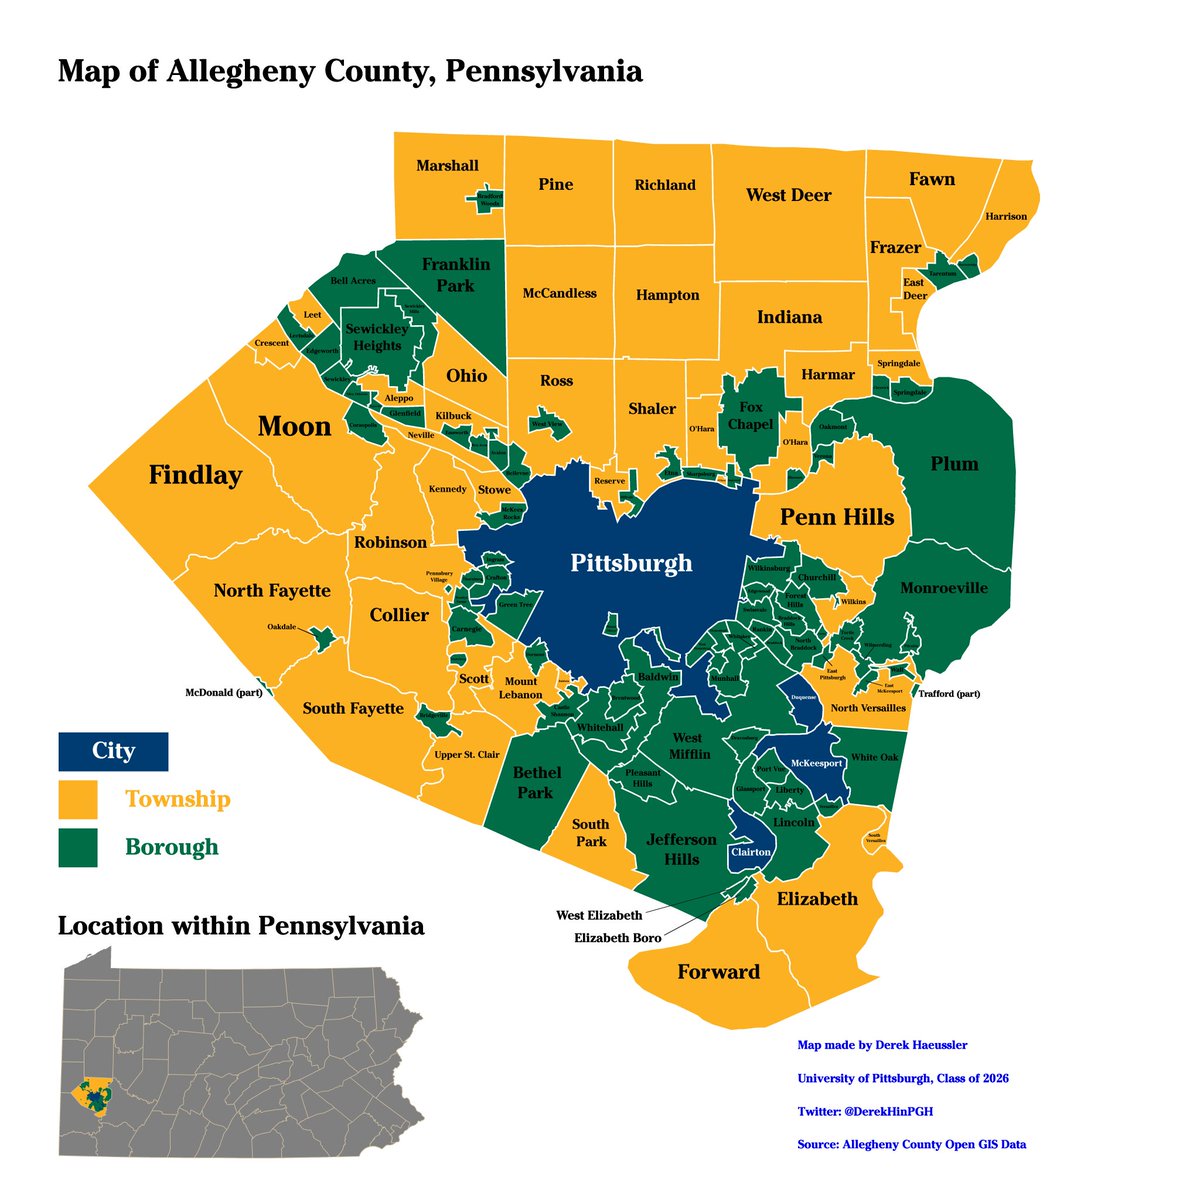
If you're unfamiliar with the area, let's run it back real quick. I made a a map of it this summer.
Allegheny County is the most populous county in SW Pennsylvania, home to ~1.225 million Yinzers. It houses 130 municipalities total + a lot of hills. Lots of them. ⛰️⛰️⛰️⛰️
Behold - the 2024 United States Presidential Election in Allegheny County, Pennsylvania.
Allegheny County was the only county in Pennsylvania to not swing heavily to the right in the election. 🧵
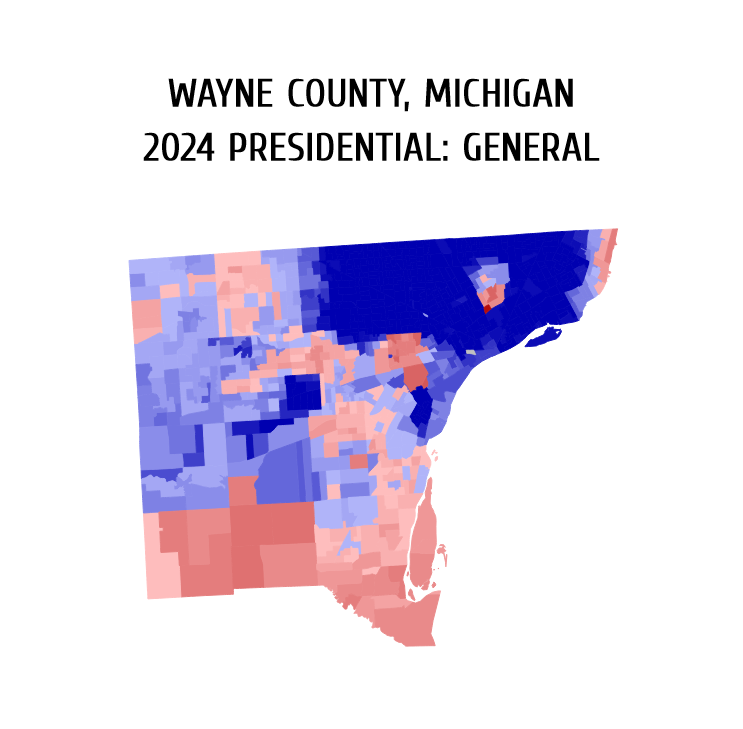
Here is a precinct map of the 2024 presidential election in Wayne County, Michigan, based on Harris vs. Trump numbers.
🔵 Kamala Harris (D): 536,581 votes (62.5%)
🔴 Donald Trump (R): 288,778 votes (33.6%)
🟡 Others: 33,424 votes (3.9%)
#ElectionTwitter Here's a map of the margin by state in the 1936 presidential election. The popularity of the New Deal led FDR to sweep the country again, with his strongest areas of support being the South and West. The only states that backed Alf Landon were Vermont and Maine.
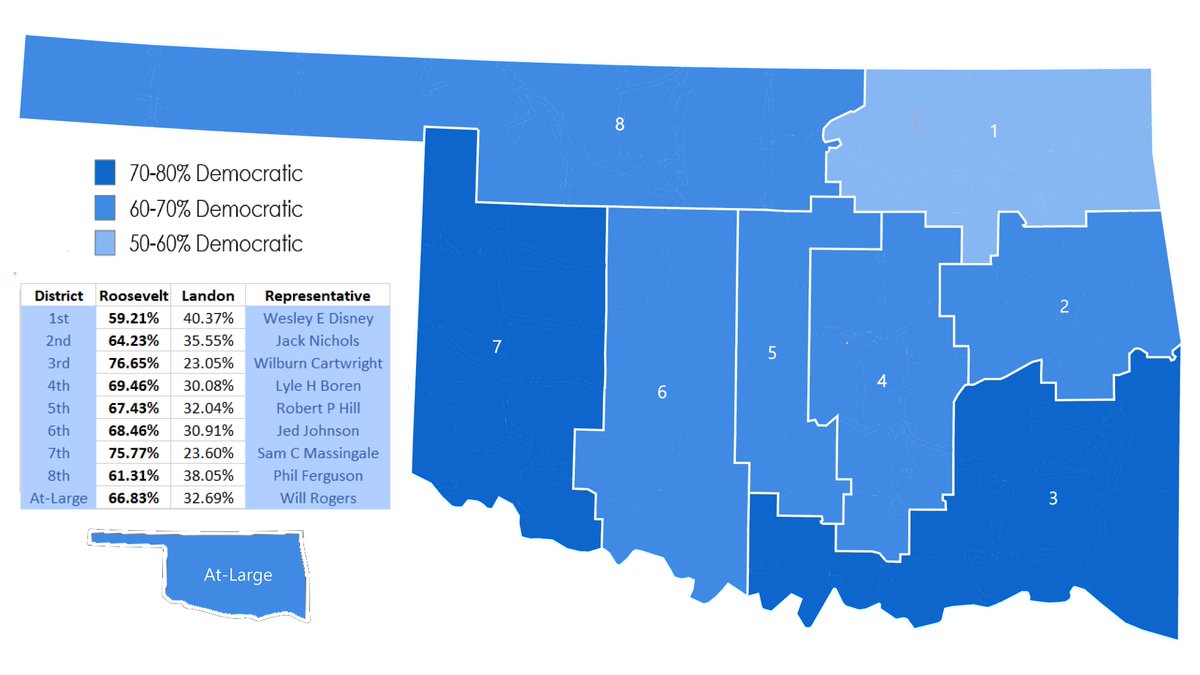
#ElectionTwitter Here's a map of the 1936 presidential election in Oklahoma by congressional district. FDR won all of the state's districts for a second time, with OK-03 and OK-07 being his strongest areas with over 70% of the vote going to the Democrats in both.
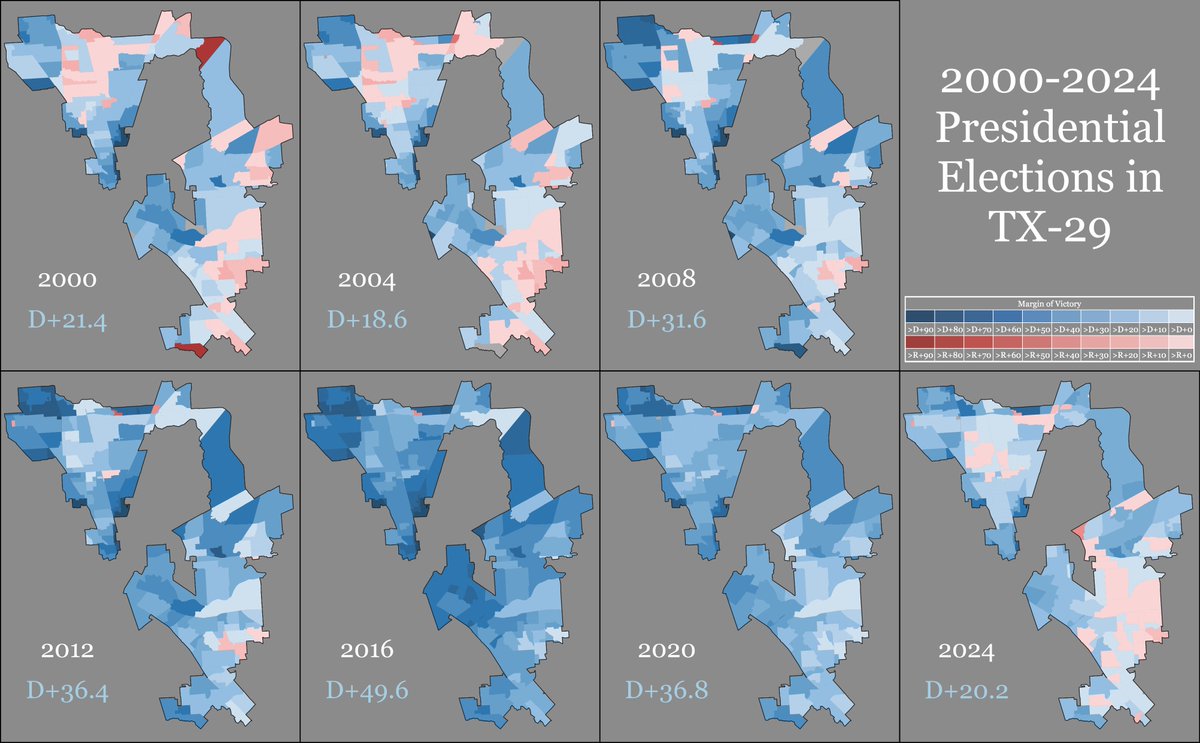
Texas's 29th congressional district located on the east side of Houston is emblematic of urban Hispanic shifts. Bush did well but between 2008 and 2016 democrats made rapid gains... all for it to come crashing back down in 2020 and 2024 to end up back at early 2000s partisanship.
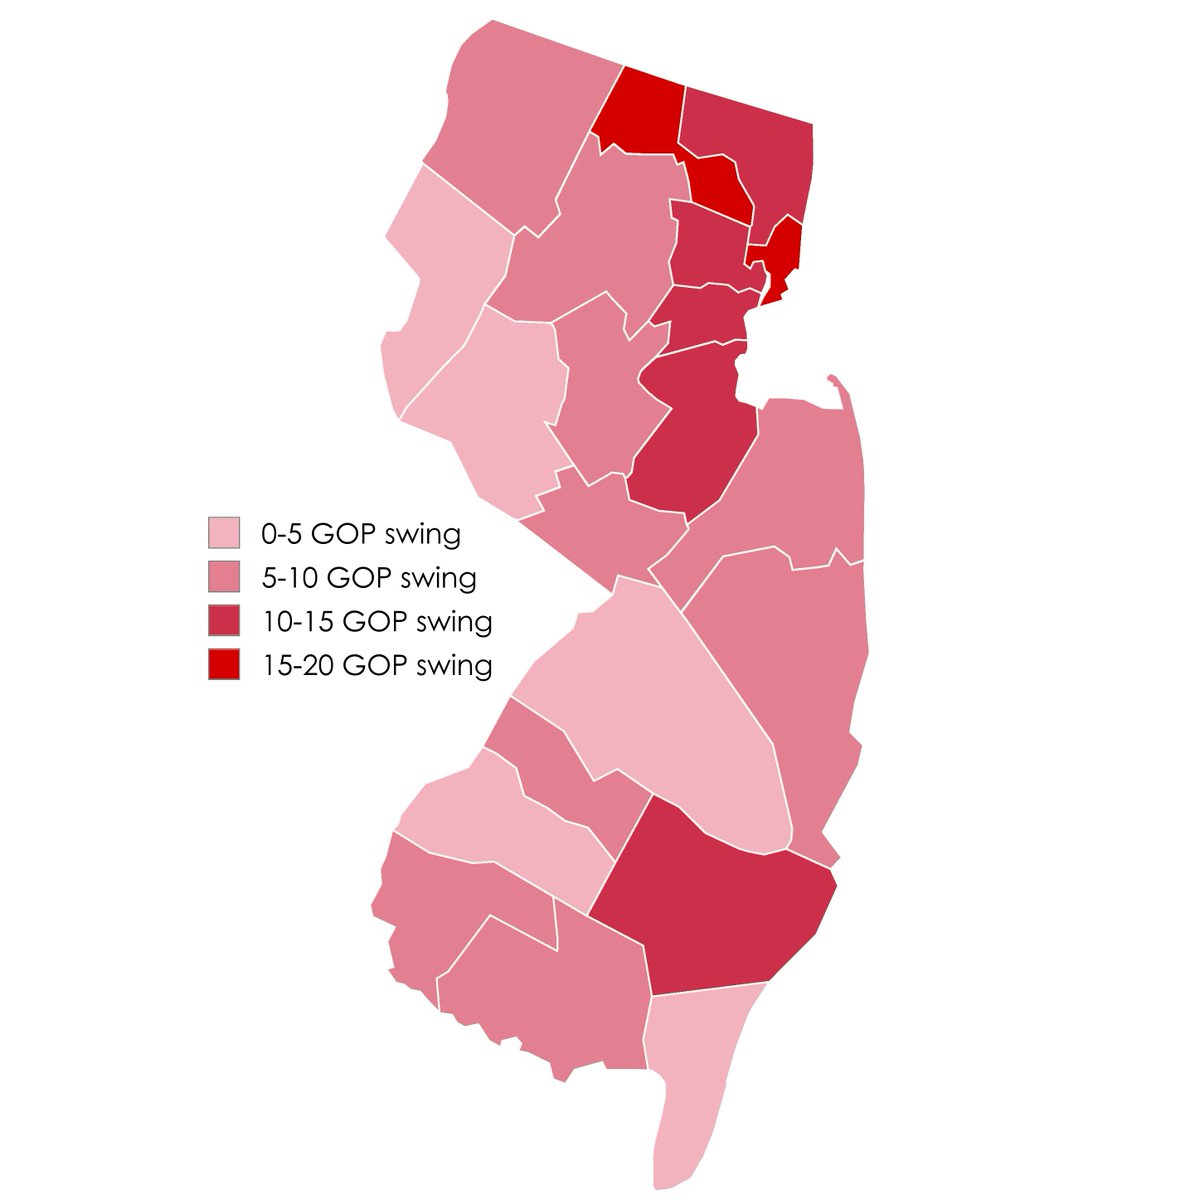
#ElectionTwitter Here's a map of the swing by county in New Jersey from 2020-2024. Trump gained through out the state, especially in the area around NYC, with the biggest shifts being 19% in Hudson and Passaic counties.
Volusia County Sheriff Mike Chitwood won re-election as an independent with a staggering 81% of the vote
Chitwood has made national headlines for his crackdown on online threats by white nationalists and a big defender of red flag laws
He's easily Florida's best sheriff #flapol
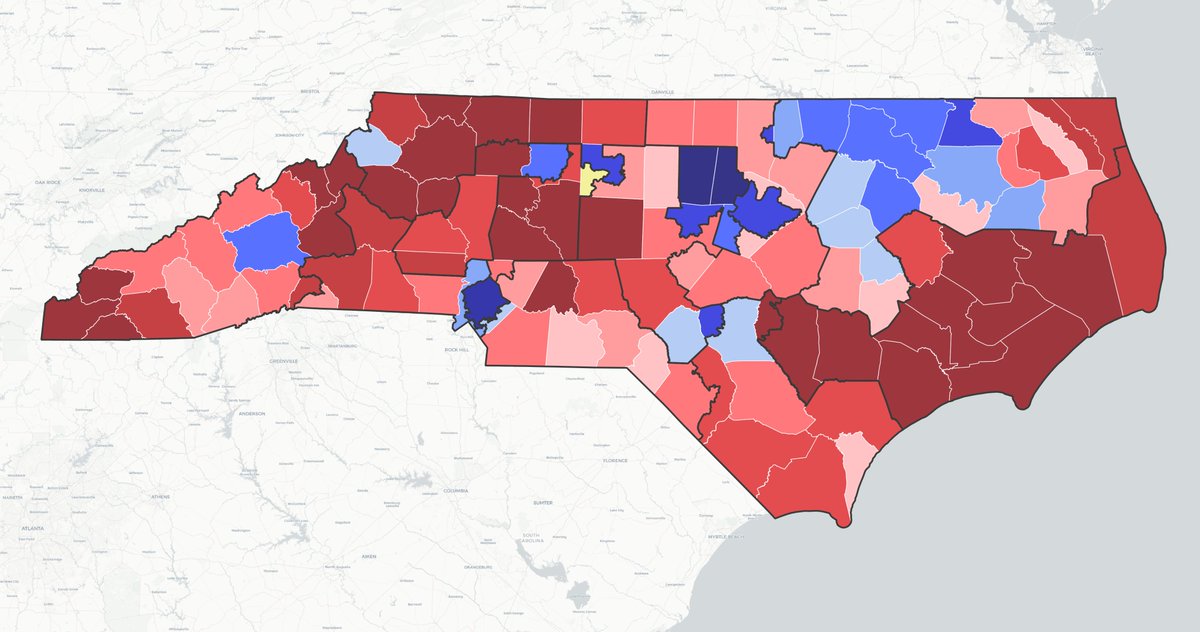
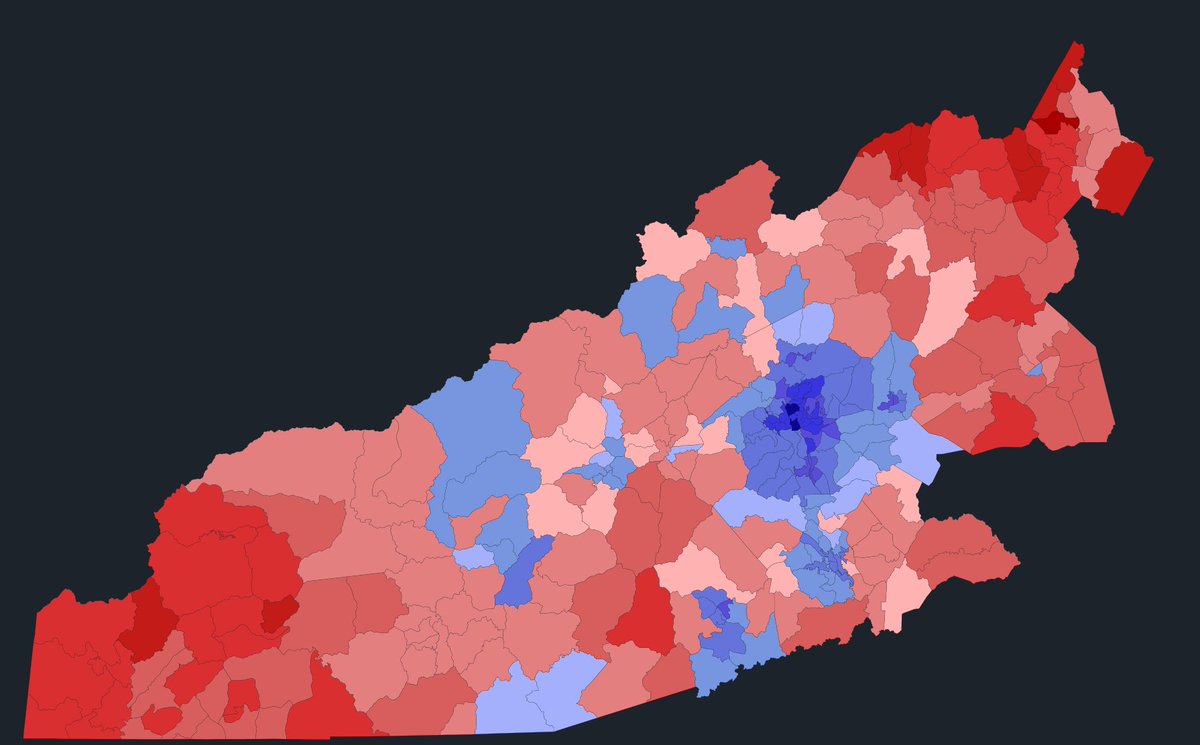
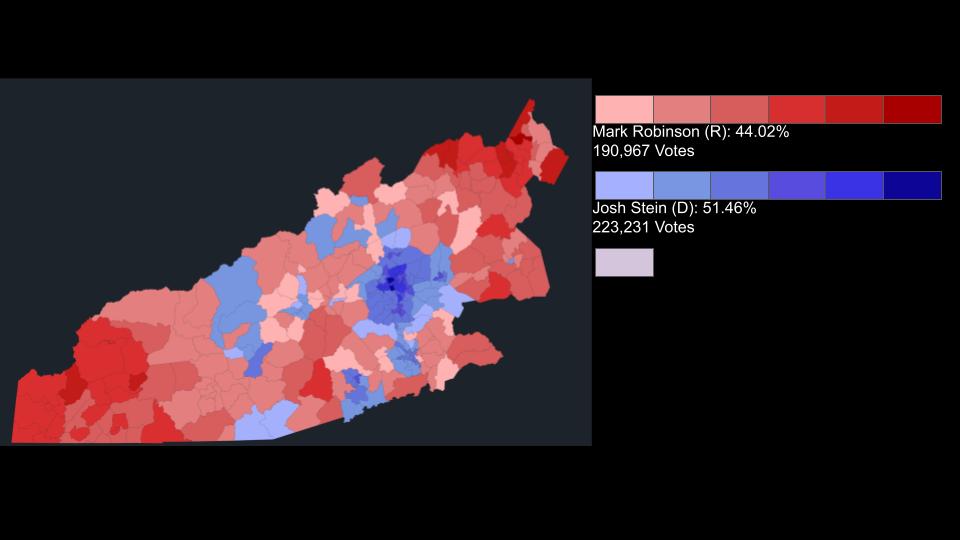
2024 North Carolina Governor Election In District 11
Mark Robinson went on to lose by 14.8% and lost the 11th house district by around 7%. His embarrasing preformance is clearly shown here. Trump won the District by 9% under running the top of the ticket by 16%. If I was Mark Robinson I wouldn't show my face in politics again.
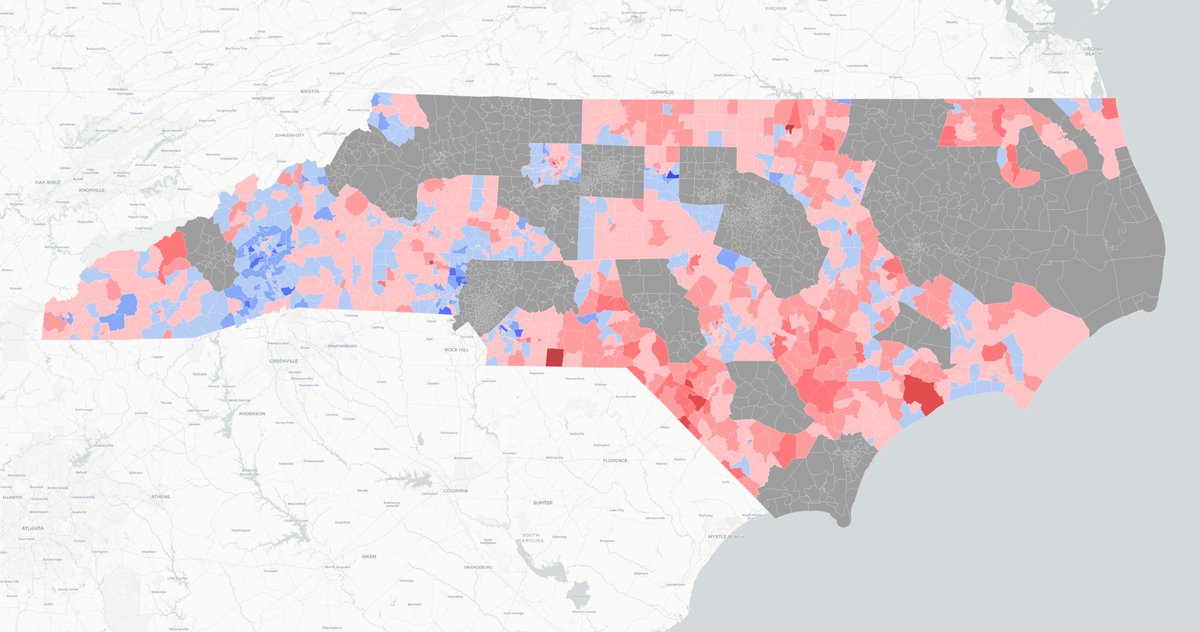
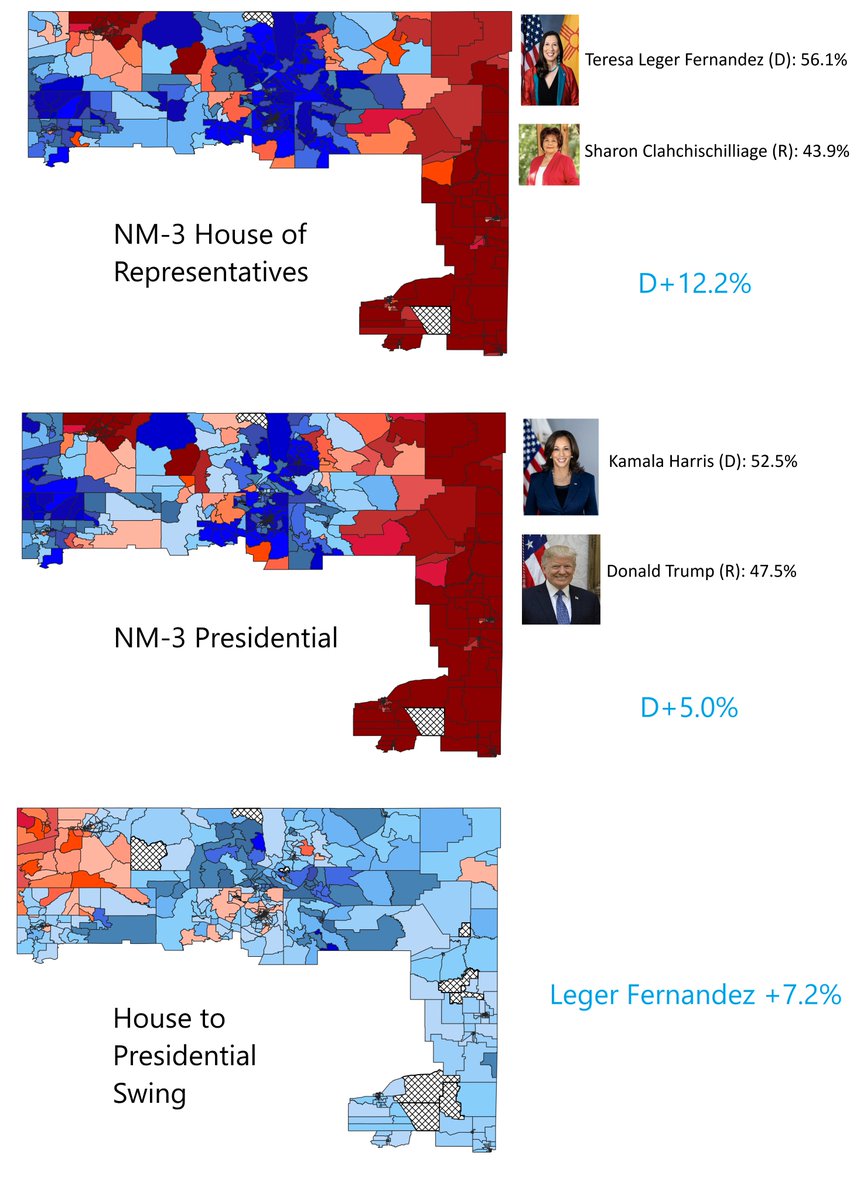
In my former home of NM-3, @TeresaForNM won by 12.2% while Kamala Harris won by just 5.0%, a 7.2% overperformance for TLF. As you can see, these overperformances were centralized in native-heavy counties like Rio Arriba, Taos, Colfax, San Miguel, and Colfax Counties.
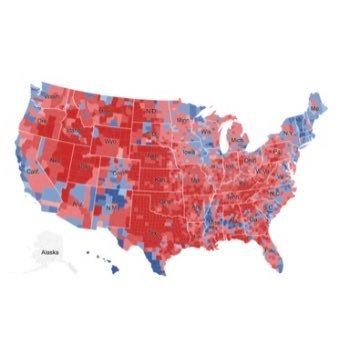
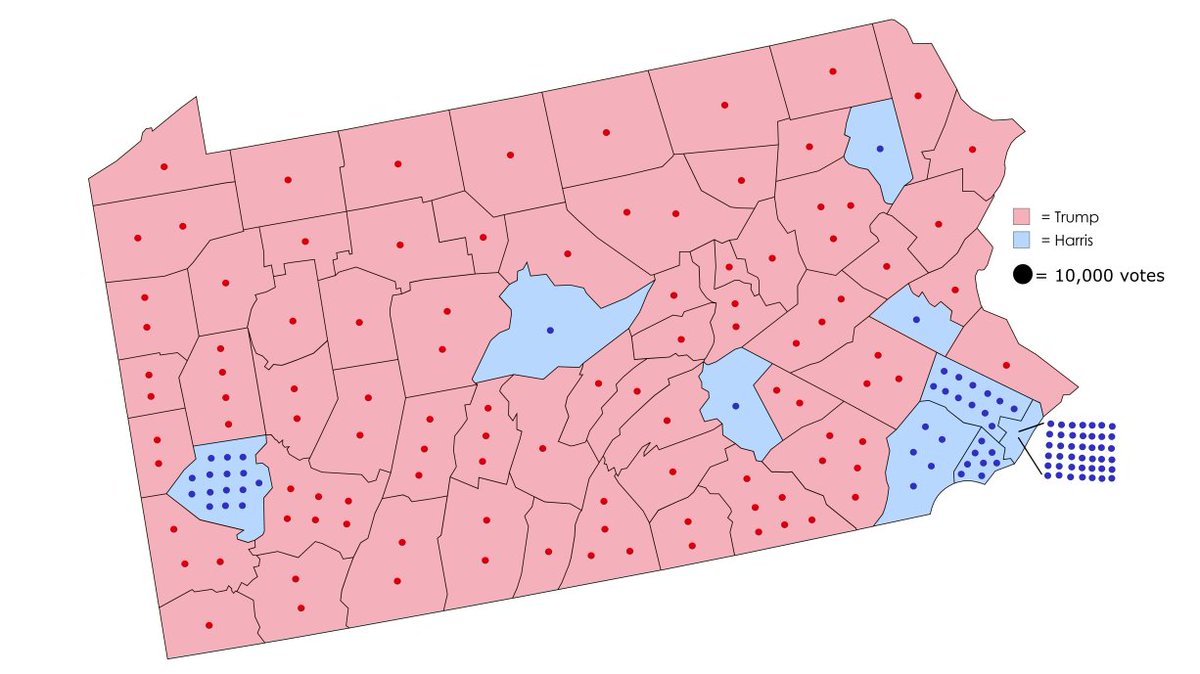
#ElectionTwitter Here's a dot map of the 2024 presidential election in Pennsylvania. Trump won the state by dominating in rural counties in central and western PA, and gained in working-class areas like Scranton and Erie.