PVI Guy ✯

5.9K posts

PVI Guy ✯ banner
PVI Guy ✯

PVI Guy ✯

@PviGuy

Posting maps of each state's Partisan Voter Index for every election https://t.co/CLcpWHtWIM

Katılım Temmuz 2020
876 Takip Edilen3.3K Takipçiler
Sabitlenmiş Tweet
PVI Guy ✯
PVI Guy ✯@PviGuy·
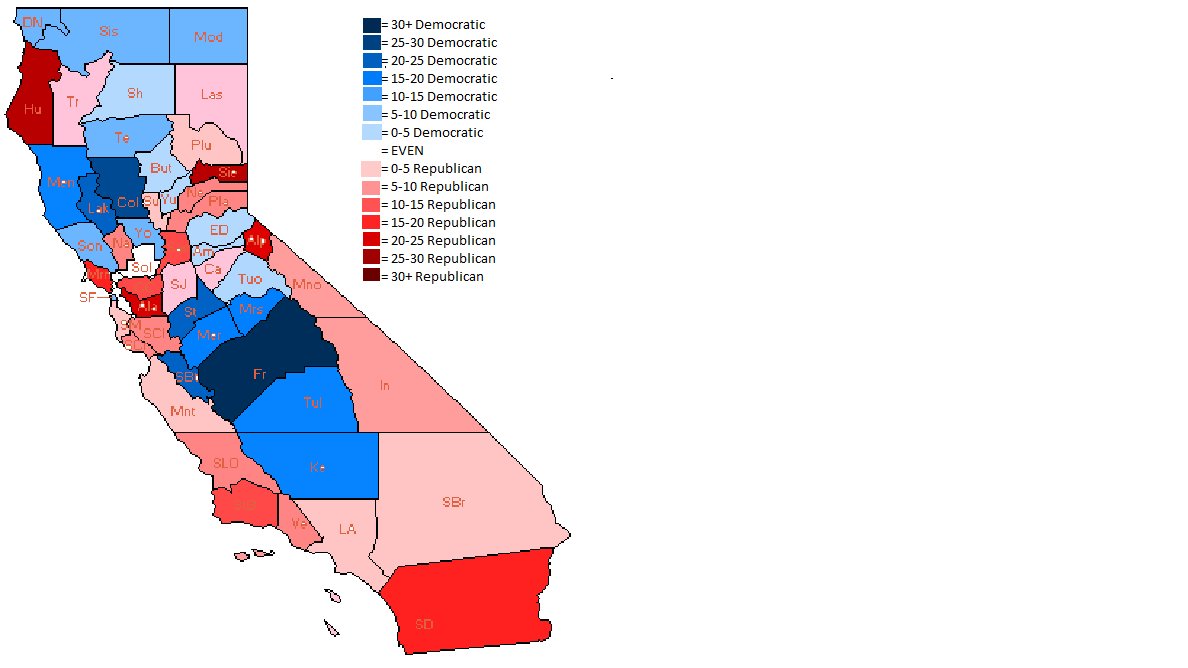
#ElectionTwitter I've created a new metric called the County Power Index, or CPI, which measures the percentage of a state's total votes that each county casts. @kilometerbryman and @lxeagle17 have helped me to make this map of CPI for every state in the country.
PVI Guy ✯ tweet media
English
15
83
411
0
PVI Guy ✯
PVI Guy ✯@PviGuy·
@wamckie That's where Savannah is, which is the 5th largest city in Georgia. Since it is a major urban area, it probably wasn't as protestant as rural south Georgia
English
1
0
1
94
w.a.mckie
w.a.mckie@wamckie·
@PviGuy Wondering why Chatham County moved so much to JFK?
English
1
0
1
98
PVI Guy ✯
PVI Guy ✯@PviGuy·
#ElectionTwitter Here's a dot map of the shift in raw votes by county in Georgia from 1956 to 1960. Kennedy lost thousands of votes in Atlanta, which caused the state to swing 9 points to the Republicans.
PVI Guy ✯ tweet media
English
4
6
23
5.9K
PVI Guy ✯
PVI Guy ✯@PviGuy·
@souljagoytellem The Civil War was actually unpopular in a lot of areas! There were draft riots in places like New York that the Democrats capitalized on
English
0
0
12
641
PVI Guy ✯
PVI Guy ✯@PviGuy·
#ElectionTwitter Here's a graph of the average PVI by decade for Washington state. The state went from being blue in the New Deal era to becoming a swing state in the postwar age, and then became increasingly blue again from the 1980s onwards as Seattle became a Dem stronghold.
PVI Guy ✯ tweet media
English
1
1
10
1.1K
PVI Guy ✯ retweetledi
Josh Metcalf
Josh Metcalf@josh_metcalf·
Presenting, finally, the 2024 presidential election in California, mapped by precinct. Swinging 9 points rightward from Biden's win in 2020, Harris' collapse in the Central Valley and among urban minorities kept her to a tepid 20 point win in the Golden State.
Josh Metcalf tweet media
English
24
81
480
68.1K
PVI Guy ✯
PVI Guy ✯@PviGuy·
As this County Power Index map shows, around 20% of Georgia's votes were cast in the Atlanta metro area in 1960. Nixon came very close to winning this area, but he would have had to win it outright in order to match Kennedy's rural strength.
PVI Guy ✯ tweet media
English
1
0
8
472
PVI Guy ✯
PVI Guy ✯@PviGuy·
#ElectionTwitter Here's a dot map of the 1960 presidential election in Georgia. Kennedy easily won the state by dominating in rural counties, while Nixon's margins in northern unionist areas and in Savannah were nowhere near enough to make the state close.
PVI Guy ✯ tweet media
English
1
7
27
4.7K
PVI Guy ✯
PVI Guy ✯@PviGuy·
#ElectionTwitter Here's a list of the top 10 metro areas where Democratic vote share increased the most from 1908 to 1912:
PVI Guy ✯ tweet media
English
0
1
10
677
PVI Guy ✯
PVI Guy ✯@PviGuy·
#ElectionTwitter Here's a map of the average margin by county in Tennessee between the 1972 and 2004 presidential elections. Democrats were strong in urban areas and retrained some support in West Tennessee, while Republicans dominated in East Tennessee and the Nashville suburbs.
PVI Guy ✯ tweet media
PVI Guy ✯@PviGuy

#ElectionTwitter Here's a graph showing how strong of a correlation there is between presidential results by county in Tennessee with the previous election. The state had highly durable political divisions until the 1960s, and then became stable again until 2008 and then 2016.

English
1
4
14
3K
PVI Guy ✯ retweetledi
Vance Ulrich
Vance Ulrich@VanceUlrich·
As California transitioned from truly a swing state to a state that at least leaned Dem in 2000, Democratic candidate Al Gore would have won 38/52 House districts under today's map. He would have only carried 3/9 House seats between Orange and San Diego Counties.
Vance Ulrich tweet media
English
4
12
192
12K
PVI Guy ✯ retweetledi
Leon
Leon@Leonz0_o·
In 1944 Incumbent president Franklin Roosevelt narrowly carried the state of New Jersey by 1 point. Roosevelt did well in some of the more heavily populated parts of the state. In north jersey FDR got 64% in Jersey city. His best area was south jersey where won 6/7 counties.
Leon tweet media
English
5
12
58
7.6K
Mark Graham
Mark Graham@gram_krackr·
@PviGuy What's the big red L in west tennessee about?
English
1
0
1
27
PVI Guy ✯
PVI Guy ✯@PviGuy·
#ElectionTwitter Here's a map of the average margin in presidential elections by county in Tennessee from 1872 to 1968. The state had intense regional divisions, with the west being solidly Democratic while the east was a bastion of Unionist Republicans.
PVI Guy ✯ tweet media
PVI Guy ✯@PviGuy

#ElectionTwitter Here's a graph showing how strong of a correlation there is between presidential results by county in Tennessee with the previous election. The state had highly durable political divisions until the 1960s, and then became stable again until 2008 and then 2016.

English
3
7
34
11.2K
PVI Guy ✯
PVI Guy ✯@PviGuy·
During the campaign, the New York Truth published a copy of what was alleged to be a letter written by James Garfield, stating his support of Chinese immigration. While this letter was later proved to be a forgery, the Democrats sent copies of it everywhere in the nation.
PVI Guy ✯ tweet media
English
2
1
8
0
PVI Guy ✯
PVI Guy ✯@PviGuy·
#ElectionTwitter In the presidential election of 1880, California was 0.17 points more Democratic than the national vote. Winfield Scott Hancock was able to eek out a victory by winning San Francisco due to a backlash against Chinese immigration.
PVI Guy ✯ tweet media
English
4
8
26
0
PVI Guy ✯
PVI Guy ✯@PviGuy·
#ElectionTwitter Here's a map of the swing by state between the 1876 and 1880 presidential elections. Garfield managed to win by flipping the crucial states of New York and Indiana, though Hancock did flip Nevada and California due to anti-Chinese backlash.
PVI Guy ✯ tweet media
English
2
5
24
2.8K